


Trading risk management is a process for defining and limiting acceptable loss before a position is opened. It connects the trade thesis to an invalidation level, cash risk, position size, portfolio exposure and a drawdown response. It cannot remove losing trades or make a market predictable; its purpose is to keep one adverse outcome or losing streak from dictating the entire account.
This article is educational and does not recommend a particular instrument, broker or risk percentage.
What Is Trading Risk Management?
Risk management starts before entry. Write the context and trigger, define what would disprove the idea, estimate the loss at that point and check how the position interacts with existing exposure. A strong setup can still be a poor decision if the size is too large or the cost and liquidity assumptions are unrealistic.
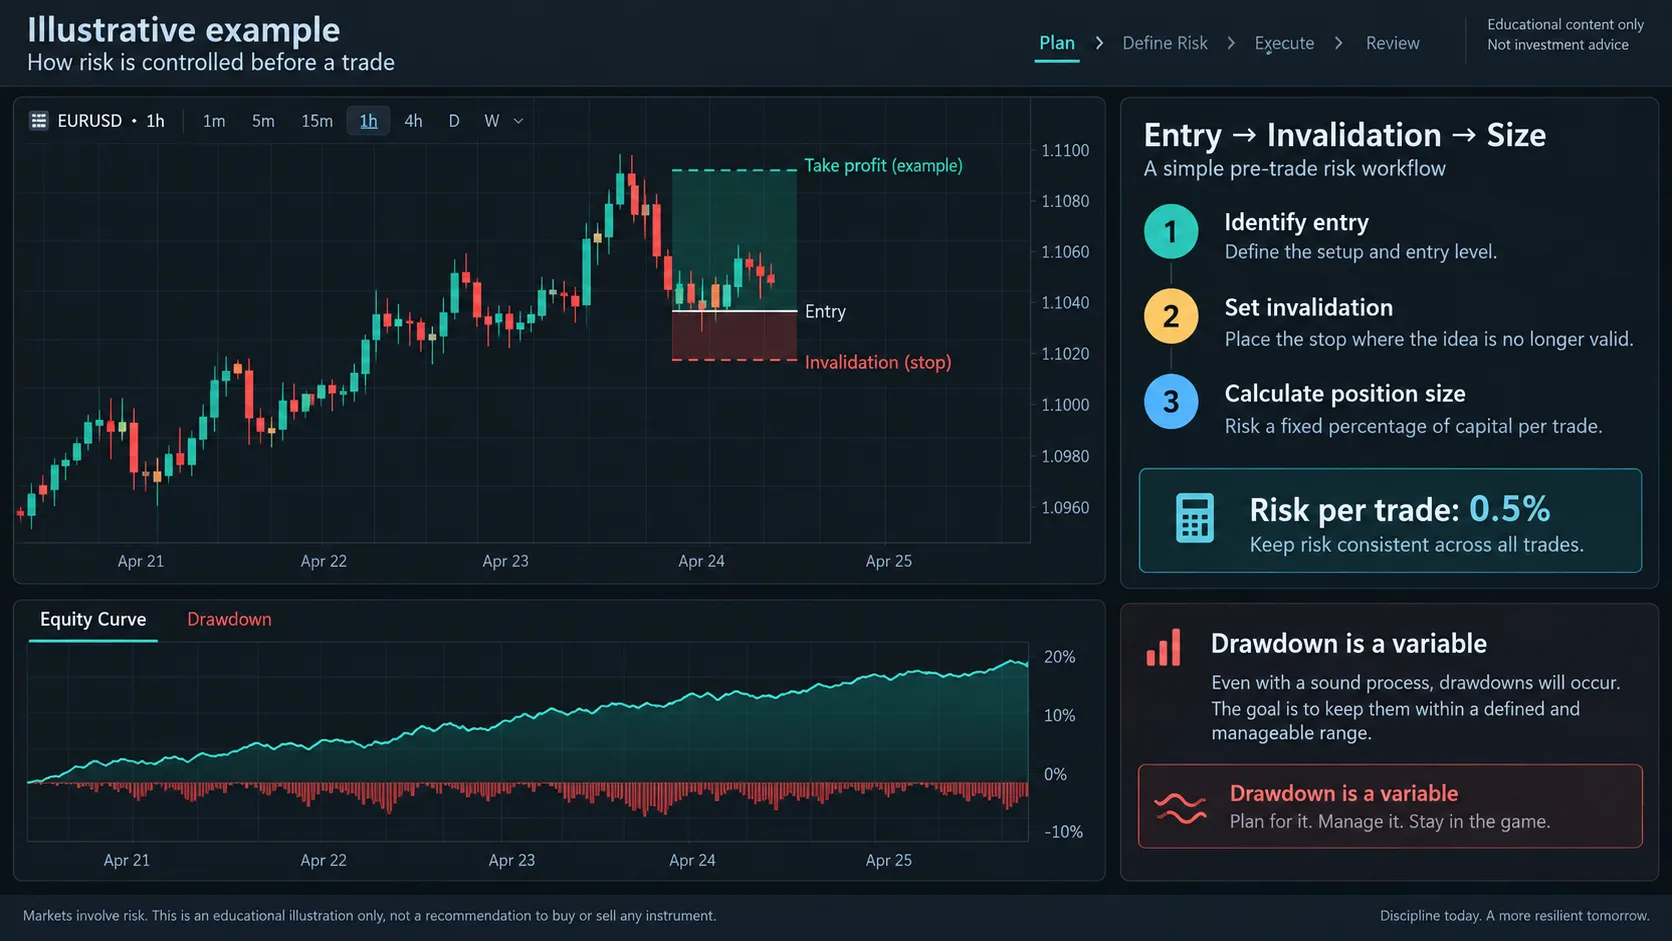
Risk Unit, Stop Distance and Position Size
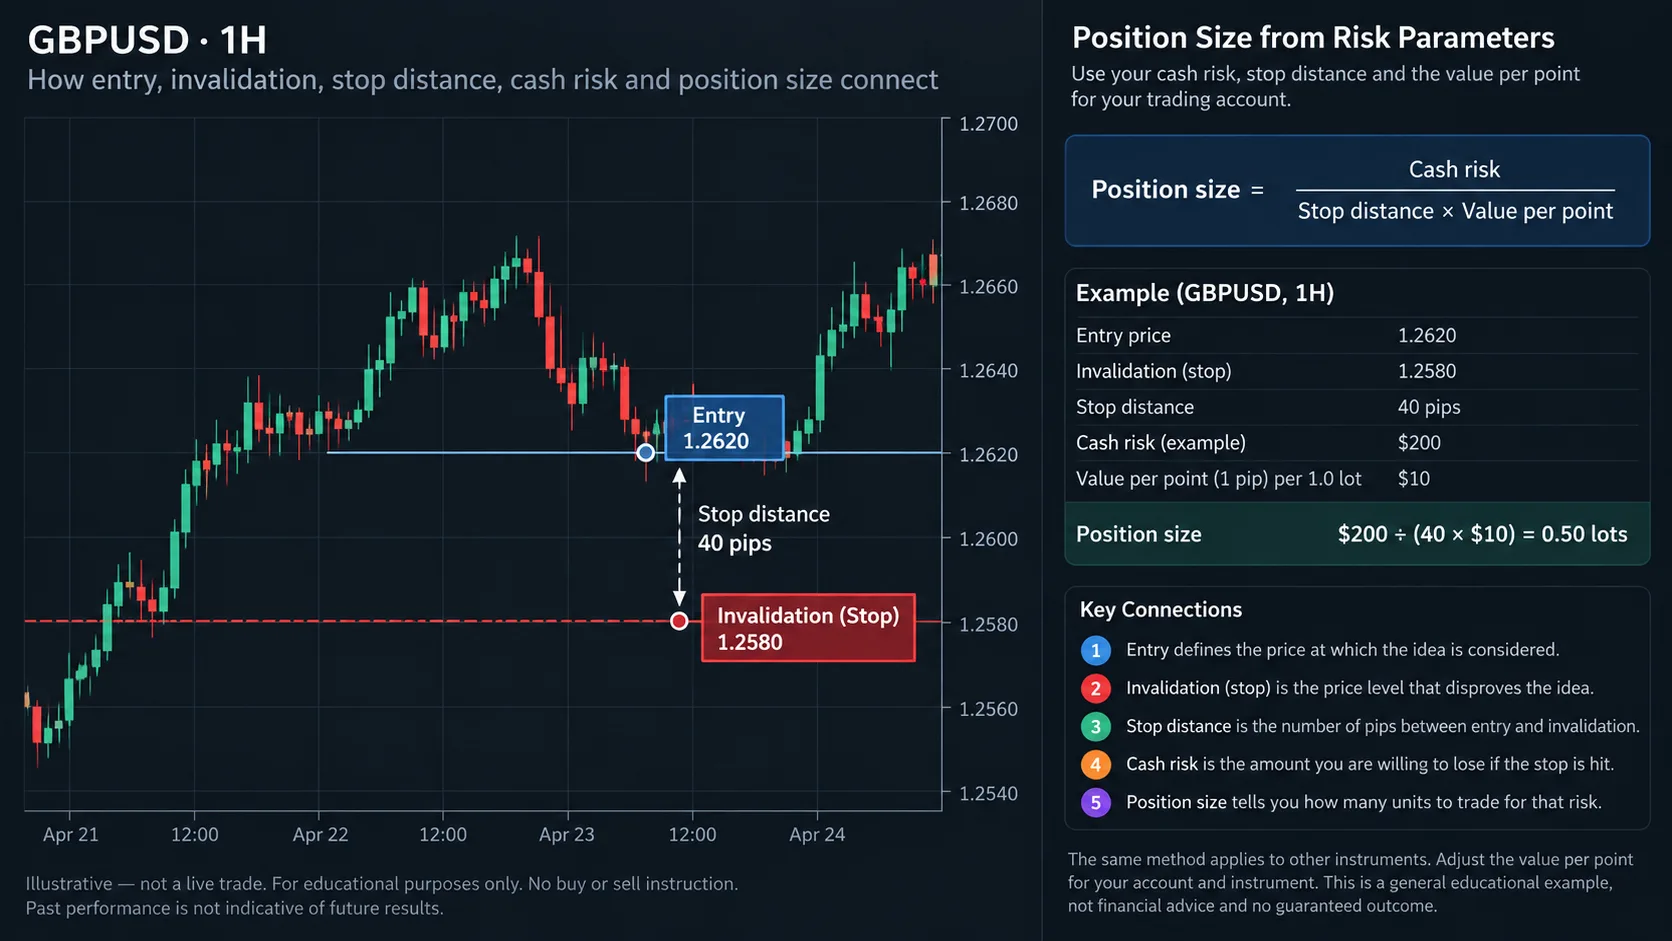
A general relationship is:
Position size = cash risk ÷ (stop distance × value per point)
Cash risk may be a fixed amount or a fraction of equity, but the choice must be documented. Stop distance should come from the thesis’s invalidation, not from a desired lot size. Value per point depends on contract specifications and account-currency conversion, so verify it with the provider. The same formula does not imply the same sensible risk across every market.
See risk–reward ratio explanation for a way to compare outcomes in units of predefined risk.
Define Invalidation Before Entry
Invalidation is the observable condition that makes the thesis no longer valid: for example, a close through a structural level or a change in the stated context. A stop order may still fill with slippage, a spread may widen, or a gap may skip the intended price. Moving a stop farther away without reducing size changes the risk that was approved.
Control Exposure Across Trades
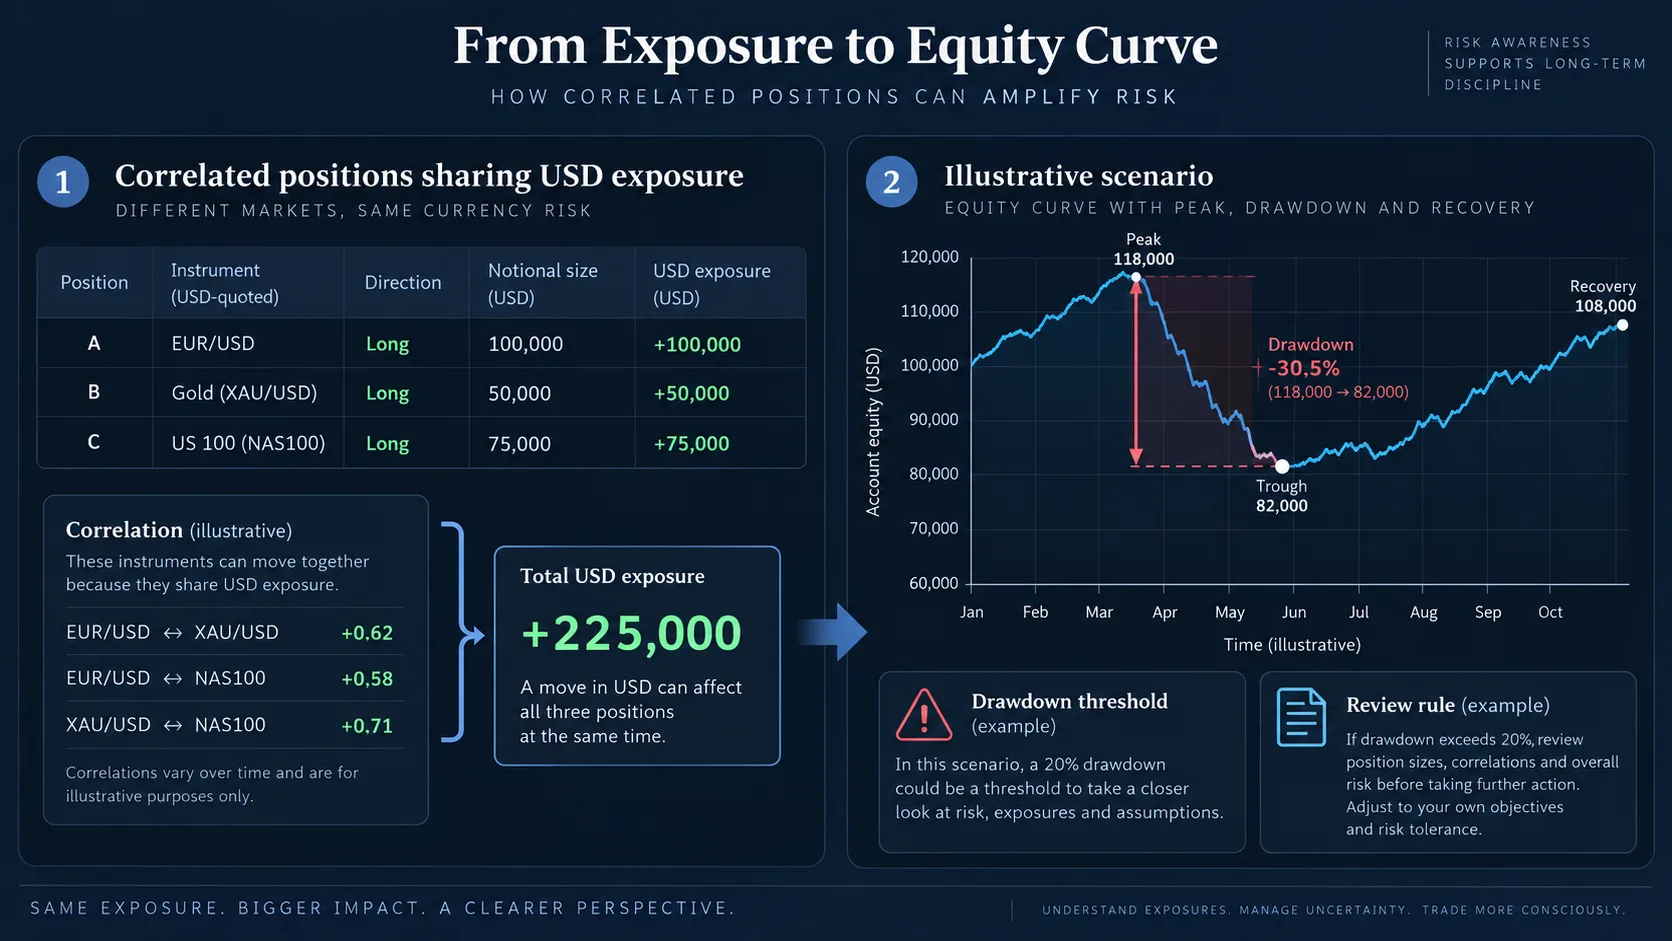
Portfolio risk is more than the sum shown on separate order tickets. Positions exposed to the same currency, session, macro release or liquidity condition can lose together. Track cash risk, margin use, direction, correlation assumptions and event timing. A portfolio limit should be tested against the account’s own history rather than copied as a universal rule.
Drawdown, Losing Streaks and Recovery
Drawdown is the decline from an equity peak to a later low. A losing streak can occur even when a sample has positive average expectancy. If a predefined drawdown threshold is reached, a plan might call for reducing size, pausing to review the journal or checking the data—not automatically increasing size to recover. Read the position-sizing formula to connect repeated risk with account exposure.
Execution and Cost Risk
- Spreads can widen when liquidity is thin or news is released.
- Slippage can move the fill away from the intended price.
- Commission, swap and financing reduce net results.
- Partial fills, requotes and outages can change exposure.
Record intended price, actual fill, spread, commission and slippage in a journal. A gross example that ignores costs is not evidence of a net advantage.
A Practical Pre-Trade Risk Workflow
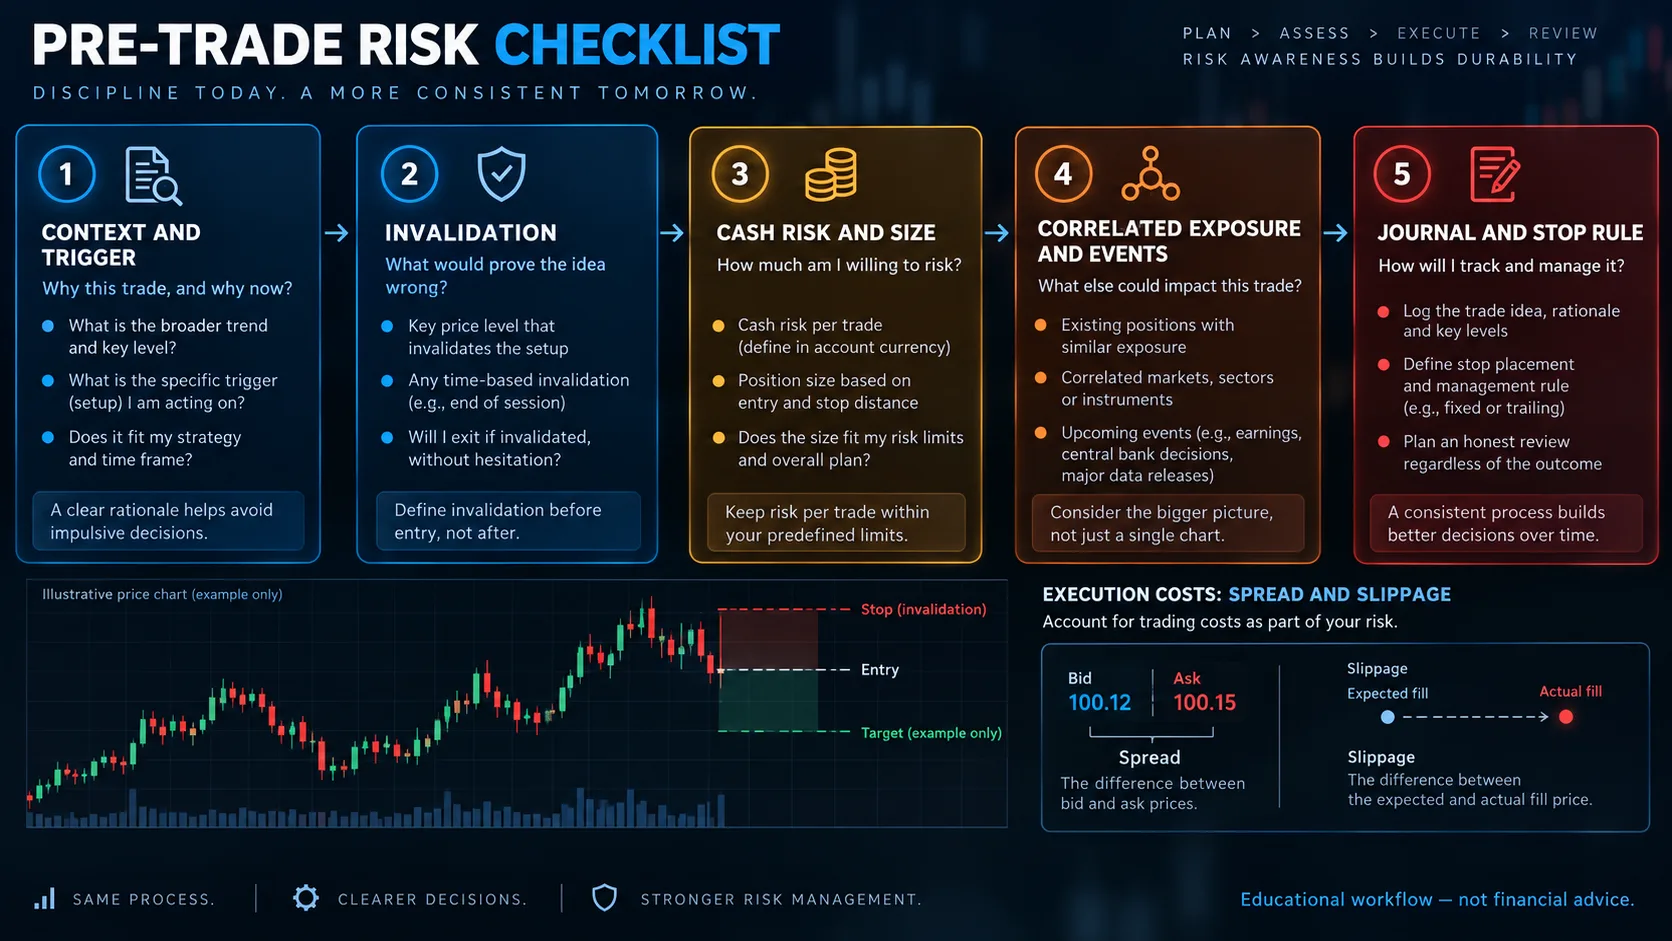
- Write the market context and trigger in one sentence.
- Record invalidation and stop distance before calculating size.
- Calculate cash risk and size using the instrument’s actual specification.
- Check correlated exposure, scheduled events, spread and margin conditions.
- Set a daily or weekly stop rule and a review criterion.
What Risk Management Cannot Do
Risk controls cannot guarantee profit, predict the next direction, eliminate gaps or turn a backtest into a live result. They make assumptions and limits explicit. Any risk fraction should be evaluated with sample size, costs, execution quality, drawdown tolerance and the possibility that the strategy’s edge changes.
Key Takeaways
- Define risk and invalidation before entry.
- Stop distance and position size are linked.
- Correlated positions can concentrate exposure.
- Drawdown and losing streaks need a prewritten response.
- No framework eliminates market risk.
References
- CME Group: Technical analysis education
- CFTC: Forex risk advisory
- BIS: Foreign-exchange risk resources
Risk warning: Trading can result in loss of capital. This is educational information, not a buy/sell recommendation; verify costs, execution conditions and an appropriate risk limit for your situation.