


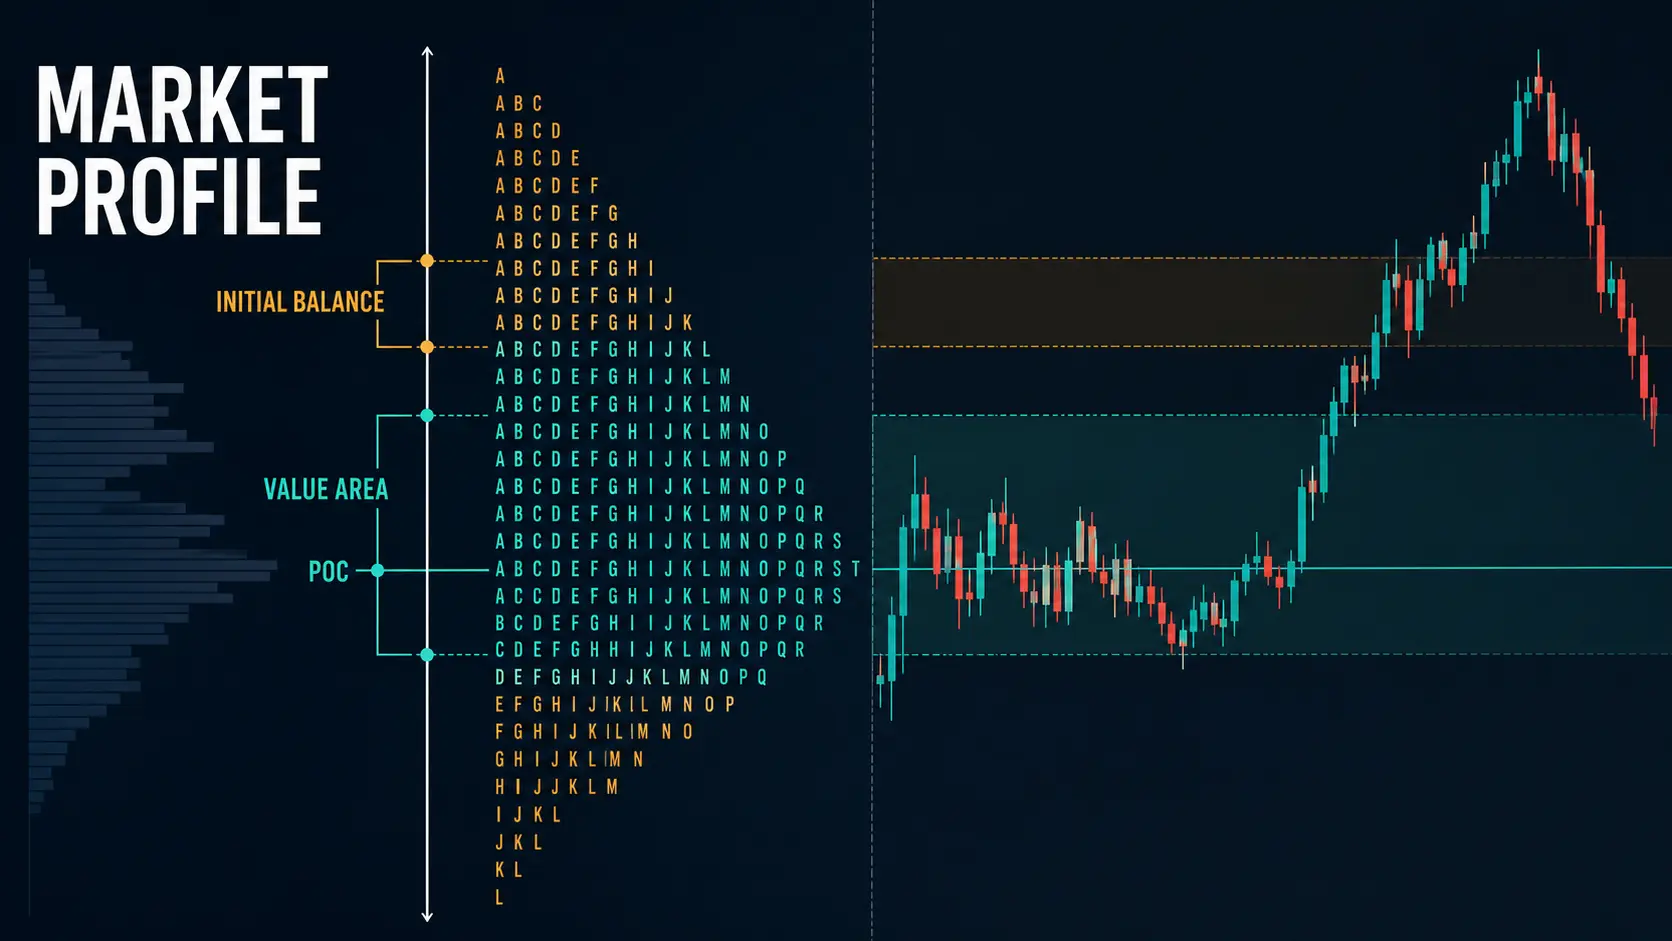
Market Profile is a way of organizing a trading session by the time price spends at each level, commonly displayed with TPO letters. It is used to describe auction context: where price was accepted, rejected, or still searching for value. Initial Balance, Value Area and Point of Control are references for analysis, not automatic entry or exit signals.
Key takeaways
- Market Profile focuses on time at price, not volume at price.
- A TPO profile groups price activity into time brackets, often 30 minutes by convention.
- Initial Balance is the opening range over a defined period; its duration is a setting, not a universal law.
- Value Area and POC summarize the profile structure but do not predict direction on their own.
- Market Profile is usually clearest on centralized, session-based markets with reliable session definitions.
What does Market Profile explain?
Market Profile presents a session as an auction. When price spends time around a level, the market may be accepting that area; when price moves quickly through an area and does not return, the market may be rejecting it or searching elsewhere. The profile does not reveal an institution’s intention. It gives a structured way to observe where the auction developed.
This article is a dedicated guide to the profile itself. For the broader toolkit, start with the site’s technical analysis frameworks guide.
TPO: time-price opportunity
TPO stands for Time-Price Opportunity. A platform assigns a letter, block, or other marker to each chosen time bracket. If a price level is visited during several brackets, the profile becomes wider at that level. The convention is useful, but settings matter: a different bracket length, session boundary, tick size or data source can change the appearance.
Initial Balance and the opening auction
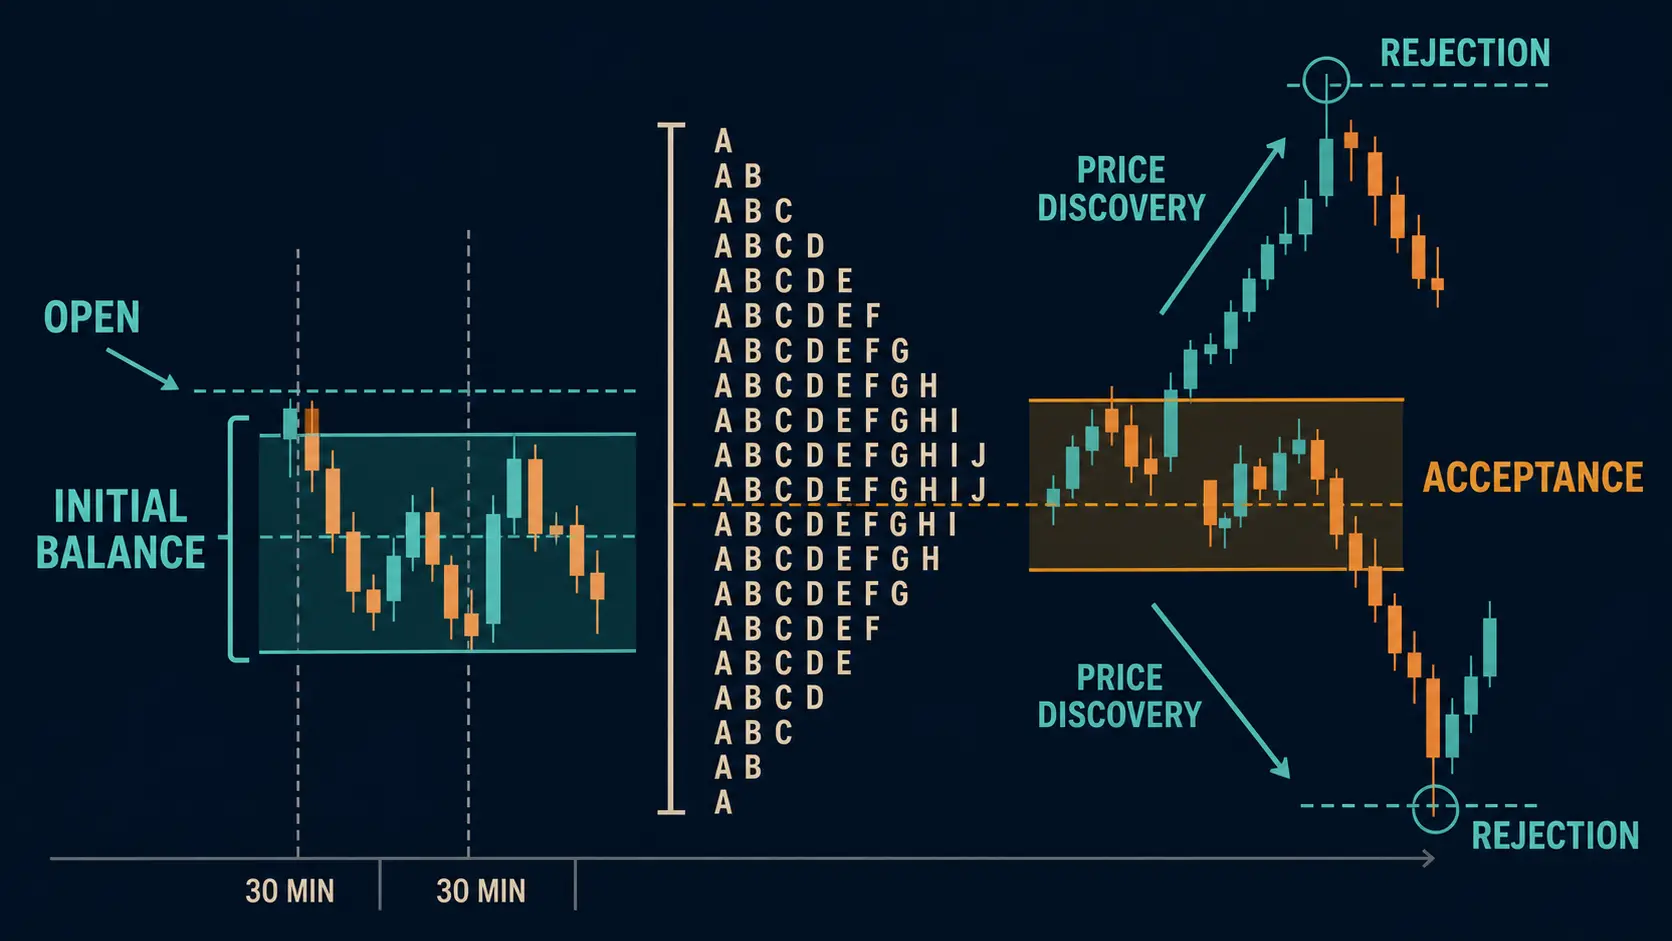
Initial Balance (IB) is the high-to-low range formed during the opening period selected by the analyst. On many futures-oriented setups it is the first hour, often made of two 30-minute brackets. It is best read as an opening context reference: did the market remain balanced, extend away from the range, or return and accept it again?
An IB breakout alone does not establish a trend. Check whether price can hold outside the range, whether the developing profile builds acceptance there, and whether the session has a scheduled event that can distort liquidity.
Value Area, VAH, VAL and POC
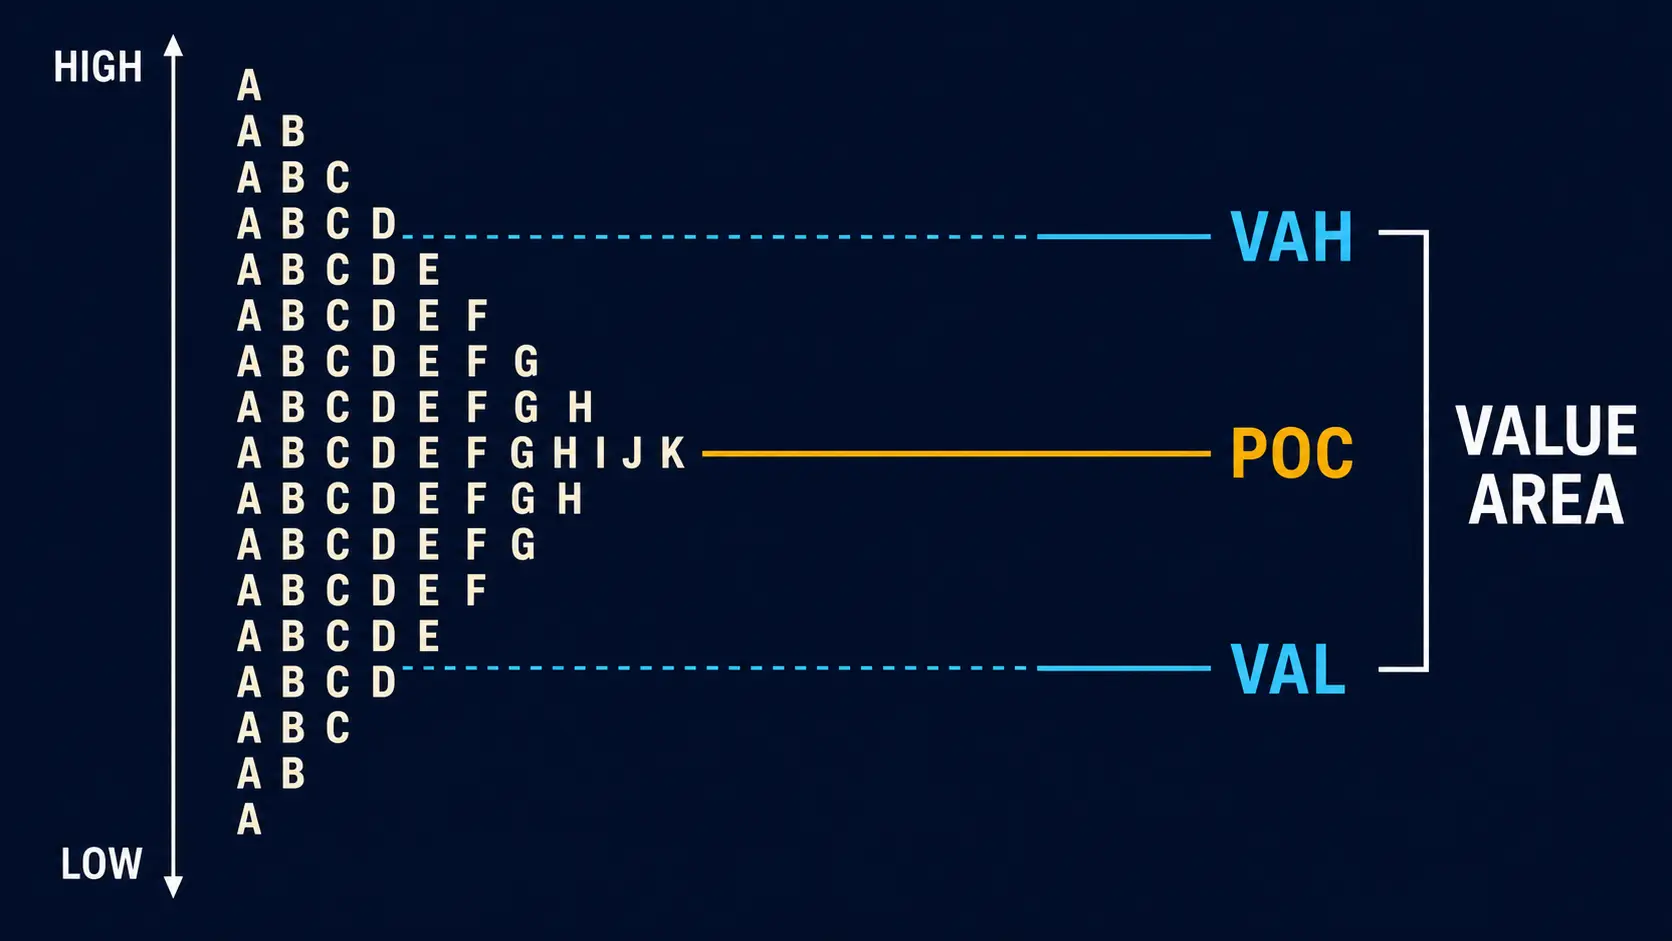
The Point of Control (POC) is typically the price level with the greatest TPO activity under the platform’s rules. The Value Area is commonly the range containing roughly 68–70% of the profile activity, and its boundaries are called Value Area High (VAH) and Value Area Low (VAL). These settings are conventions, not physical support or resistance.
| Reference | What it describes | What it does not prove |
|---|---|---|
| POC | A profile’s most active TPO level | That price must revisit it |
| VAH / VAL | Boundaries of the chosen Value Area | A guaranteed reversal zone |
| Initial Balance | The opening range for the selected duration | The session’s final direction |
Common Market Profile shapes
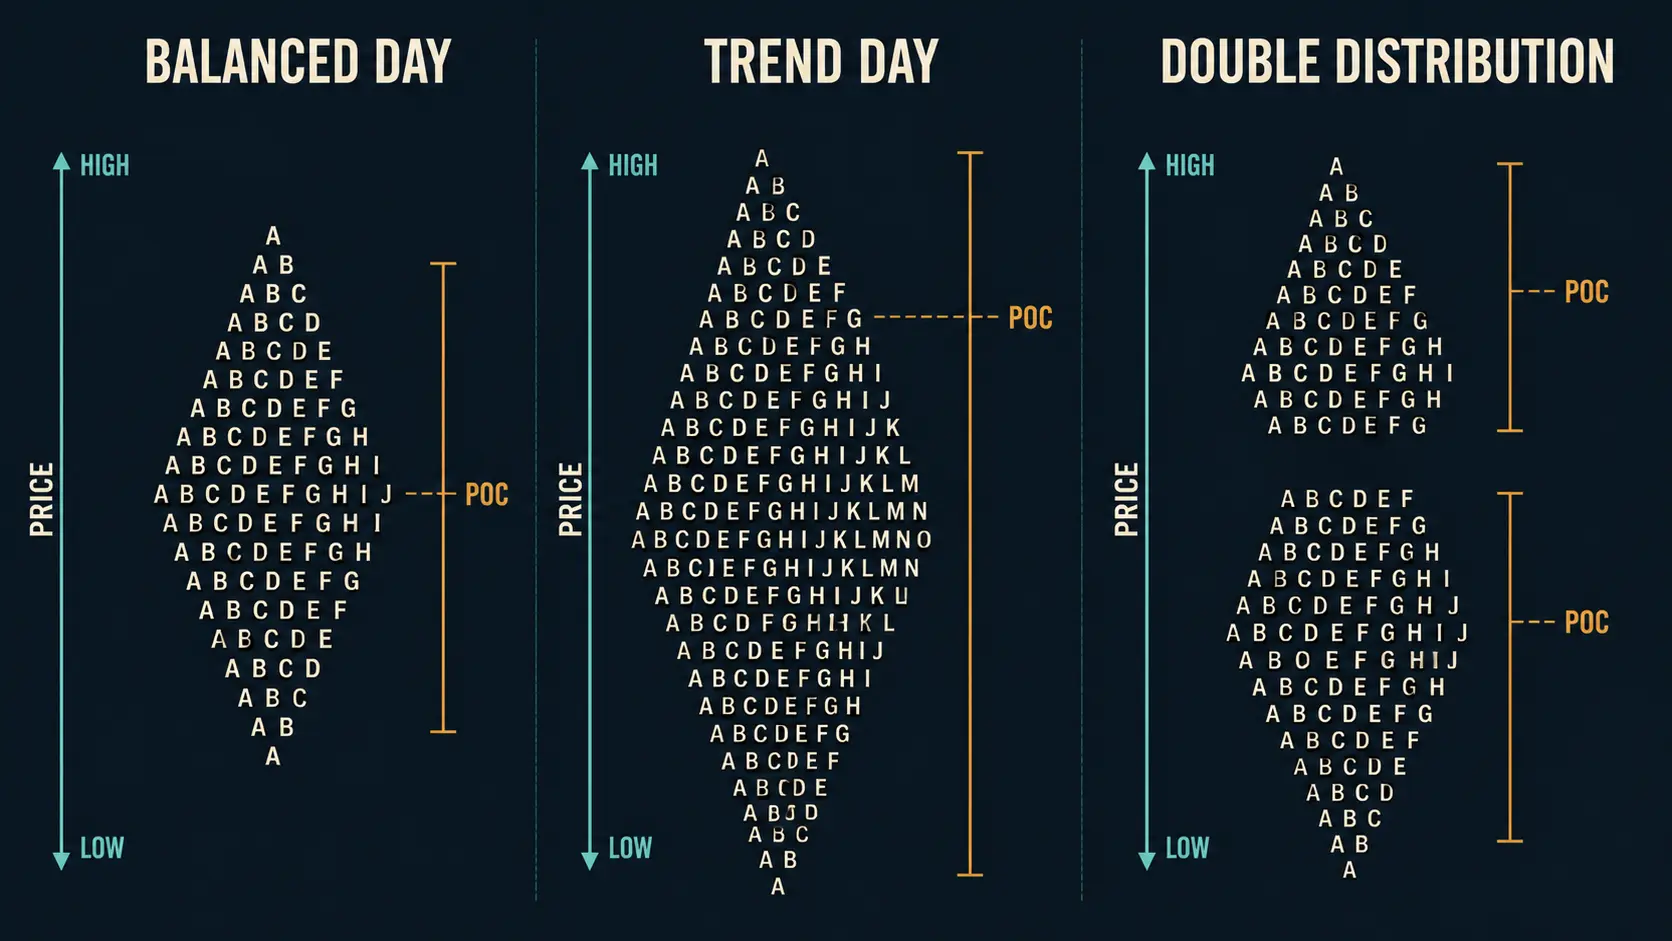
A balanced profile often has a broader middle, while a trend-like profile may elongate as the auction continues in one direction. A double-distribution profile can show two areas of activity separated by a thinner zone. Shape names are descriptions, not forecasts. They are useful only when paired with the session’s context, timeframe and a clear invalidation point.
A practical reading workflow
- Define the instrument, session hours, TPO bracket and tick grouping before interpretation.
- Mark the prior session’s major references and note whether the current open is inside or outside them.
- Observe Initial Balance without deciding the day’s direction prematurely.
- Ask whether price is building acceptance or quickly rejecting an area.
- Use ordinary price structure and a pre-defined risk limit before considering any trade idea.
Limits and common mistakes
- Treating every VAH, VAL or POC touch as a signal.
- Changing session settings until the profile supports a preferred narrative.
- Assuming a profile built from one feed represents every venue.
- Ignoring news, roll periods, low-liquidity hours and contract-specific conditions.
- Using complex profile terminology without a simple invalidation and risk plan.
FAQ
Is Market Profile the same as Volume Profile?
No. Market Profile primarily organizes time spent at price; Volume Profile organizes traded volume at price. The next article compares the two directly.
Can Market Profile be used on Forex?
It can be displayed, but spot FX is decentralized and session/data choices vary by broker or platform. Be explicit about what feed and session definition the profile represents.
Market Profile example: framing a session without forecasting it
Suppose a session opens inside the previous day’s Value Area. The useful observation is not that price has to rotate to the POC. Instead, note whether the opening auction remains balanced, whether price can hold an extension beyond the Initial Balance, and whether the developing profile starts building time at the new level. A quick push outside value followed by immediate return may describe rejection; sustained activity outside value may describe acceptance. Both are observations that require a defined response plan, not predictions.
Price structure should remain visible alongside the profile. A trader who uses support and resistance zones can compare the profile reference with the quality and location of the zone; the guide on volume and MSNR zones explains why reported activity is contextual rather than a confirmation rule by itself.
Settings that change the profile
Before saving a chart or backtesting an idea, record the session template, timezone, product/contract, TPO bracket length, tick grouping and whether the profile covers regular trading hours or an extended session. A 30-minute TPO profile for a US index future will not be directly comparable with a profile built from a broker-defined spot-FX day. Changing these settings after seeing the outcome creates a hindsight risk.
How Market Profile fits with liquidity and execution risk
Market Profile describes a distribution of time, not guaranteed executable liquidity. In thin hours or around major events, prices can jump through references and spreads can widen. The site’s liquidity guide is a useful companion for separating a chart reference from the practical ability to enter or exit at the assumed price.
Checklist before using a profile observation
- Can you state the instrument, feed, timezone and session template?
- Is the profile reference aligned with a meaningful price location rather than isolated?
- What observable behavior would support acceptance or rejection?
- What event, price level or condition would invalidate the hypothesis?
- Does the proposed risk remain acceptable if price moves through the reference quickly?
Sources and further reading
Risk disclosure: This article is educational information, not investment advice or a solicitation to trade. Order-flow tools, historical examples and chart patterns have limitations and do not guarantee future results. Trading can result in loss of capital. Assess your own risk tolerance and verify the quality and scope of the data before acting.