


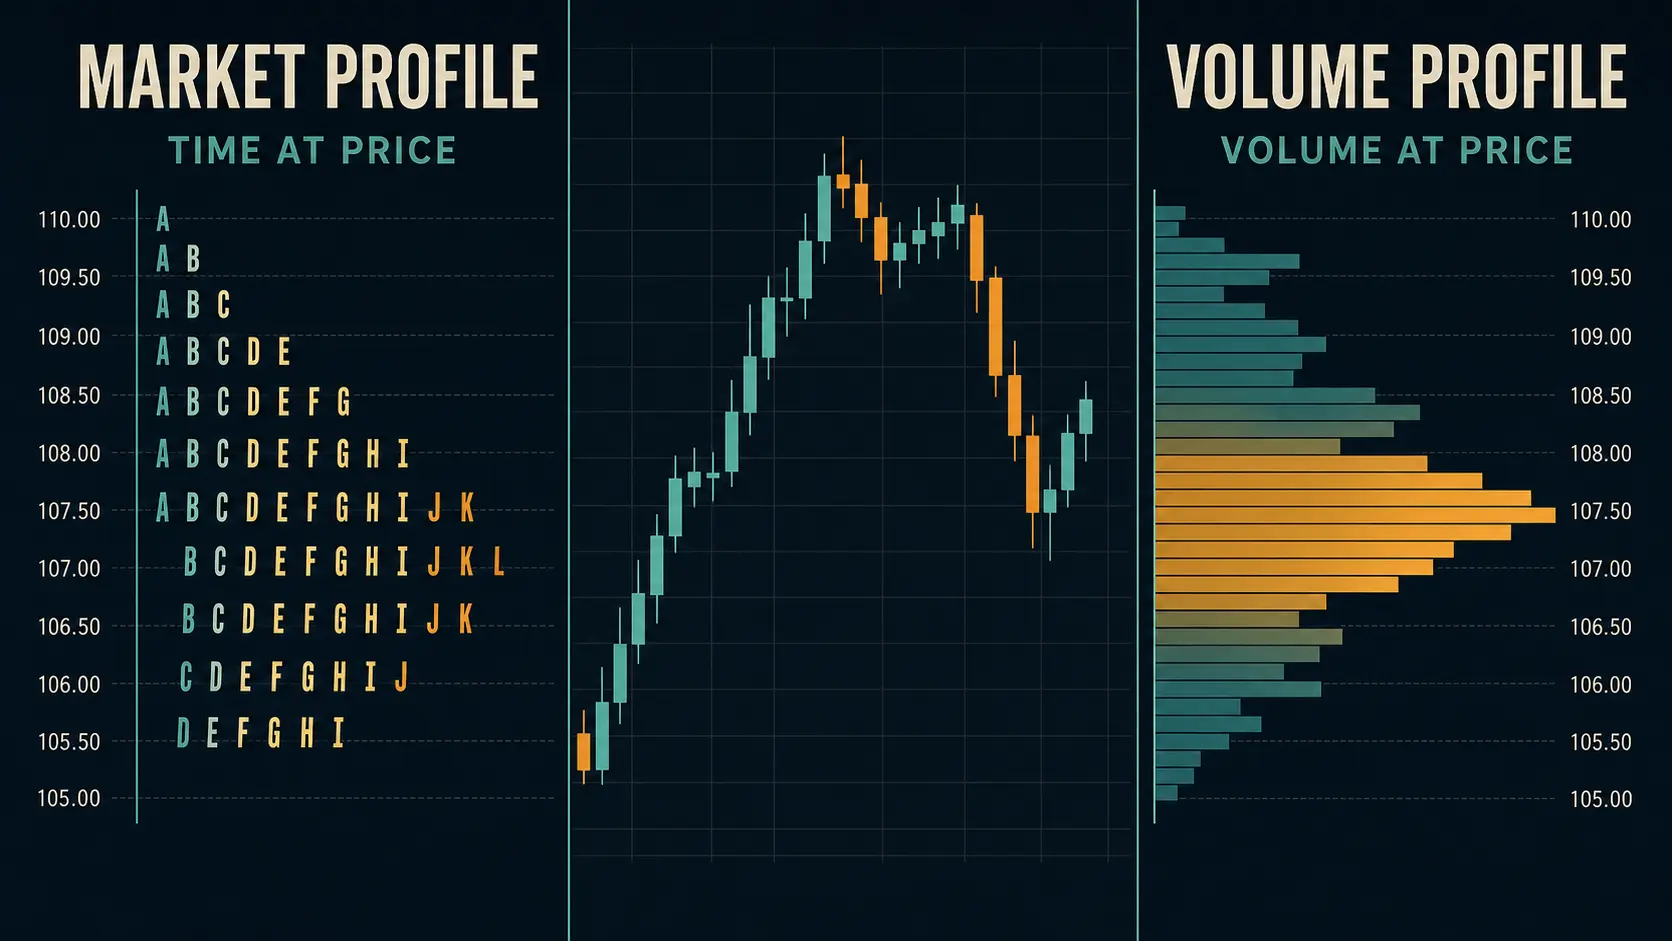
Market Profile and Volume Profile answer different questions: Market Profile organizes time spent at price, while Volume Profile organizes traded volume at price. Both can identify areas where activity concentrated, but their inputs, settings and interpretations are not interchangeable. A trader should first decide what question they are asking—auction duration or volume participation—before choosing a profile.
Key takeaways
- Market Profile uses TPO/time brackets; Volume Profile uses executed volume aggregated by price.
- Both can show a POC and Value Area, but those references are calculated from different inputs.
- Neither tool identifies future buyers, sellers or guaranteed support/resistance.
- Session boundaries, tick grouping and data feed can materially alter either profile.
- Use profiles as context alongside price structure, event risk and defined risk limits.
Market Profile: time at price
Market Profile represents the amount of selected time brackets in which price traded at a level. TPO letters or blocks form a distribution that helps describe auction structure, balance, extension and acceptance. Initial Balance, Value Area and TPOs are useful terms to define before interpreting the profile. For related foundations, use the site’s technical analysis guide.
Volume Profile: volume at price
Volume Profile aggregates executed volume at each price level over the chosen range. A wider bar represents more reported volume at that price. This can help identify where participation concentrated in the data source, but it cannot identify whether the activity came from an institution, why it traded, or what must happen next.
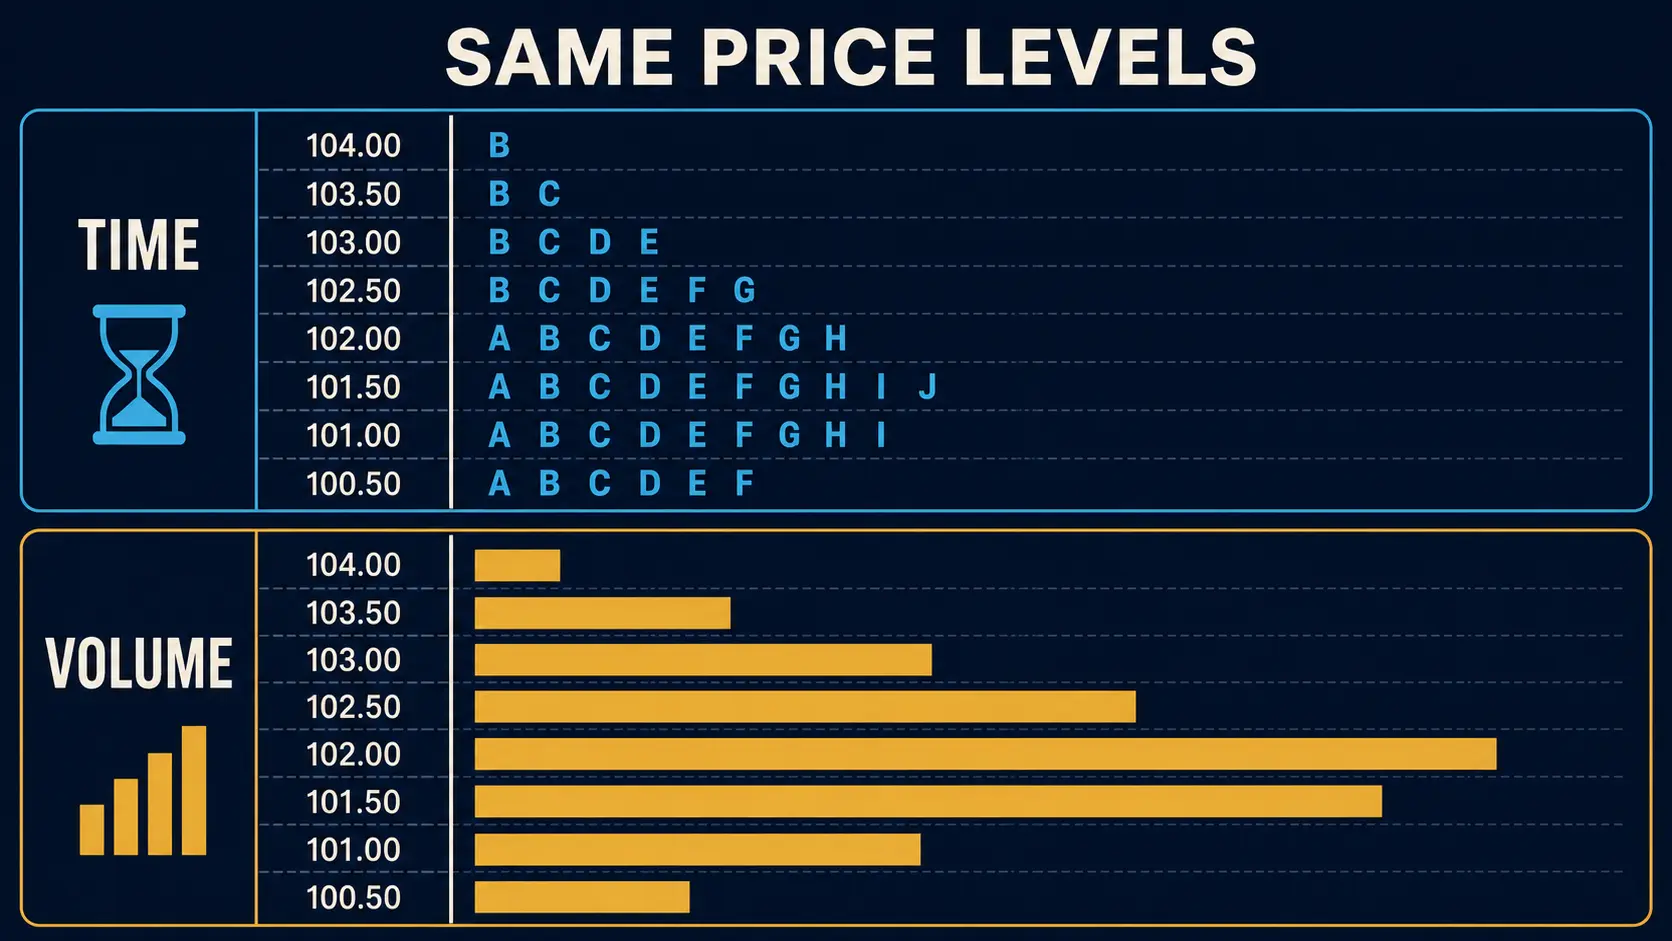
Same price levels, different observations
| Question | Market Profile | Volume Profile |
|---|---|---|
| Primary input | Time brackets / TPOs at price | Reported executed volume at price |
| Best suited to | Auction timing and session structure | Participation concentration by price |
| Typical output | TPO distribution, IB, time POC | Volume histogram, VPOC, high/low-volume areas |
| Main caveat | Depends on bracket and session choices | Depends on feed coverage and aggregation |
For example, a price can show long time acceptance with modest reported volume, or brief trading with substantial volume. That is not a contradiction: the tools measure different dimensions of the auction.
When a combined view can help
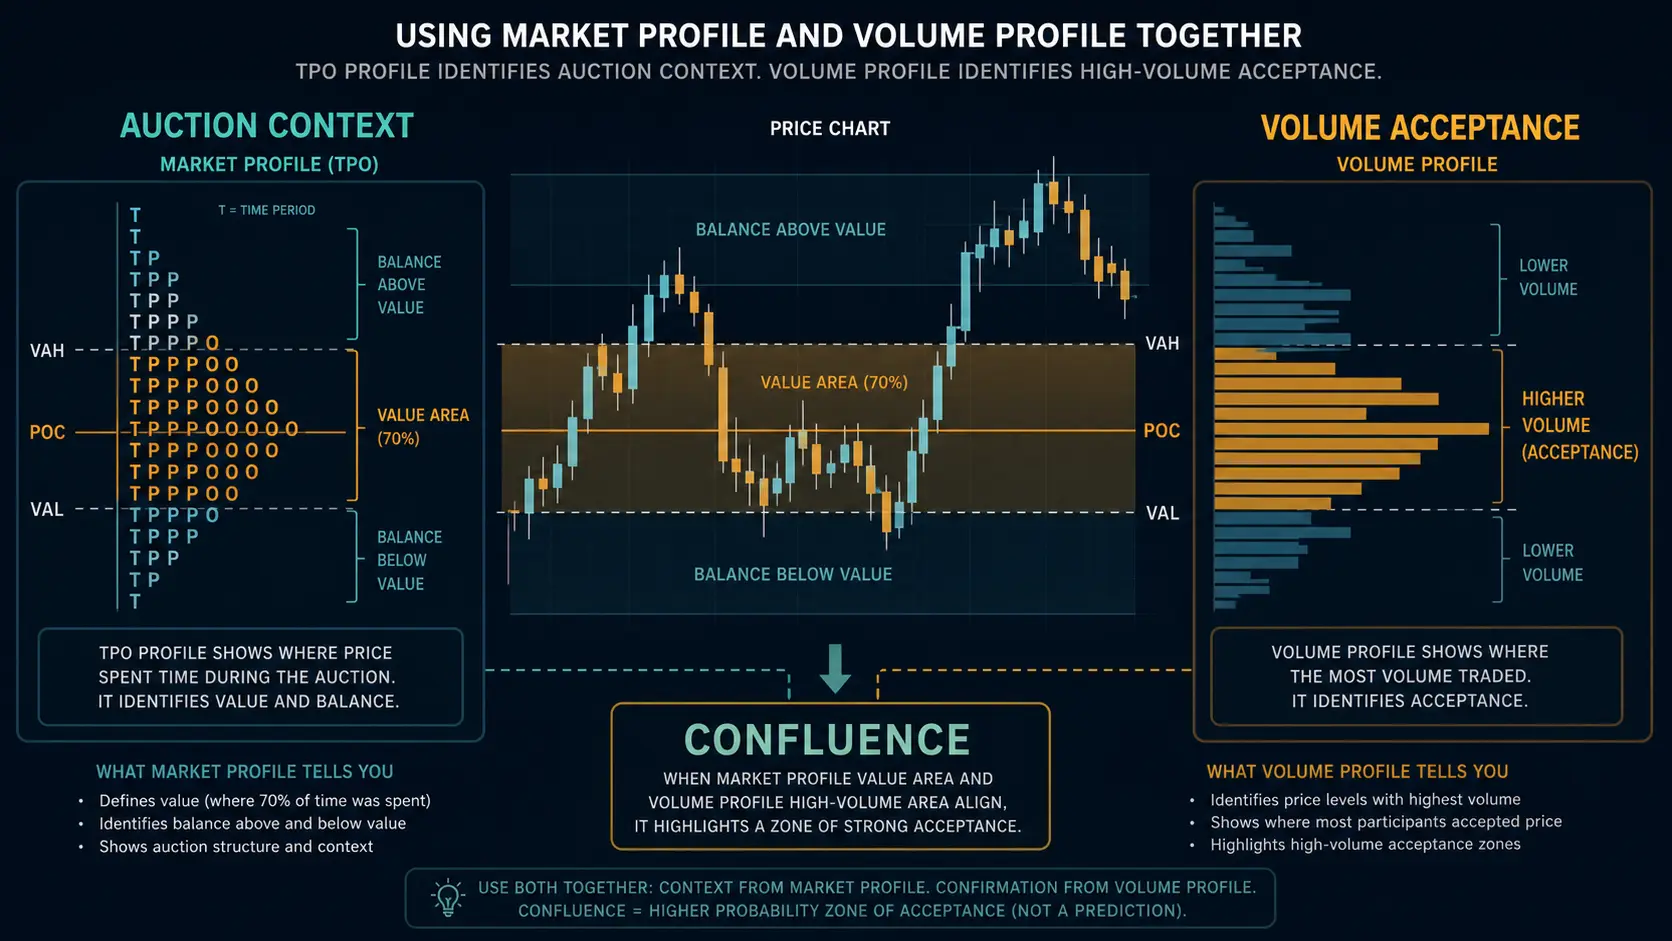
A combined view can make a chart-reading question more specific. Market Profile may describe whether a session is balancing or extending, while Volume Profile can show where the reported activity concentrated. The useful conclusion is often conditional: “If price returns here, will it be accepted or rejected?” It is not “two profiles agree, so a trade must work.”
Choose the profile from the question
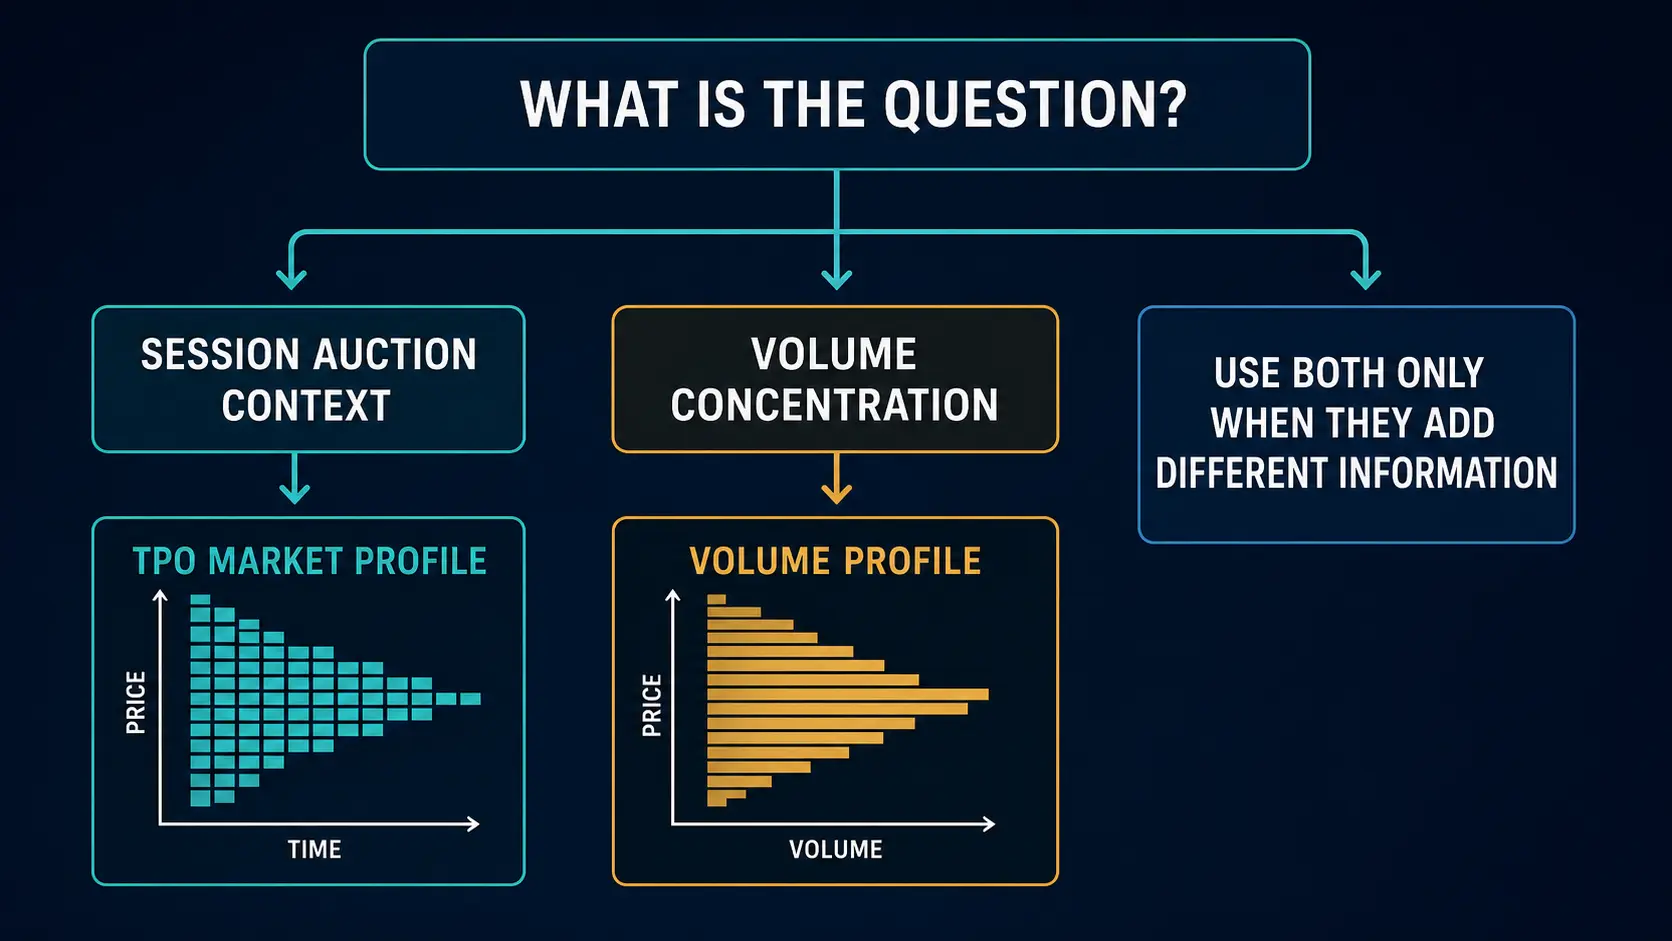
Use Market Profile when the question is about session development and time-based acceptance. Use Volume Profile when the question is about reported volume concentration. Use both only when the two views add distinct information and the feed, session boundaries and chosen range are documented.
Data limitations matter
Centralized exchange-traded futures provide a more defined view of exchange volume than decentralized spot FX. In OTC spot FX, a platform may show tick volume or liquidity from its own network rather than a consolidated global volume figure. Do not compare profiles from unrelated feeds as if they are identical.
Common mistakes
- Calling a time POC and a volume POC the same thing without stating the calculation.
- Using a profile from a different session or contract than the chart being traded.
- Reading high activity as bullish or bearish without price response.
- Adding both profiles only to create more indicators rather than answer a clear question.
- Ignoring costs, liquidity and an invalidation point.
FAQ
Which is better: Market Profile or Volume Profile?
Neither is universally better. Market Profile is useful for time-based auction context; Volume Profile is useful for reported volume-at-price. The appropriate choice depends on data quality and the analytical question.
Do both use Value Area?
Many platforms calculate a Value Area for both, but it reflects different underlying activity. Check the platform documentation before comparing levels.
Worked conceptual example: the profiles can disagree without either being wrong
Imagine price spends a long period near the middle of a session range, creating a wide TPO area, but most of the reported volume printed during a short event-driven burst near the range edge. Market Profile would emphasize time-based acceptance in the middle; Volume Profile would emphasize volume concentration near the edge. The difference tells you to ask a sharper question about the auction. It does not tell you which line will win.
Similarly, a high-volume node can form quickly while a TPO profile remains thin at that level. This can reflect a burst of reported participation rather than prolonged time acceptance. The analytical value comes from documenting the difference and observing subsequent price response, not from forcing both profiles into one signal.
Range selection is part of the calculation
Volume Profile can be calculated for a session, a swing, a fixed range or a composite period. Market Profile also depends on a session and time bracket. Changing the range until a level aligns with a desired trade idea is a form of hindsight selection. Set the range rule before reviewing results, then use the same rule across examples.
Link profiles to ordinary chart context
Profile tools should not replace the basics of market structure, trend and invalidation. If the chart has no clear location or the session is dominated by an event, the correct decision may be to wait. The article on lower highs and lower lows can help keep the price-structure layer separate from profile terminology.
A simple decision checklist
- Write the question: session auction context, or reported volume concentration?
- Choose the profile and range before interpreting the outcome.
- Record the feed and session boundaries.
- Compare the profile reference with price response and relevant liquidity conditions.
- Only use a combined view if each tool contributes a distinct observation.
For a practical example of treating volume as one input among several, see Should volume confirm MSNR zones?.
Sources and further reading
- Quantower — TPO/Market Profile settings
- VolSys — Volume by Price documentation
- CFTC — retail FX market information
Risk disclosure: This article is educational information, not investment advice or a solicitation to trade. Order-flow tools, historical examples and chart patterns have limitations and do not guarantee future results. Trading can result in loss of capital. Assess your own risk tolerance and verify the quality and scope of the data before acting.