


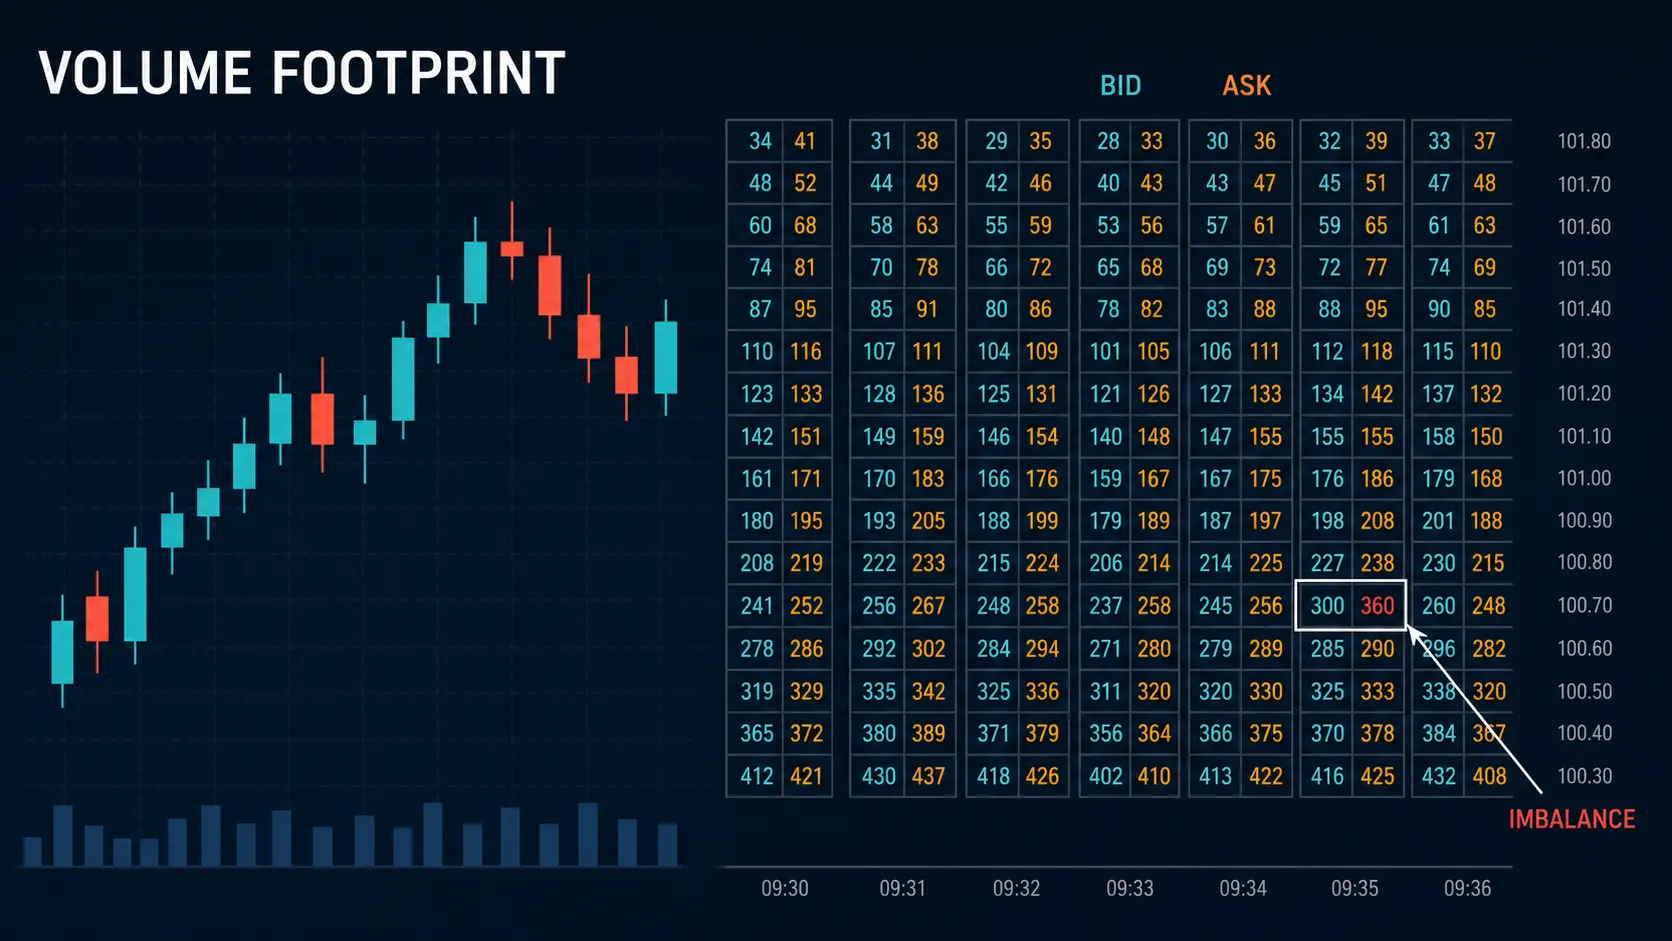
A Volume Footprint Chart displays executed volume at each price level inside a bar, usually separating trades classified at the bid from trades classified at the ask. It can reveal the distribution of reported order-flow activity, including delta and imbalance. It does not reveal hidden intent, guarantee direction, or replace data-quality checks and risk control.
Key takeaways
- Footprint charts organize reported bid/ask executed volume by price level inside each bar.
- Delta is commonly ask volume minus bid volume, but platforms can define labels and classification differently.
- An imbalance is a threshold-based comparison, not a universal signal.
- Centralized futures data and decentralized spot-FX data have different coverage and limitations.
- Read order flow with location, price response, liquidity and a defined invalidation—not in isolation.
What is a Volume Footprint Chart?
A footprint chart is an order-flow display. Instead of showing only an OHLC candle, it breaks the bar into price levels and shows reported activity at each level. Typical modes include bid/ask split, total volume, delta and imbalance. This makes the chart information-dense, so the first task is to know exactly what your platform’s feed and labels mean.
For broader technical context, see the technical analysis frameworks guide. A footprint is an observation tool, not a complete trading method.
Bid, ask and delta
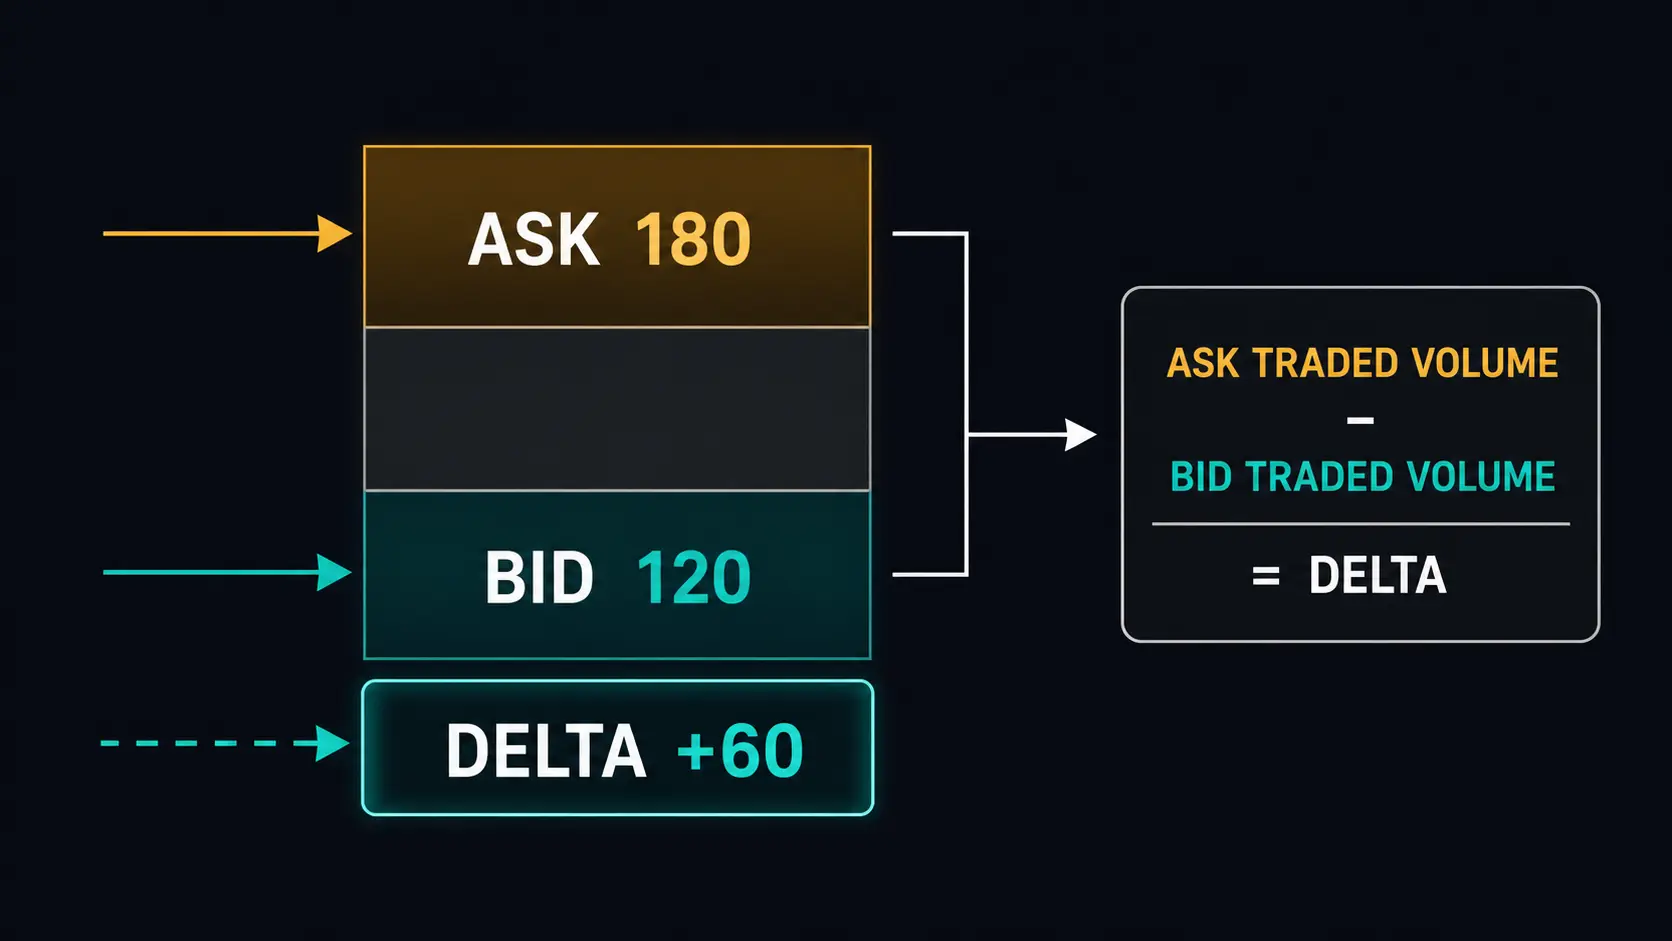
In a common convention, trades executed at the ask are treated as buyer-initiated/aggressive buying and trades at the bid as seller-initiated/aggressive selling. Delta is then calculated as ask volume − bid volume. A positive delta means more volume was classified at the ask than the bid in that unit; it does not prove that price must rise.
Platform terminology can be confusing. Some displays use color names or labels differently, and classification methods can vary. Always read the vendor documentation and test the calculation against a known example before treating delta as meaningful.
Imbalance, stacked imbalance and absorption
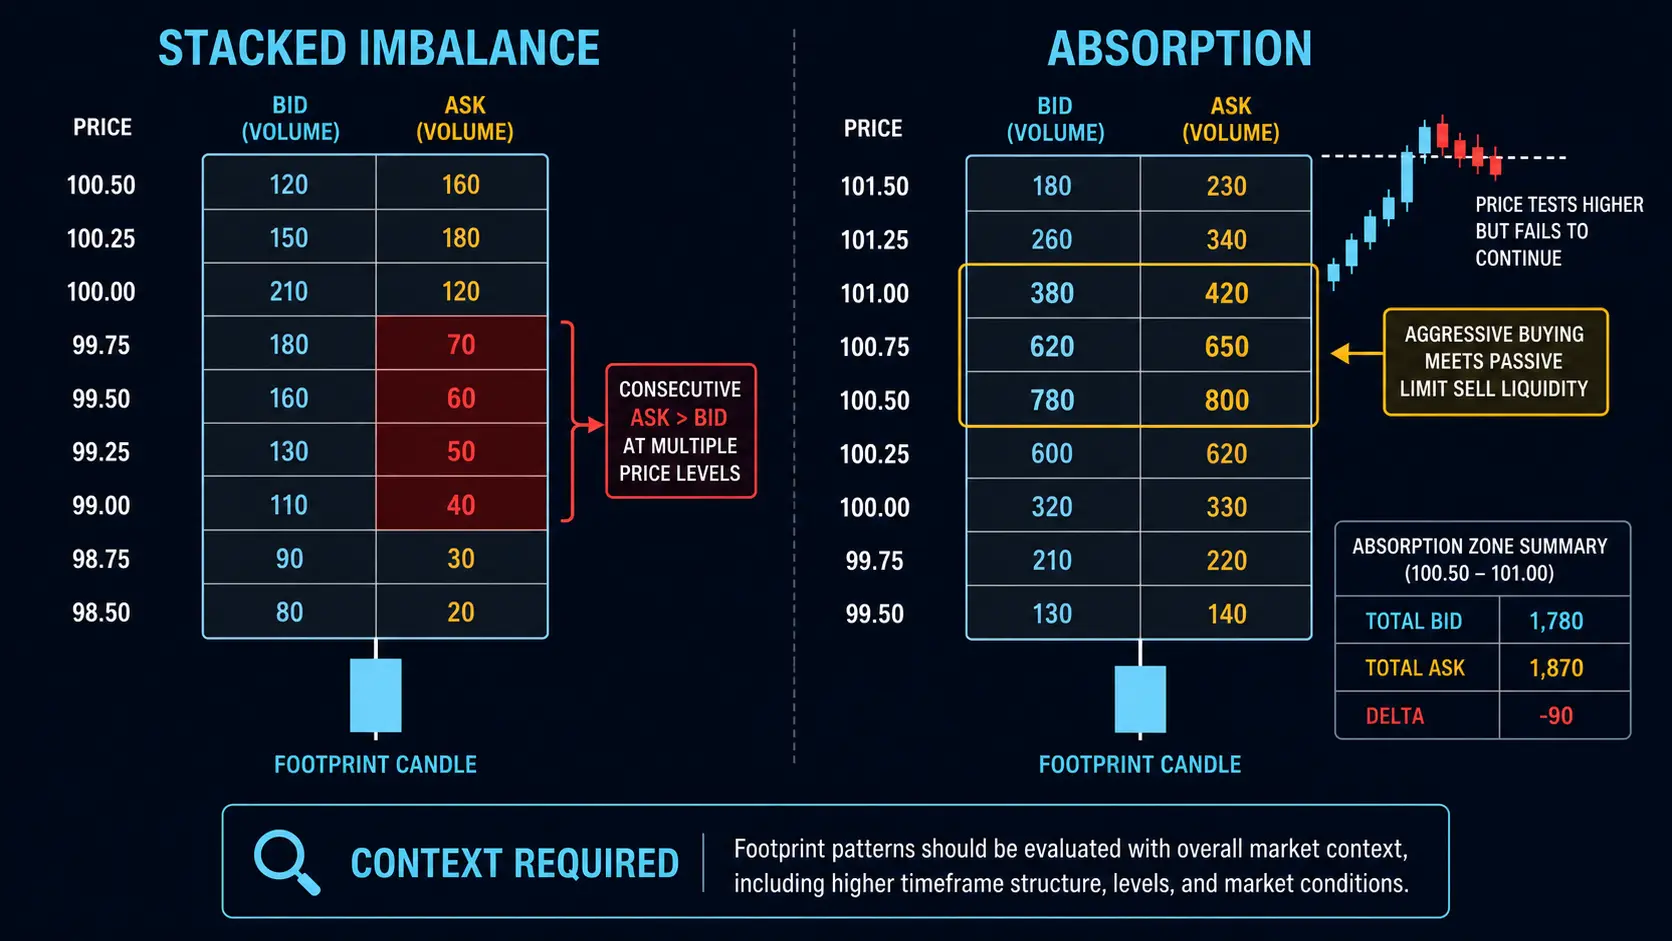
An imbalance compares reported bid and ask volume at a level or diagonal pair against a threshold. A stacked imbalance is several adjacent levels meeting that rule. Absorption is a descriptive hypothesis: aggressive flow appears, but price does not continue because resting liquidity may be absorbing it. The word “may” matters; the same pattern can occur before continuation, reversal or noisy consolidation.
A safe reading process
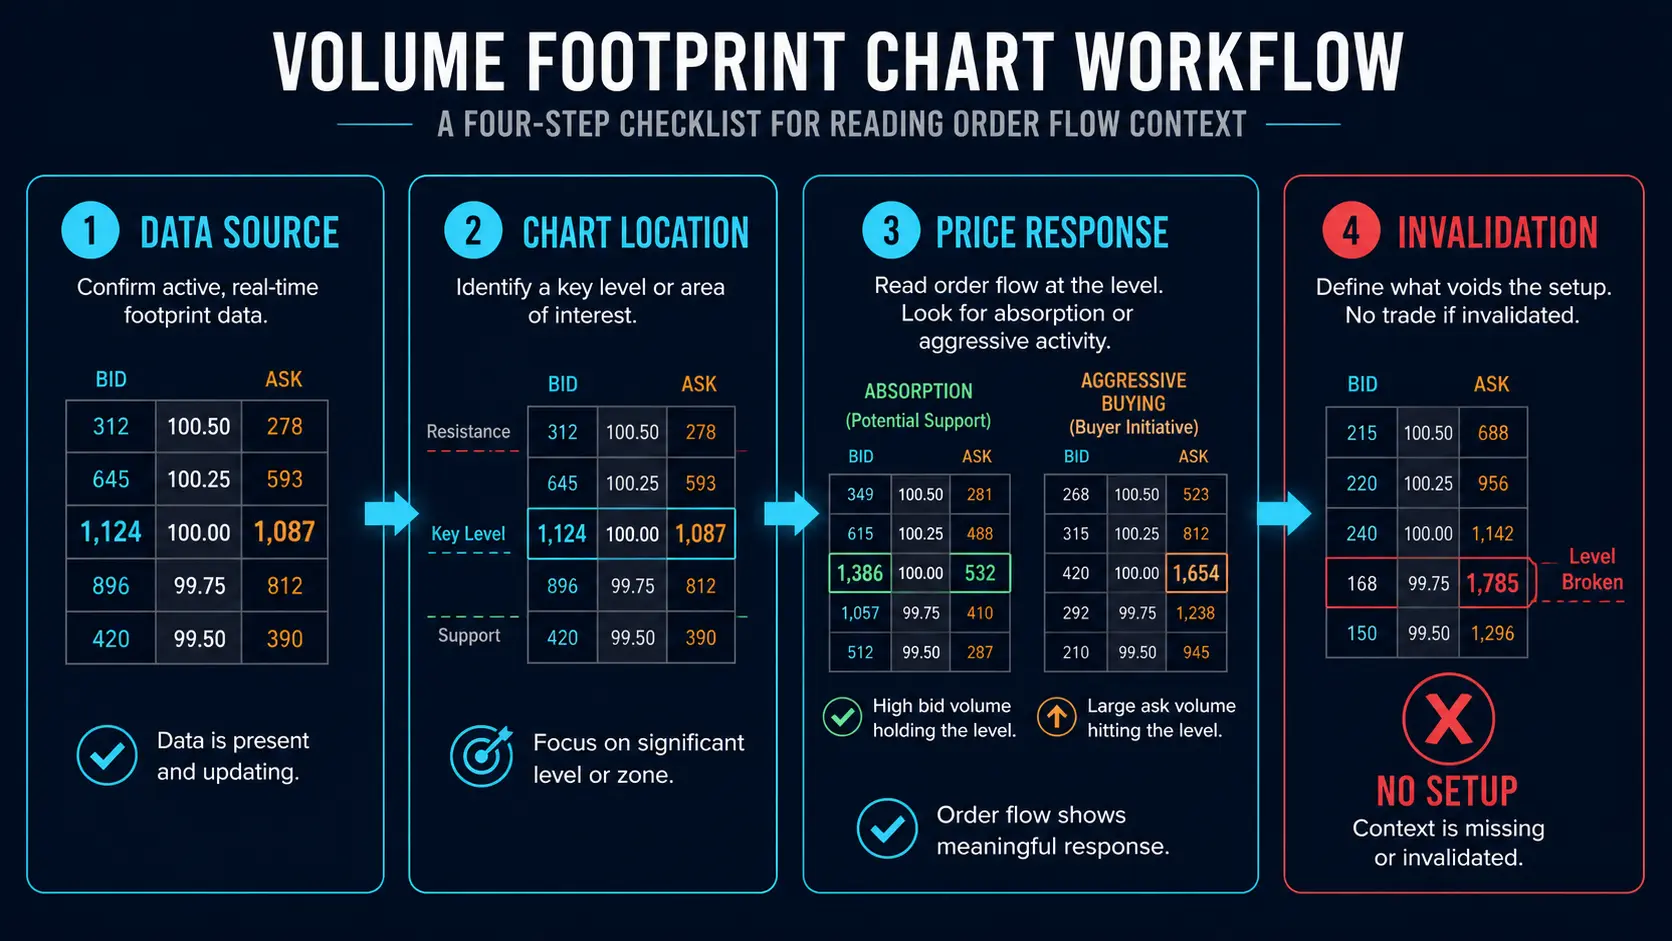
- Confirm the instrument, contract, session and source of bid/ask data.
- Mark the higher-timeframe structure and a relevant location before zooming into footprint cells.
- Observe whether price accepts, rejects or fails to progress after the reported activity.
- Define what would invalidate the scenario, including practical spread and slippage conditions.
- Log both confirmation and failure examples before deciding whether the tool adds value.
Data limitations and market choice
Footprint analysis is most straightforward where a centralized venue reports trade data, such as exchange-traded futures. Spot FX is decentralized: a retail platform’s feed can represent its own liquidity network or tick activity rather than the full global market. A futures footprint can be a proxy for related FX activity, but it is not identical to a retail spot quote.
Common mistakes
- Assuming a positive delta is a Buy signal or negative delta is a Sell signal.
- Using an imbalance threshold copied from another instrument without testing.
- Ignoring data gaps, contract rolls, thin hours and feed changes.
- Reading every highlighted cell without a larger market location.
- Confusing aggressive executed volume with all resting liquidity in the order book.
FAQ
Can a footprint chart predict reversals?
No. It can describe reported execution at price. A reversal hypothesis still requires price behavior, context and an invalidation point, and can fail.
Does footprint data work for spot Forex?
It can be displayed by some services, but coverage differs by broker/feed. Treat it as feed-specific, not as a consolidated view of global spot FX.
Why price response matters more than a highlighted cell
A footprint can show a large positive delta at a high, but price may continue upward, stall, or reverse. The data point only describes reported execution under a particular classification method. The follow-up question is whether price can accept the area, whether a level is reclaimed or lost, and whether the expected liquidity is actually available when an order needs to be executed.
For example, a stacked imbalance at a level that is immediately accepted can support a continuation hypothesis, while the same pattern at an extended move into a higher-timeframe resistance area may warrant caution. The chart context still comes first. The article on liquidity sweeps gives a separate framework for evaluating a sweep, confirmation and failure without treating the label as fact.
Build a review dataset before trusting a threshold
Different instruments have different tick sizes, average daily volume, session behavior and order-flow distributions. An imbalance threshold that appears meaningful on one contract may be noise on another. Create a sample with fixed rules: same data feed, same session, same threshold and a documented definition of the outcome. Include examples that fail, not only the visually compelling examples.
Execution assumptions belong in the review
Many order-flow examples look precise because the chart is precise. Real execution can still differ because of spread, commissions, latency, partial fills and slippage. Any review should state whether it assumes market or limit execution and whether the assumed price was realistically available. This is especially important in fast markets and around scheduled releases.
Footprint chart checklist
- Verify the feed, contract and bid/ask classification logic.
- Mark structure and location before inspecting cells.
- Use imbalance or delta as evidence to test, not as a standalone command.
- Record acceptance, rejection and failed follow-through.
- Define invalidation and execution risk before any order is considered.
The MSNR and volume guide is also useful for separating a zone from the evidence used to evaluate it.
Sources and further reading
- VolSys — Footprint / Deep Print documentation
- VolSys — Order Flow Analyzer documentation
- CFTC — Eight Things You Should Know Before Trading Forex
Risk disclosure: This article is educational information, not investment advice or a solicitation to trade. Order-flow tools, historical examples and chart patterns have limitations and do not guarantee future results. Trading can result in loss of capital. Assess your own risk tolerance and verify the quality and scope of the data before acting.