


Crypto funding rate is a periodic transfer between long and short holders of a perpetual contract that helps the contract price stay near its reference price. A positive rate commonly means longs pay shorts; a negative rate commonly means shorts pay longs under that venue’s rules. It is a time-dependent cost or transfer, not an independent buy or sell signal.
What Is a Crypto Funding Rate and Why Does It Exist?
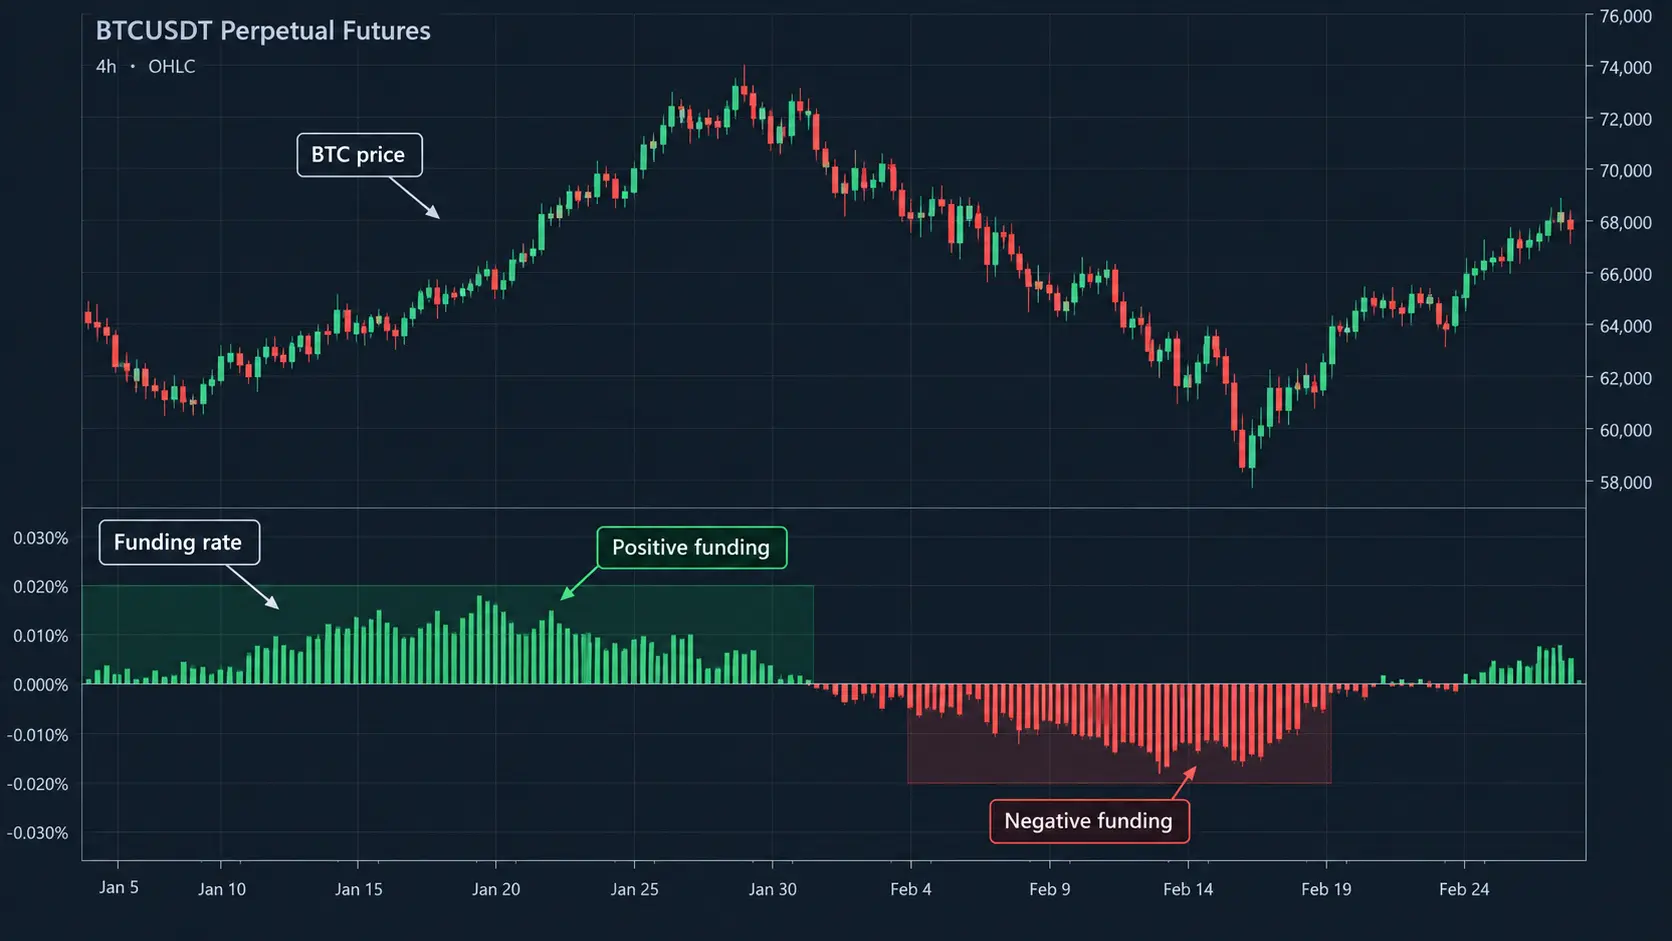
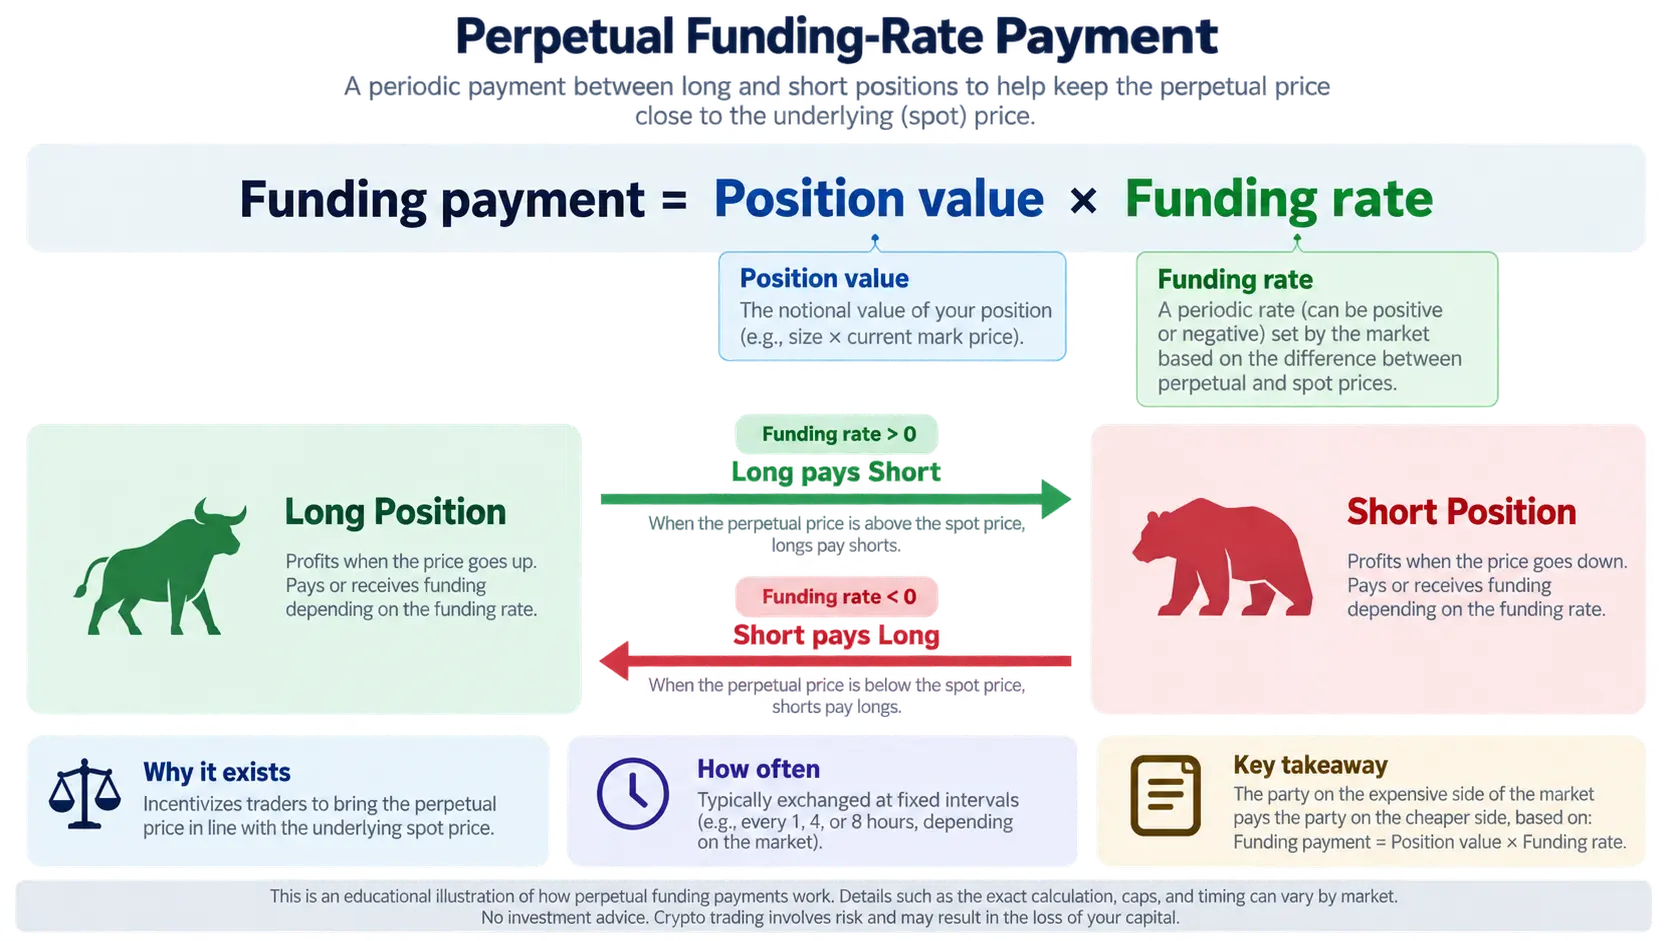
A perpetual contract has no fixed expiry date. Its venue uses funding to create an economic incentive for the contract price to remain close to a reference index. When funding is positive, longs commonly pay shorts; when it is negative, the direction can reverse. The interval, formula, mark price and settlement rules vary by venue, so read the contract specification before estimating cost.
A general formula
Funding payment = Position value × Funding rate. Position value is usually based on notional size rather than margin, while rounding and the reference price are venue-specific. This simplified formula describes a payment; it does not forecast price or replace the actual fee schedule.
Put funding beside market structure and liquidity context. Thin conditions can make spread and execution costs larger than a funding estimate, especially during volatility.
Reading Funding With Price and Open Interest
| Observation | Could suggest | Does not prove |
|---|---|---|
| Positive funding rises | More long demand or a higher contract premium during the interval | Price must keep rising |
| Deep negative funding | Short positioning or a discounted contract | A reversal is imminent |
| Price and OI rise together | More open contracts accompany the move | Which side will win next |
| Funding flips quickly | Positioning or basis changed rapidly | A durable top or bottom |
Open interest describes contracts still open on the measured feed; funding describes the periodic transfer. Read both alongside price, volume, basis and timeframe. A single snapshot cannot represent every exchange or every crypto position.
Illustrative Example: High Funding, Then a Failed Breakout
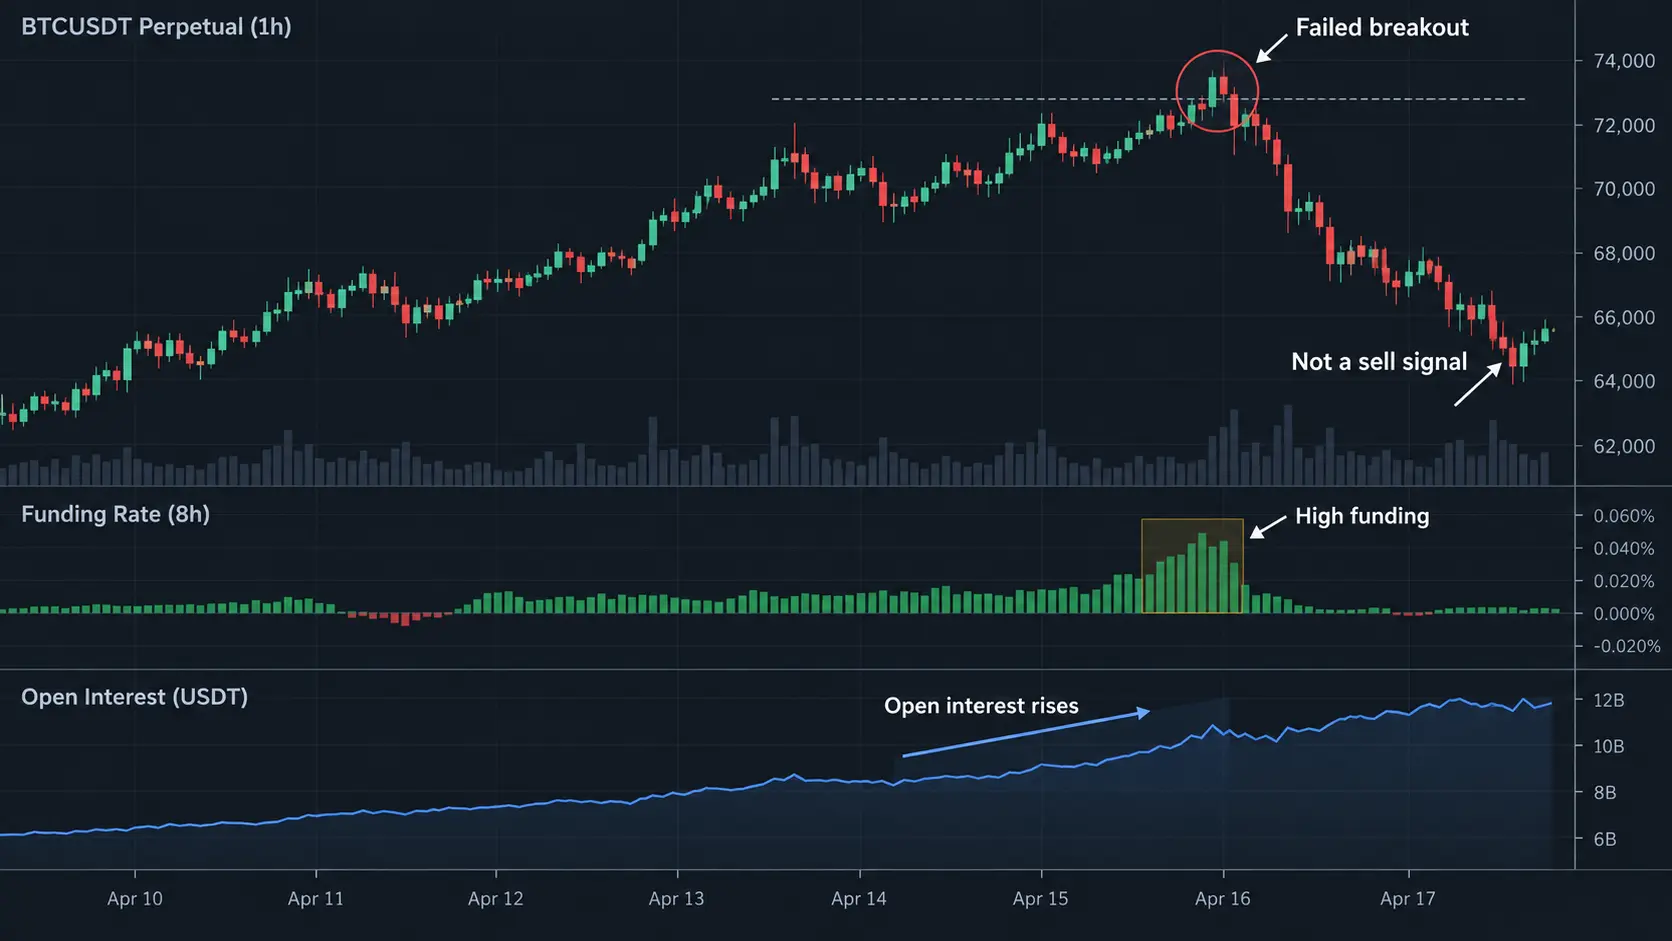
Imagine an illustrative BTCUSDT perpetual chart from 1–15 April 2025: price rises from 64,000 to 68,000 while positive funding and OI expand. Price then closes back below 68,000. The careful observation is that holding cost and crowded positioning increased in this example; it is not evidence for a short, a target or a universal failure probability. With real data, record the venue, timestamp, units and API source.
Use risk–reward planning to document invalidation and costs. High funding alone is not an execution rule.
A Funding Due-Diligence Workflow and Failure Cases
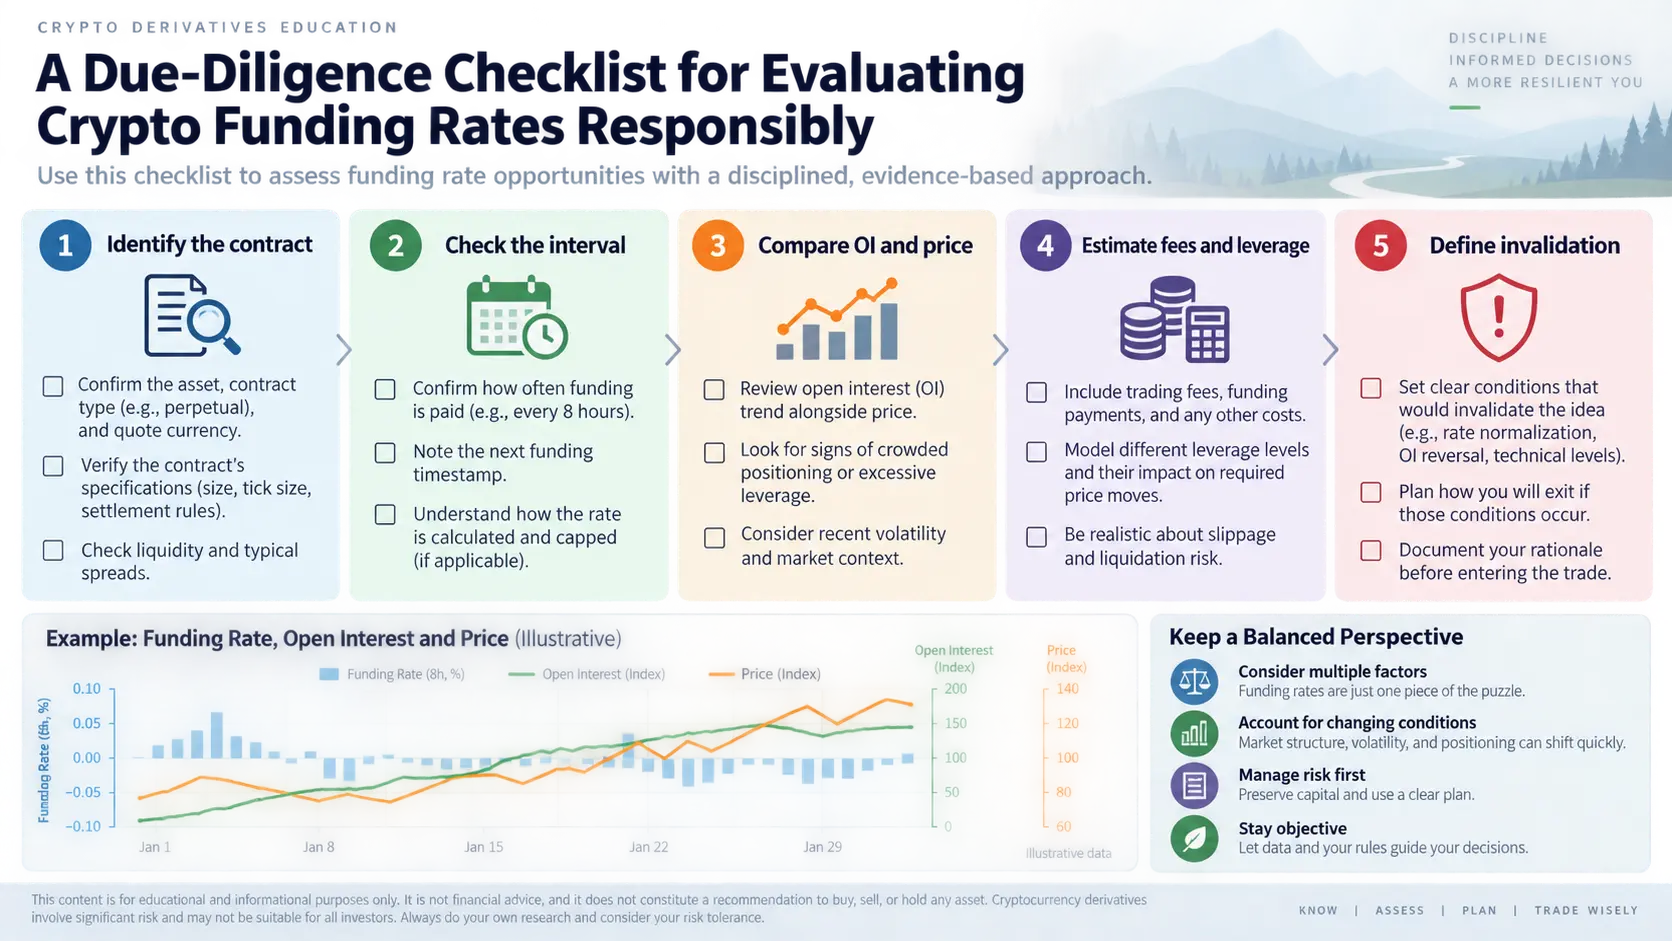
Five checks
- identify the symbol, contract type, venue, funding interval and reference price;
- review the historical rate with timestamps instead of relying on one current number;
- compare price, OI, volume and basis, separating observations from hypotheses;
- estimate notional funding, trading fees, spread and liquidation rules under the real contract;
- write invalidation, risk limits and logging fields before testing an idea.
Limits
- funding rules and data coverage differ across venues;
- a positive or negative rate can persist during a strong trend;
- aggregated OI does not include every exchange or hidden exposure;
- leverage, mark price, fees and liquidity can change the outcome;
- no funding rate guarantees profit or direction.
Pair the analysis with risk–reward planning and a trading journal to track realized costs. This page is educational, not investment advice.
Key takeaways
- Funding is a periodic perpetual-contract transfer, not an independent signal;
- direction, interval and formula depend on the venue;
- read funding with price, OI, basis, volume and liquidity;
- extreme funding can persist and can also reverse quickly;
- verify fees, mark price, liquidation rules and invalidation.
References
Risk note: This is educational content, not investment advice. Perpetual contracts and leverage can produce rapid losses; verify venue terms and manage risk.