


market structure Market structure describes how observable swing highs and swing lows form trends, ranges and transitions. BOS and CHoCH are practitioner labels whose meaning depends on the swing definition and closing-price rule chosen before the chart is reviewed. The method should be treated as a testable chart-reading framework rather than a forecast. Before using it, define the market condition, confirmation event, invalidation price, transaction costs and maximum risk. This guide explains the rules, a repeatable workflow, common failure modes and the most relevant supporting concepts.
Definition: What Is Market Structure?
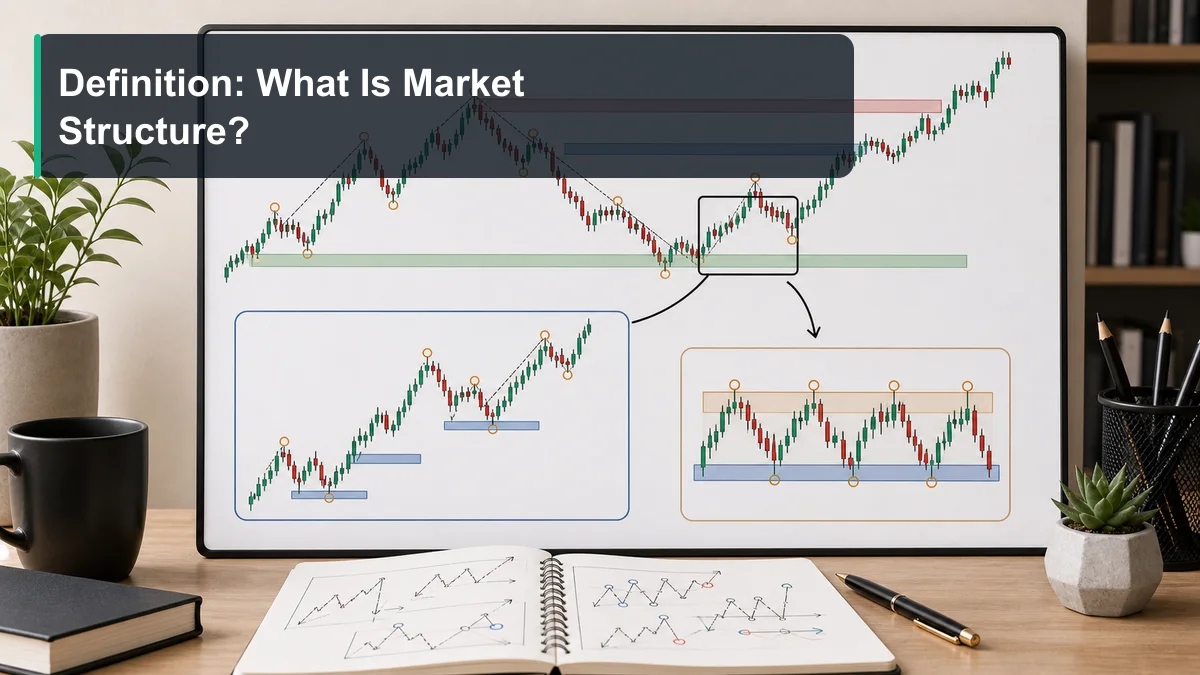
Market structure is the way price organizes itself over time. It is built from swing highs, swing lows, trends, ranges, breakouts, pullbacks, and reversals. When traders say they are reading structure, they are studying the sequence of price movement rather than reacting to one candle in isolation.
A swing high is a point where price rallies, pauses, and turns down. A swing low is a point where price falls, pauses, and turns up. When a market keeps making higher highs and higher lows, buyers are controlling the structure. When it keeps making lower highs and lower lows, sellers are controlling the structure. When price moves between similar highs and lows, the market is usually ranging.
The key idea is sequence. One candle may look bullish, but structure asks whether that candle actually changes the sequence. Did it break a meaningful high? Did it reject from a higher low? Did it fail under resistance? Did it form inside a larger range? This is why structure is more useful than simply asking whether the latest candle is green or red.
Market structure also helps traders define context. A strong uptrend does not mean every buy is safe, but it tells the trader that bullish continuation ideas may deserve more attention than random short signals. A clear downtrend does not mean every sell will work, but it warns the trader not to treat every small bounce as a full reversal. A range tells the trader to be careful with breakout entries until price proves it can leave the range and hold outside it.
For beginners, the simplest definition is this: market structure is the map of price behavior. It shows where price has accepted value, where it has rejected value, where traders are likely trapped, and where momentum may be shifting. If price action is the language of the chart, structure is the grammar that gives the words meaning.
Market structure can be read on any timeframe. A weekly chart may show a broad uptrend, while a one-hour chart may show a temporary pullback. A five-minute chart may show a fast breakout, while the daily chart still shows price inside resistance. This is why structure works best when combined with multi-timeframe analysis. The trader needs to know which structure controls the trade idea and which structure only shows short-term noise.
Core Principles of Market Structure
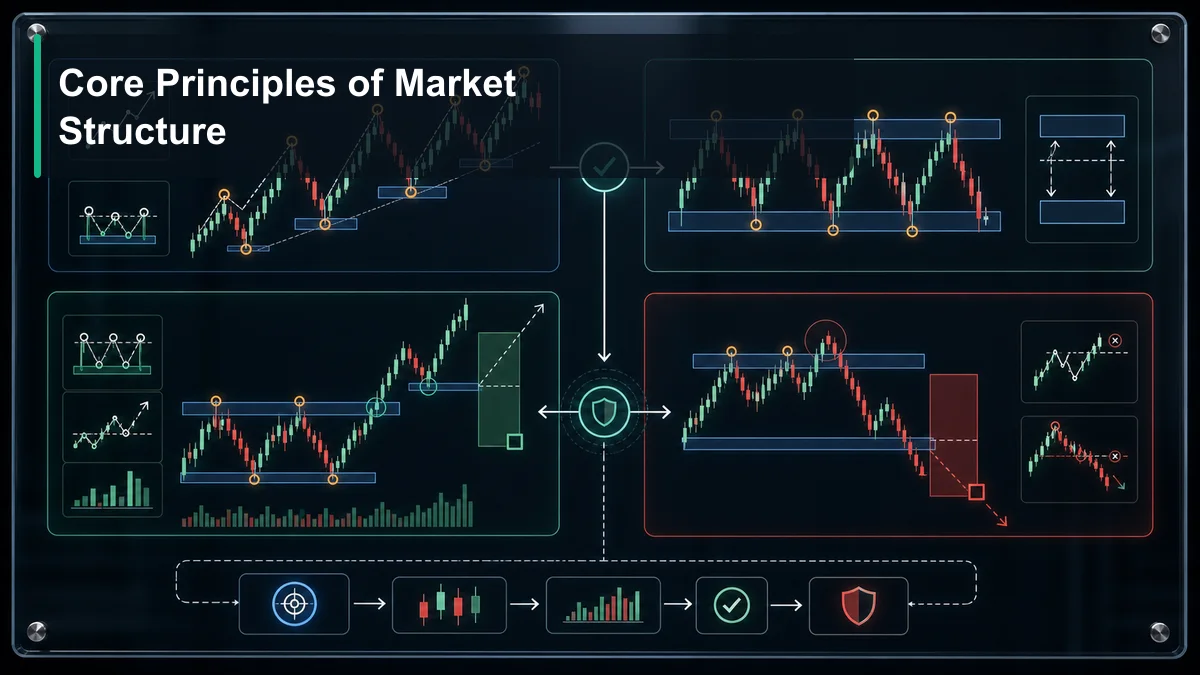
Good structure analysis starts with a few principles. These principles keep the chart readable and prevent beginners from turning every tiny fluctuation into a major signal.
Structure Is Built From Swings
Trends are not defined by feelings. They are defined by swings. In an uptrend, price generally pushes to a higher high, pulls back to a higher low, and then pushes again. In a downtrend, price generally drops to a lower low, bounces to a lower high, and then continues lower. A trader should mark the obvious swings first before looking for detailed entry signals.
Not Every High or Low Is Important
Beginners often mark too many small points. A meaningful swing should be visible without forcing the chart. It should represent a place where price clearly changed direction, created a reaction, or broke a previous decision area. Tiny candle-to-candle wiggles may matter for scalping, but they should not replace the major structure.
Context Comes Before Signal
A candlestick pattern, indicator signal, or breakout setup has value only when it appears in the right context. A bullish engulfing candle near a higher low is different from a bullish engulfing candle directly under a major lower high. Structure tells the trader whether the signal supports the broader story or fights it.
Breaks Need Follow-Through
A wick above a high is not always a true breakout. Price may sweep liquidity, trap breakout buyers, and return inside the previous range. A structure break becomes more useful when price closes beyond the level, accepts outside the area, or retests the broken level and holds. The exact confirmation depends on the strategy, but the principle is the same: a break should change behavior, not only touch a line.
Invalidation Must Be Visible
Every structure idea needs a point where it is wrong. If a trader buys because price is forming a higher low, the idea weakens if price breaks that higher low and accepts below it. If a trader sells from a lower high, the idea weakens if price breaks above that lower high with strength. Invalidation turns chart reading into a plan instead of a guess.
These principles apply across markets. Forex, crypto, stocks, indices, and commodities all move through swings, ranges, breaks, and transitions. The speed and volatility may differ, but the logic of structure remains similar. A trader who learns to read structure can adapt more easily because they are reading behavior rather than memorizing one setup.
Key Market Structure Patterns and Models
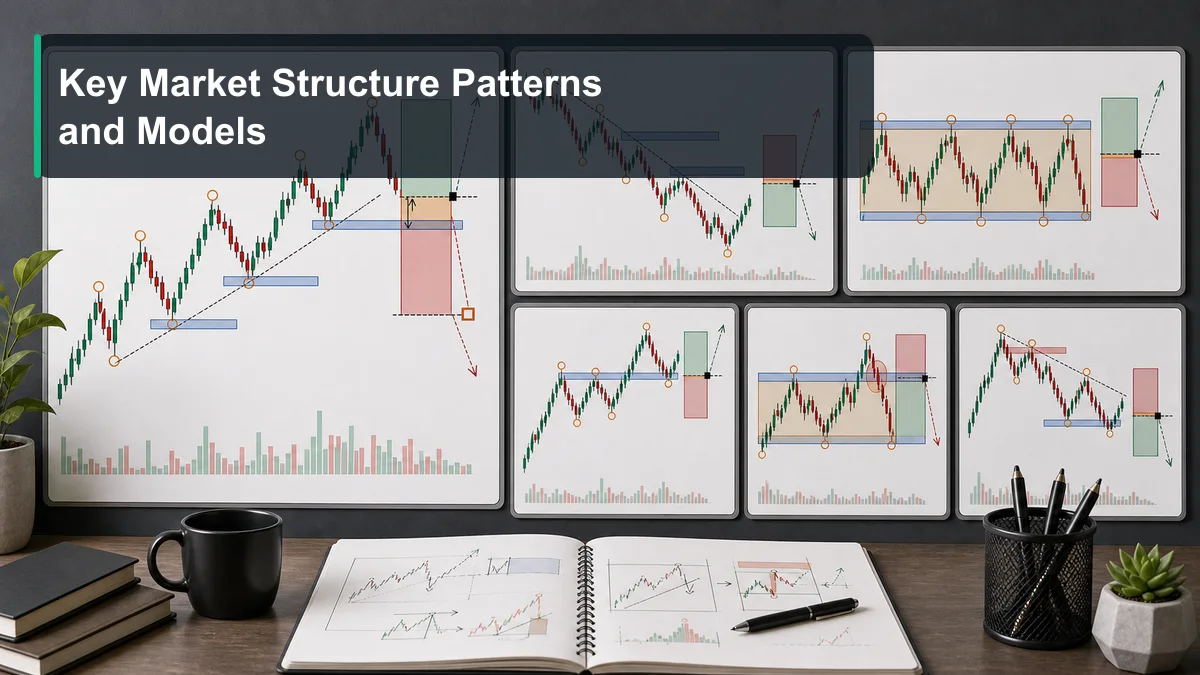
Market structure is not one pattern. It is a family of models that describe how price moves from one phase to another. The following models are useful for beginners because they appear repeatedly on real charts.
Trend Continuation Model
In a bullish continuation model, price makes higher highs and higher lows. A trader waits for a pullback into a logical area, such as prior resistance turned support, a moving average zone, or a higher-timeframe demand area. The trade idea is that buyers will defend the higher low and push price toward a new high.
In a bearish continuation model, price makes lower lows and lower highs. A trader waits for a pullback into resistance, prior support turned resistance, or a supply area. The trade idea is that sellers will defend the lower high and push price toward a new low.
Range Model
A range forms when price reacts between similar highs and lows. The market is not clearly trending. Buyers appear near the lower boundary and sellers appear near the upper boundary. Range traders often look for reactions at the edges, while breakout traders wait for price to leave the range with acceptance.
Breakout and Retest Model
A breakout happens when price moves beyond a meaningful structure level. A retest happens when price returns to that level and tests whether the old boundary now acts as the opposite side. For example, resistance may become support after a bullish breakout. This model is popular because it gives traders a clear area for entry and invalidation.
Failed Breakout Model
Not all breakouts continue. Sometimes price breaks above resistance, fails to hold, and returns into the range. This can trap breakout buyers and create a move in the opposite direction. Failed breakouts are important because they often reveal where the market rejected a price area.
Reversal Transition Model
A reversal rarely appears from one candle alone. More often, structure begins to weaken first. In an uptrend, price may fail to make a strong new high, then break a higher low, then form a lower high. In a downtrend, price may fail to make a strong new low, then break a lower high, then form a higher low. These transitions help traders avoid calling reversals too early.
Beginners should not try to trade every model at once. A better approach is to choose one or two models and collect examples. For instance, a trader may focus only on trend continuation and breakout-retest until they can recognize those models quickly. After that, failed breakouts and reversal transitions become easier to understand.
How to Identify Market Structure on a Chart

Identifying market structure is a repeatable process. The goal is not to draw every possible line. The goal is to make the chart simple enough to guide decisions.
Start With the Obvious Swings
Zoom out and mark the most visible swing highs and swing lows. If a point is not obvious, do not force it. The best structure levels are usually clear enough that many traders can see them. This does not make them guaranteed, but it makes them relevant.
Define the Current State
Ask whether price is trending up, trending down, ranging, or transitioning. If price is making higher highs and higher lows, the current state is bullish. If it is making lower lows and lower highs, the current state is bearish. If price keeps reacting between similar boundaries, it is ranging. If the sequence is breaking down, it may be transitioning.
Mark Key Zones, Not Just Thin Lines
Support and resistance are often better drawn as zones because price does not always react at an exact number. A zone can include the body and wick area where price repeatedly changed behavior. Structure becomes clearer when the trader marks the area where decisions happened, not just one perfect line.
Watch How Price Behaves at the Zone
The reaction matters. Does price reject strongly? Does it hesitate? Does it break through and hold beyond the area? Does it sweep a previous high or low and then reverse? Behavior at structure levels often gives better information than the level itself.
Separate Breaks From Sweeps
A break suggests that price is accepting beyond a structure point. A sweep suggests that price briefly moved beyond a point, triggered liquidity, and returned. The difference is important. A trader who treats every sweep as a breakout may enter late and get trapped. A trader who waits for confirmation can avoid many weak signals.
Check the Higher Timeframe
Structure on the execution chart should be compared with the higher timeframe. A one-hour bullish break is more meaningful if it happens from a daily support area. A fifteen-minute bearish break is more dangerous to short if the four-hour chart is sitting at strong demand. This is where price action and multi-timeframe reading work together.
Once the structure is marked, the trader should be able to explain the chart in one or two sentences. For example: “The daily chart is in an uptrend, price pulled back into support, and the one-hour chart is trying to form a higher low.” If the explanation takes ten sentences, the chart may be too unclear to trade.
A Market Structure Trading Workflow
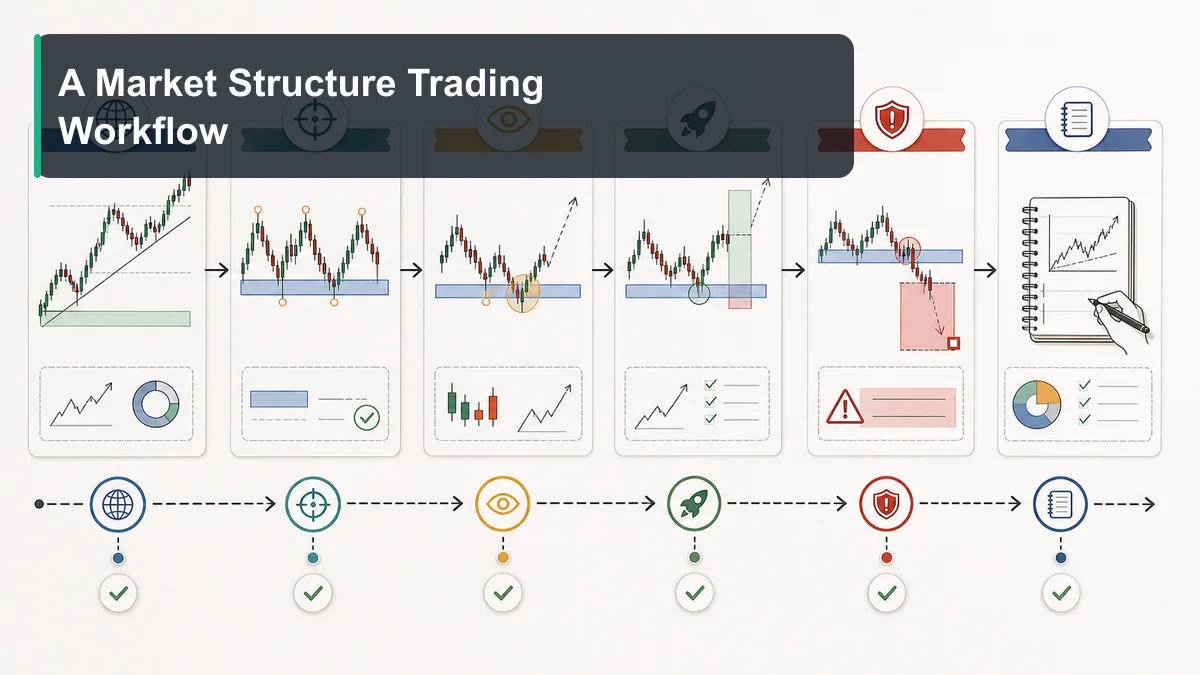
A workflow helps traders use market structure consistently. Without a workflow, it is easy to change the analysis after every candle. The following process is simple enough for beginners but complete enough to support serious review.
Step 1: Define Higher-Timeframe Context
Start with the chart that controls the trade idea. For a swing trader, this might be the daily chart. For a day trader, it might be the four-hour or one-hour chart. Mark the major trend, range, or transition. Identify the most important support and resistance zones.
Step 2: Choose the Active Structure Level
Do not mark every level. Choose the level that price is currently interacting with or moving toward. This might be a prior high, prior low, range boundary, breakout level, or pullback zone. The active level should matter to the next decision.
Step 3: Wait for Behavior
Structure is useful because it lets traders wait. Instead of predicting blindly, watch how price behaves at the level. Does it reject? Break and retest? Fail to continue? Sweep and return? The behavior narrows the possible trade idea.
Step 4: Move to the Execution Chart
After the context is clear, a lower timeframe can help refine entry. A trader may look for a smaller higher low, lower high, candlestick confirmation, minor break of structure, or retest. The lower timeframe should support the higher-timeframe idea, not create a completely different story.
Step 5: Define Invalidation and Risk
Before entry, identify where the structure idea is wrong. A trade based on a higher low may be invalidated below that low. A breakout-retest idea may be invalidated if price returns inside the old range and accepts there. Position size should be based on the distance to invalidation and the trader’s risk plan.
Step 6: Journal the Result
After the trade, record the structure state, level, trigger, invalidation, outcome, and lesson. Over time, the journal shows which structure models work best for the trader. It also exposes repeated mistakes, such as entering before confirmation or ignoring a higher-timeframe level.
This workflow keeps structure practical. It does not ask the trader to predict every move. It asks the trader to identify the environment, wait for behavior, plan risk, and review the result. That is enough to build a cleaner process.
Examples of Market Structure Analysis
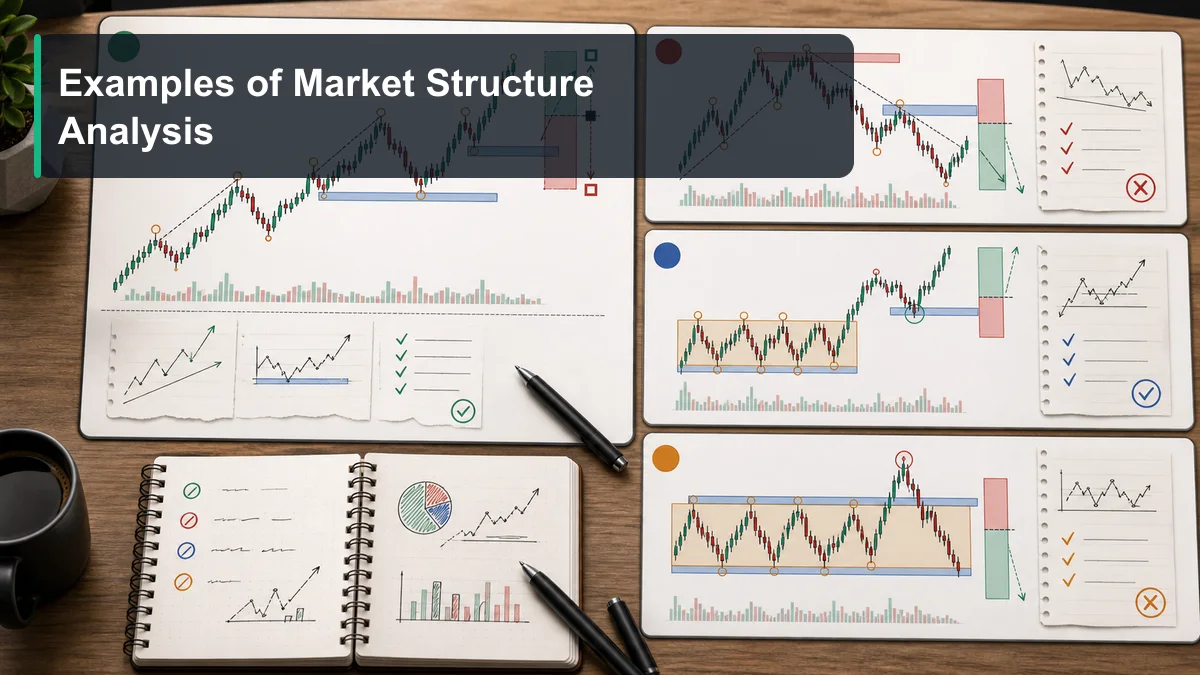
Examples help connect theory to chart reading. The following scenarios are simplified, but they reflect common situations traders see often.
Example 1: Bullish Continuation After a Pullback
Price is in an uptrend on the four-hour chart. It makes a higher high, then pulls back into a prior resistance zone that may act as support. On the one-hour chart, selling pressure slows and price forms a higher low. A trader who understands structure sees that the pullback is not automatically bearish. It may be a continuation opportunity if buyers defend the zone.
Example 2: Bearish Transition From an Uptrend
Price has been making higher highs, but the latest push barely breaks the previous high and quickly rejects. Then price breaks below the most recent higher low. After the break, the market retests from below and forms a lower high. This sequence does not guarantee a reversal, but it shows that the uptrend structure has weakened.
Example 3: Range Breakout and Retest
Price has moved sideways for several sessions. It breaks above the range high with strong momentum, then returns to retest the old boundary. If price holds above the range and forms bullish structure on the lower timeframe, the breakout is more credible. If price falls back inside the range, the breakout is weaker.
Example 4: Failed Breakout Trap
Price breaks above resistance and attracts breakout buyers. Instead of continuing, it quickly returns below the level and closes back inside the range. Buyers who entered late are now trapped. If price then forms lower highs under the failed breakout level, the structure may support a move back toward the range low.
The lesson from these examples is that structure is about sequence and behavior. A single candle rarely tells the whole story. The trader should ask what price did before the signal, what level the signal appeared at, what happened after the level was tested, and where the idea becomes invalid.
Related Guides and Next Learning Path

Market structure is a central topic inside the broader price action learning path. It connects directly to support and resistance, candlestick patterns, multi-timeframe analysis, breakout trading, trend continuation, reversals, and risk management.
A good next step is to study the main Price Action Trading complete beginner guide. That guide explains the broader framework that market structure belongs to. From there, traders can study candlesticks, support and resistance, and multi-timeframe analysis as separate but connected skills.
The Candlestick Patterns complete guide is useful because candles often provide the trigger inside a structure area. A bullish rejection candle matters more when it appears at a higher low. A bearish engulfing candle matters more when it appears under a lower high or at resistance. Candles are more powerful when structure tells the trader where to look.
The Multi-Timeframe Analysis complete guide is also important. Structure can look bullish on a lower timeframe while bearish on a higher timeframe. It can look bearish on an entry chart while price is only pulling back into a larger support area. Multi-timeframe analysis helps traders decide which structure is most important.
Future Structure cluster guides can go deeper into topics such as break of structure, change of character, trend continuation, range trading, breakout-retest setups, failed breakouts, swing mapping, and structure-based risk placement. This pillar should act as the parent page for those more specific guides.
For beginners, the best practice is simple: pick one market, one timeframe stack, and one structure model. Collect screenshots. Mark the swings. Write the structure state in one sentence. Record the outcome. Over time, market structure stops feeling abstract and becomes a practical trading language.
Key takeaways
- Market structure describes how observable swing highs and swing lows form trends, ranges and transitions.
- BOS and CHoCH are practitioner labels whose meaning depends on the swing definition and closing-price rule chosen before the chart is reviewed.
- Define the swing degree, require a consistent break rule and separate a possible transition from a confirmed new trend.
- A valid plan separates location, trigger, invalidation, position size and exit logic.
A validation workflow you can reproduce
- Define the sample: choose the market, timeframe, session and date range before reviewing outcomes.
- Write the rule: Define the swing degree, require a consistent break rule and separate a possible transition from a confirmed new trend.
- Record invalidation: identify the observable price event that disproves the setup.
- Include execution costs: account for spread, commission and slippage where relevant.
- Validate separately: test the finished rule on data that was not used to create it.
When this concept is unreliable
Structure analysis becomes subjective when minor internal swings are mixed with major external swings to support the desired bias. Keep failed and skipped examples in the journal so the review is not limited to attractive winners.
Use this concept within a complete analysis
This method should remain connected to its parent framework and adjacent decision steps. Use ICT Market Structure Explained, Trading Theories: Complete Guide to Technical Analysis Frameworks and Technical Indicators: Types, Formulas and Practical Use to compare definitions, establish context and avoid treating one signal as a complete trading system.
References and methodology
Practise before considering real capital
Use historical charts or a demo account to test the written rules before considering live execution. Review the Exness account and demo information. Availability, protections and trading conditions depend on jurisdiction, so review the applicable legal documents yourself.
Affiliate disclosure: Học Làm Trader may receive a commission if you open an account through this link, at no additional cost to you. This relationship does not determine the educational conclusions.
Risk warning: This article is for education and general information only. It is not investment advice, a trade signal or an invitation to trade. Trading can result in loss of capital, and past examples do not guarantee future results. Assess your own circumstances and risk tolerance.
Related guides in this topic
A bearish sequence is developed in lower highs and lower lows, including confirmation, range exceptions and invalidation.