


Andrews Pitchfork is a three-line drawing tool built from three selected pivots. A median line runs from the first pivot toward the midpoint of the next two, with parallel upper and lower lines. It can organise a trend or channel hypothesis, but anchor choice is subjective and a line touch is not a guaranteed reaction.
What Is Andrews Pitchfork?
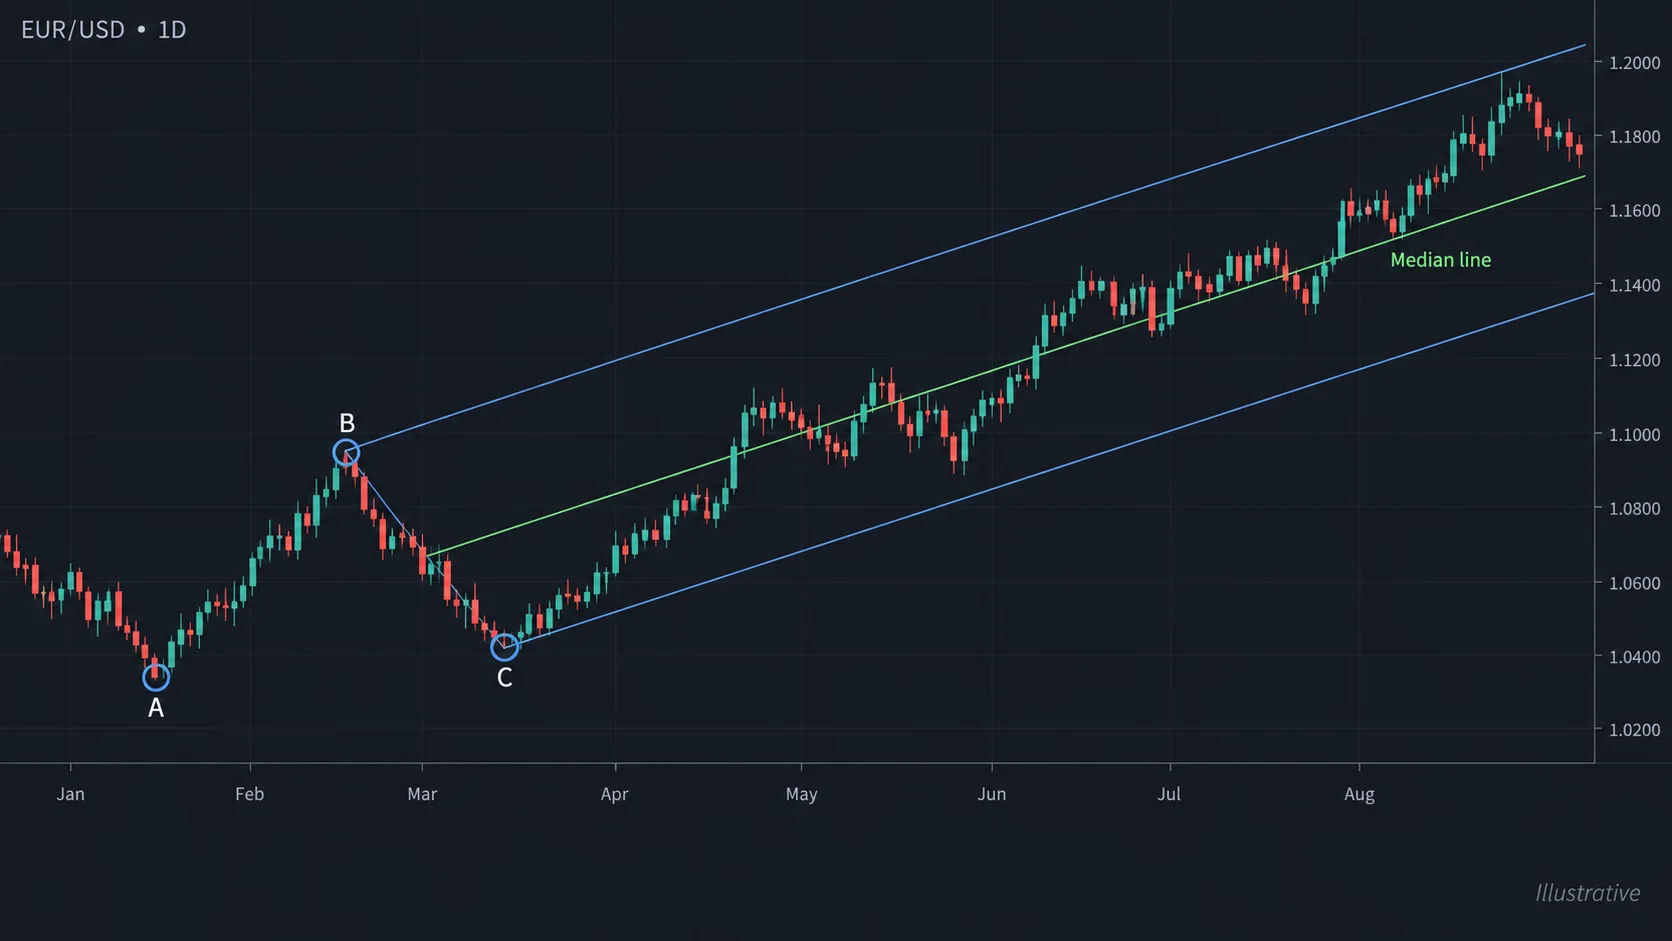
The tool gives a geometric frame for observing possible support, resistance and trajectory. It does not create new price information. A pitchfork that fits one segment can stop fitting after a regime change, so keep the anchor rule and timeframe visible in research notes.
Compare the lines with market structure and risk–reward planning; do not treat a median-line touch as an independent signal.
Construction: Three Pivots and a Median Line
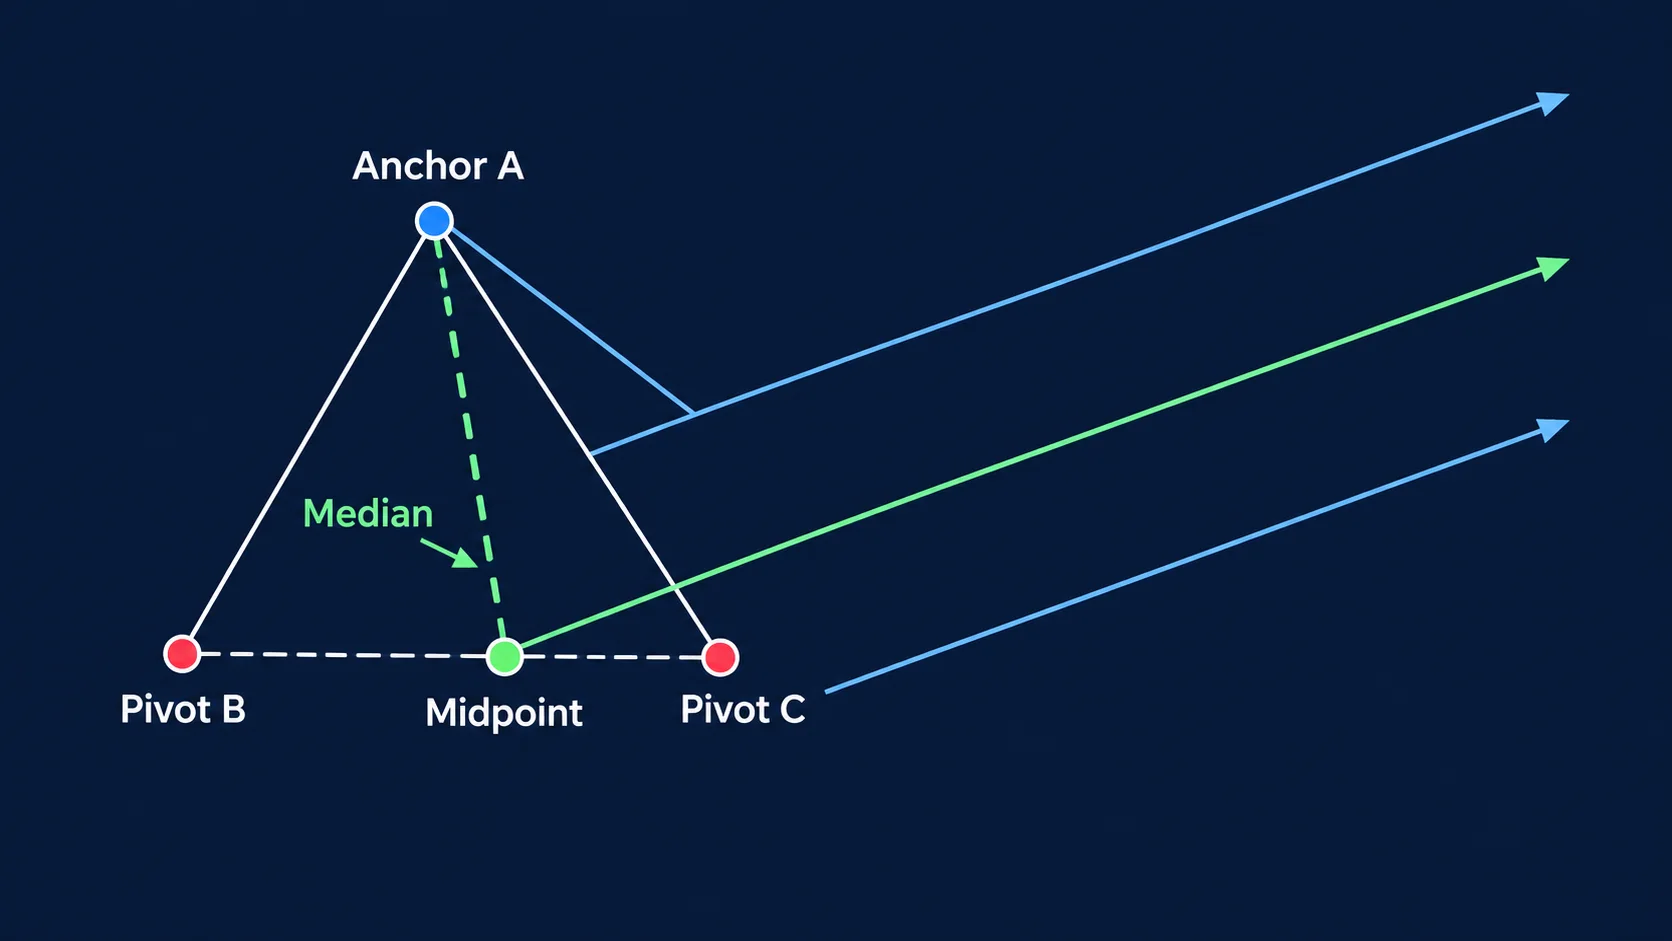
Choose three meaningful pivots in time order. Draw the median line from pivot A through the midpoint between B and C, then create parallels through B and C. Platforms may offer standard, Schiff or modified variants; these are not interchangeable. Document which variant, price field, timeframe and timezone were used.
| Observation | May suggest | Does not prove |
|---|---|---|
| Price respects median | The selected geometry remains useful in the sample | Future support or resistance |
| Touch of outer parallel | A reaction occurred at a projected line | A reversal is certain |
| Close through a tine | The prior projection weakened | A new trend direction |
| Re-anchoring fits better | Market structure changed | The earlier fork was “wrong” |
Illustrative Failure: Break Through a Warning Line
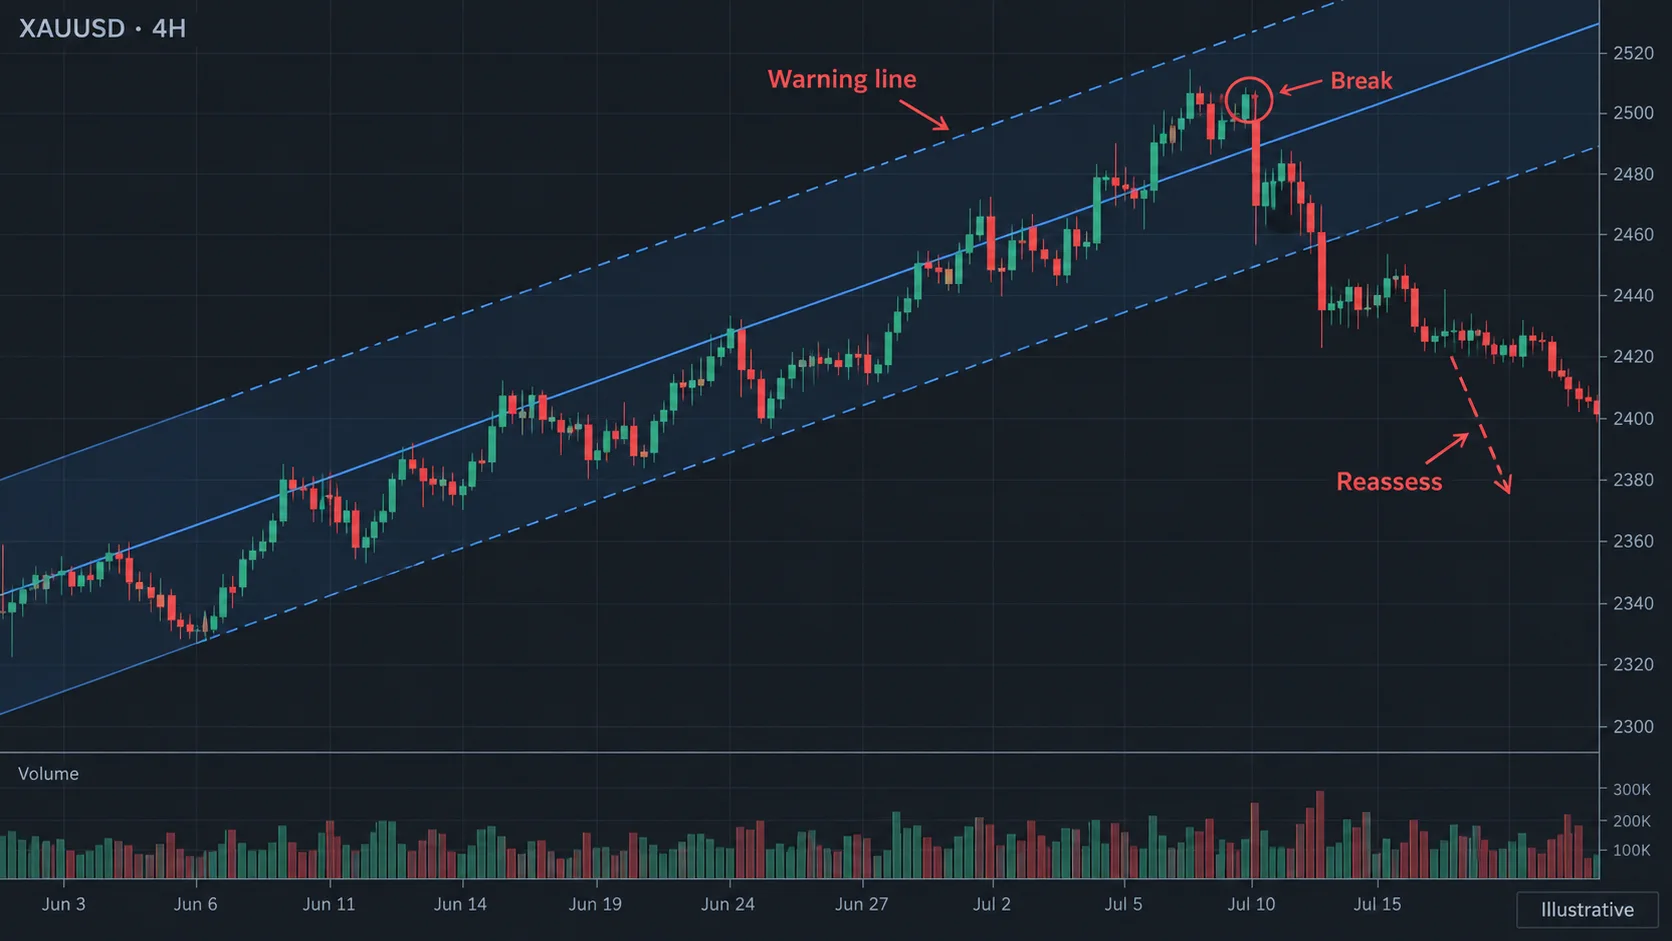
Suppose a fictional XAU/USD H4 sample follows the median line for several swings, then closes beyond the upper warning line during a volatility spike. The break weakens the earlier projection; it does not prove continuation or a target. Re-check the three pivots, higher-timeframe structure, spread and event context before drawing a new fork. Avoid moving anchors solely to preserve a preferred narrative.
Failure cases
- selecting pivots after seeing the entire outcome;
- using a different pitchfork variant without recording it;
- counting a wick as acceptance beyond a line;
- moving anchors repeatedly until price appears to fit;
- projecting a target without a tested measurement rule.
A Repeatable Workflow and Limits
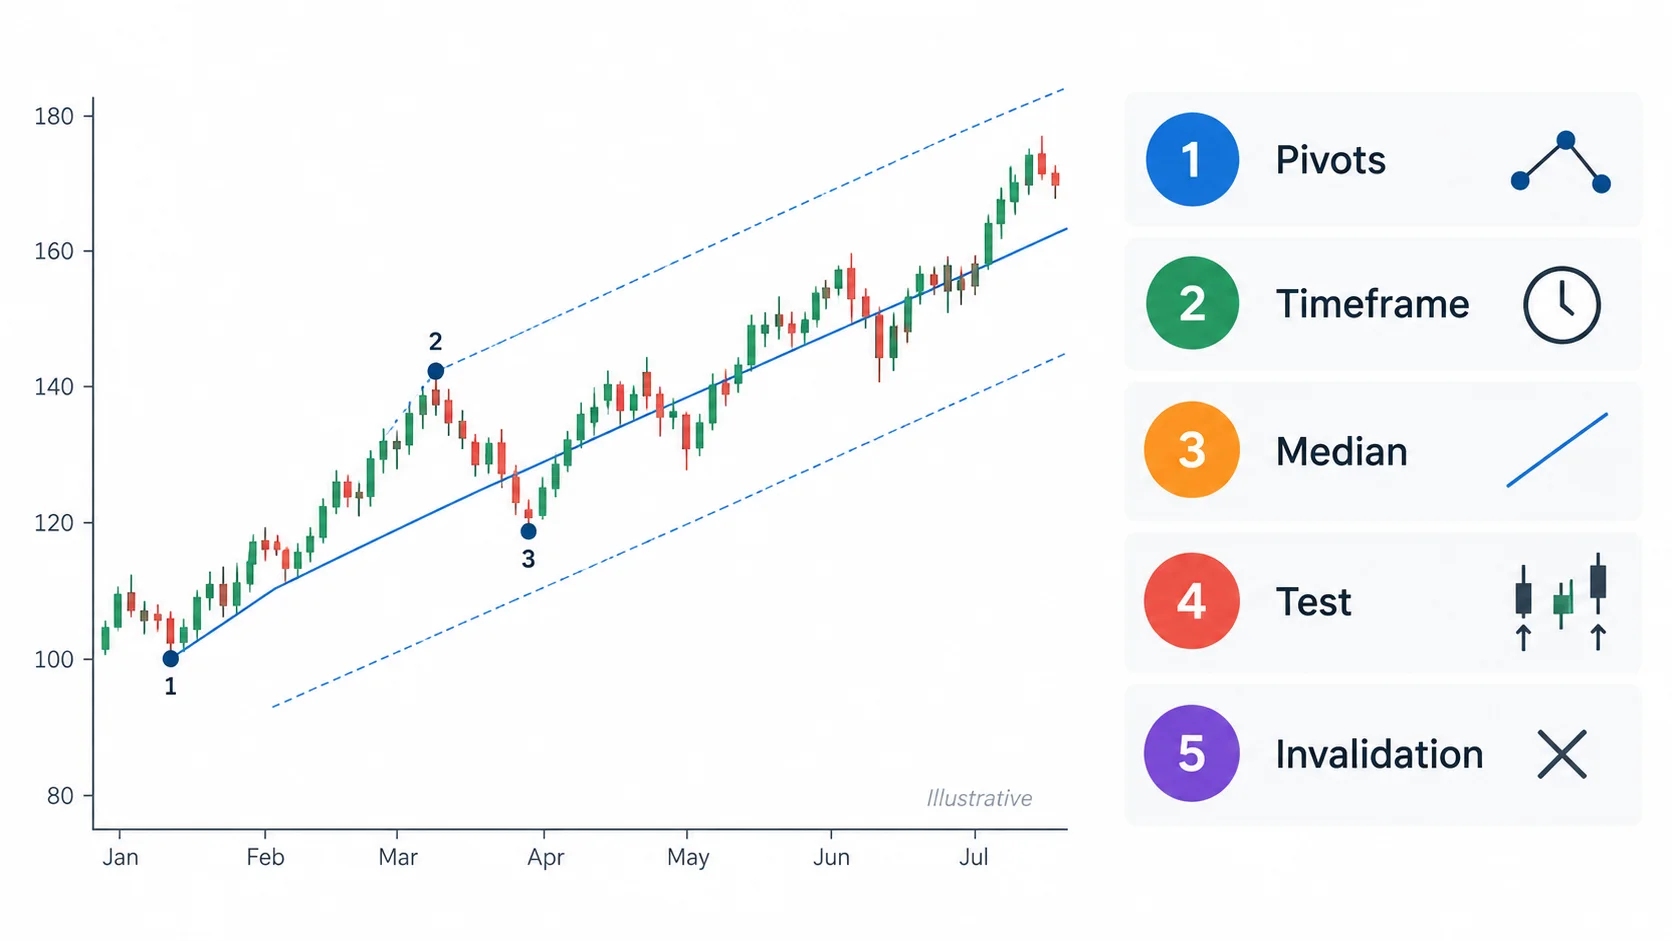
- mark pivots with a rule defined before the sample;
- draw the standard fork and record variant, timeframe and data feed;
- observe closes, retests and reactions rather than isolated touches;
- set invalidation and position size with position sizing;
- test multiple markets and include forks that fail or need re-anchoring.
Limits
- anchor selection is interpretive;
- line projections are not forecasts;
- different variants and feeds produce different geometry;
- news and gaps can invalidate a channel quickly;
- the drawing tool does not replace risk management.
Key takeaways
- Andrews Pitchfork is a three-pivot geometric frame;
- the median line uses the midpoint of two later pivots;
- variant, timeframe and anchor rules must be recorded;
- a line break calls for reassessment, not certainty;
- test the drawing across samples and define risk separately.
References
Risk note: This is educational content, not investment advice. Trading can result in losses; validate data, costs and risk limits independently.