


Elliott Wave Fibonacci ratios are measurement conventions used to compare retracements and extensions inside a wave count. Common references include 0.382 and 0.618 retracements and 1.0, 1.618 or 2.618 extensions. They help frame scenarios and invalidation; they do not identify a guaranteed target or override price structure.
Fibonacci ratios inside an Elliott count
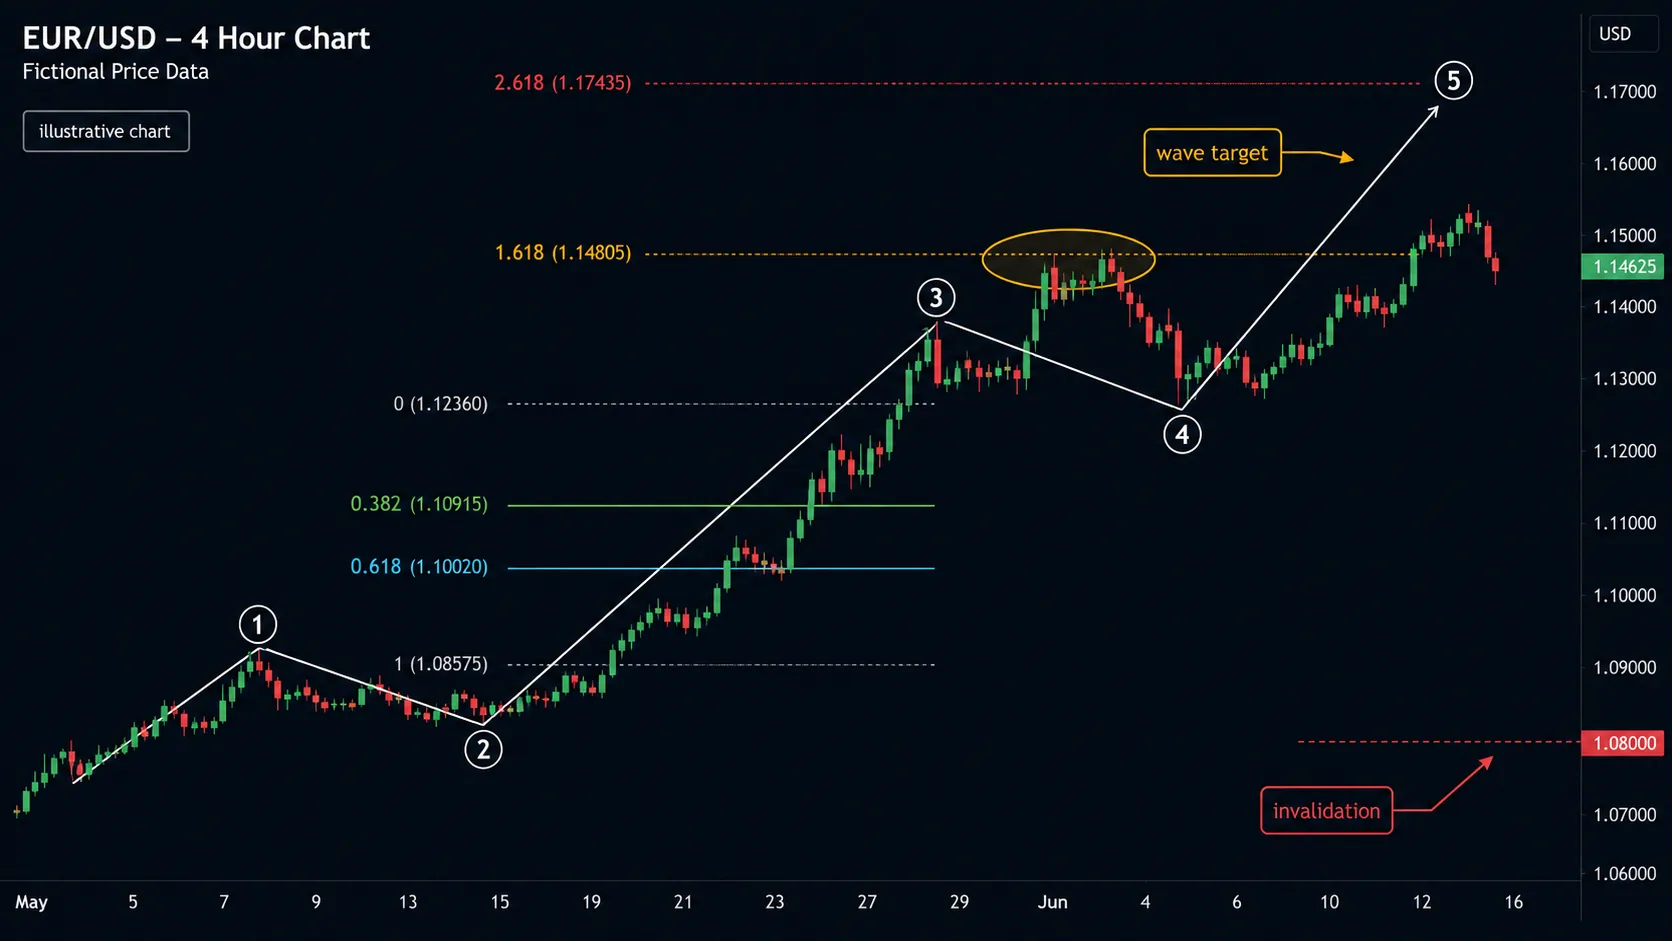
Start by identifying the swing points that the count actually uses. A retracement of wave 2 can be measured against wave 1, while a projection for wave 3 or wave 5 uses an earlier impulse leg as its reference. The same ratio can therefore describe a different price level when the anchor points change. Write the anchors, timeframe and whether you measured wicks or closes before interpreting the number.
In the illustrative EUR/USD chart, the 0.382 and 0.618 lines describe possible pullback depth; the 1.618 and 2.618 lines are extension references. Price reaching a line is an observation, not confirmation. The Elliott impulse guide is useful for checking the structural rules before adding ratios.
Fibonacci works best as a transparent measurement layer: a reader should be able to reproduce it from the same swings. Avoid changing anchors to make a completed chart look precise.
Extensions, wave targets and invalidation
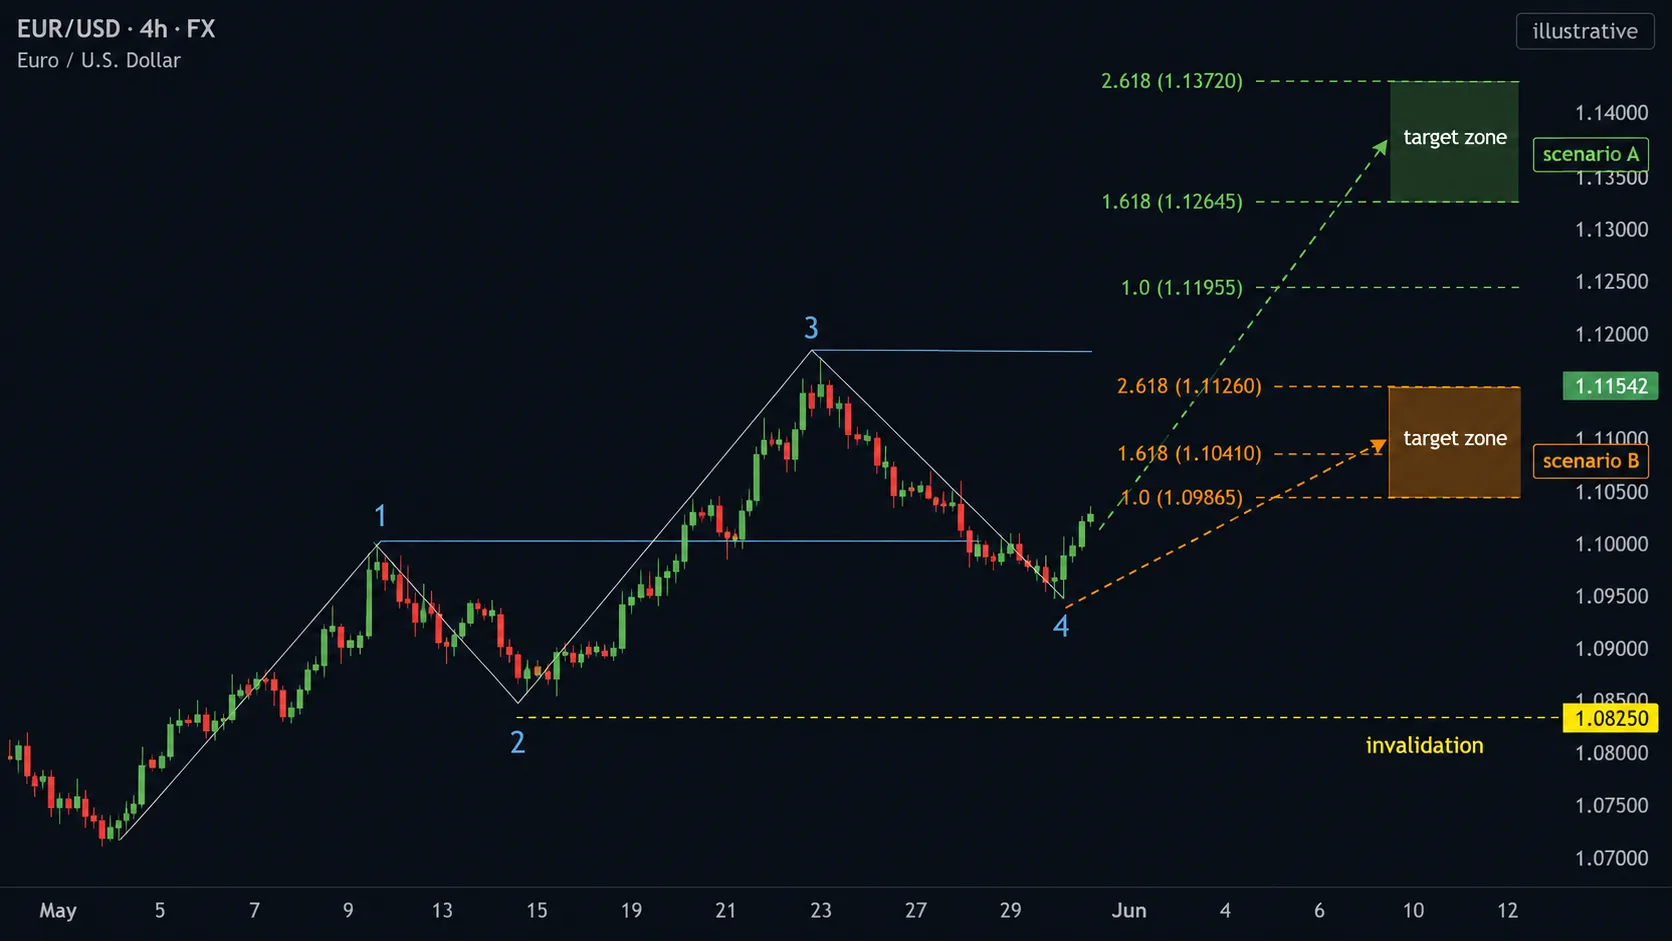
Extensions create a range of candidate targets rather than a single promise. For example, project wave 1 from the end of wave 2, or compare wave 5 with wave 1 and wave 3. Label each scenario separately so that a target is not silently treated as the active count. If several projections overlap, call it a confluence zone, not proof that price must reverse there.
| Measurement | Question | Failure condition |
|---|---|---|
| Wave 2 retracement | Which completed wave is the anchor? | Count violates the chosen impulse rule |
| Wave 3 extension | Does momentum and structure support the count? | Price returns through the wave-2 origin |
| Wave 5 projection | Is the target a scenario or a forecast? | Count requires an impossible overlap |
In a written plan, invalidation comes from the count and market structure, not from the Fibonacci line alone. Compare the arithmetic with the site’s Fibonacci strategy guide, and record the exact formula and data source.
Testable counting workflow and failure cases
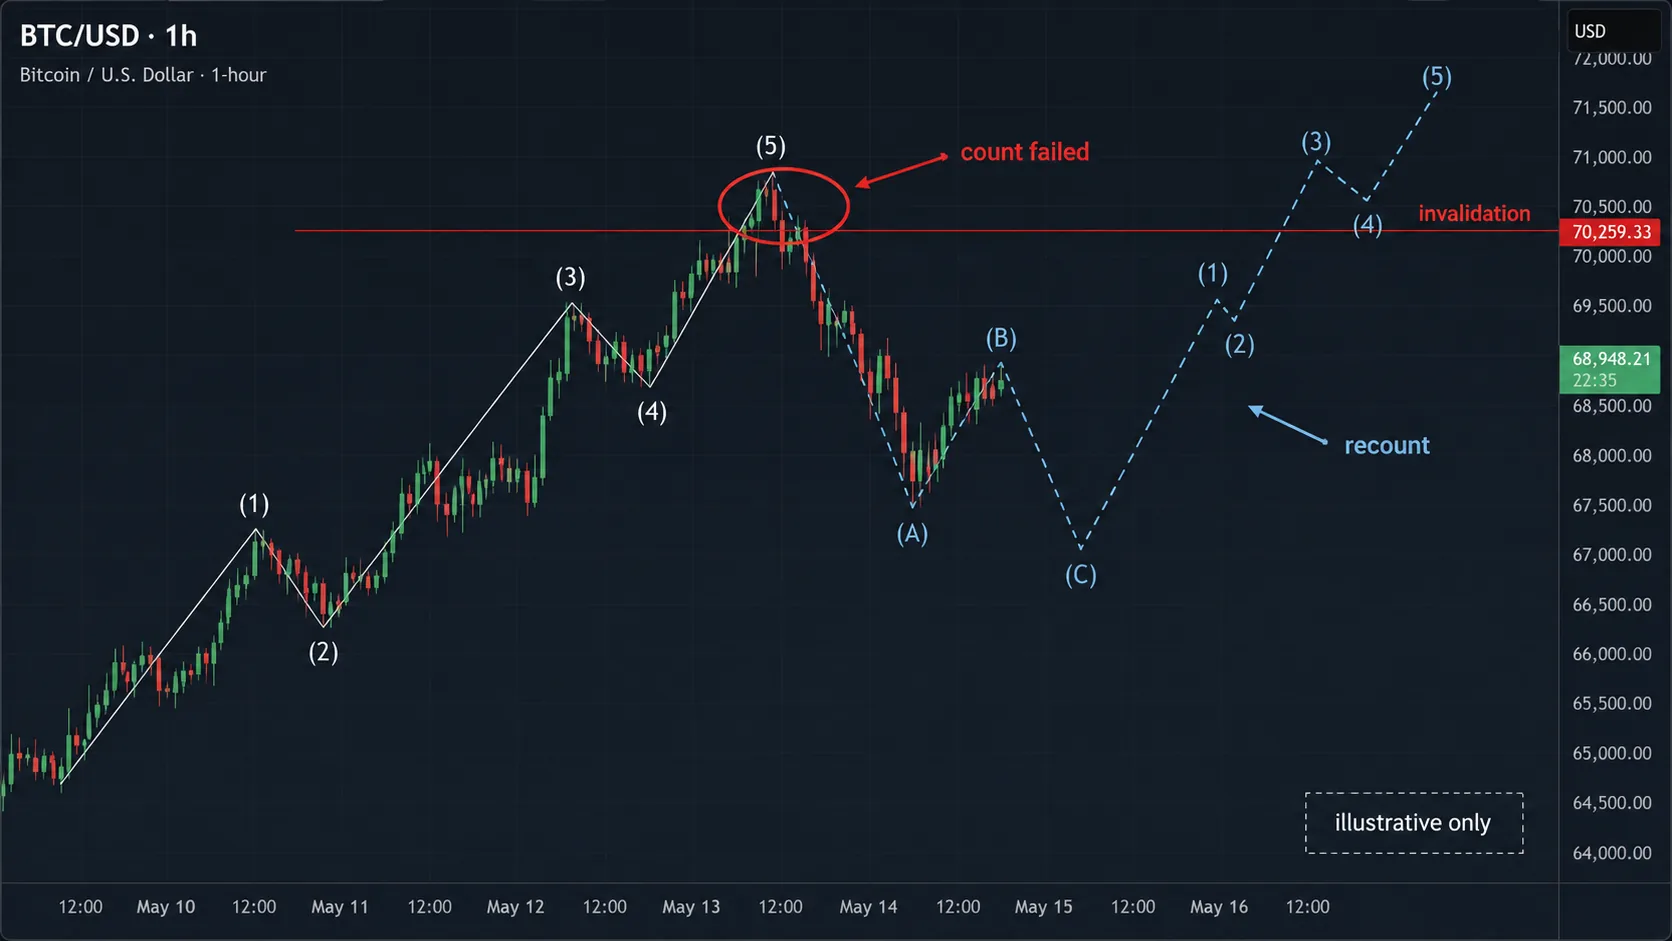
An Elliott count is a hypothesis that should survive explicit tests. Freeze the timeframe, mark the degree of the count, and list the rule that would make the count invalid. Do not keep adding ratios after price has already moved; that creates hindsight bias.
- Mark the primary swing points and label the count before measuring.
- Calculate retracement and extension levels from fixed anchors.
- Write one or more scenarios with separate invalidation levels.
- Log whether price respected, overshot or ignored each zone.
- Review failed counts and alternative counts without rewriting history.
The corrective-wave guide helps when an apparent impulse becomes a correction. A small set of attractive examples cannot establish an edge; use dated, out-of-sample observations and include spread, slippage and ambiguous counts.
Further reading: Use the trading glossary for retracement, extension and invalidation terms.
Risk disclosure: This article is educational information, not investment advice or a solicitation to trade. Wave counts and chart patterns can fail, illustrative charts do not predict future results, and leveraged trading can result in loss of capital. Define risk and verify your data before acting.
Pingback: ICT Optimal Trade Entry Explained