


Profit Factor in trading is the ratio of total gross profit to the absolute value of total gross loss. An illustrative sample with 2,400 gross profit and 1,600 gross loss produces a Profit Factor of 1.50. The metric describes one slice of a trade log; it does not by itself prove an edge, stability or future profitability.
Profit Factor formula and interpretation
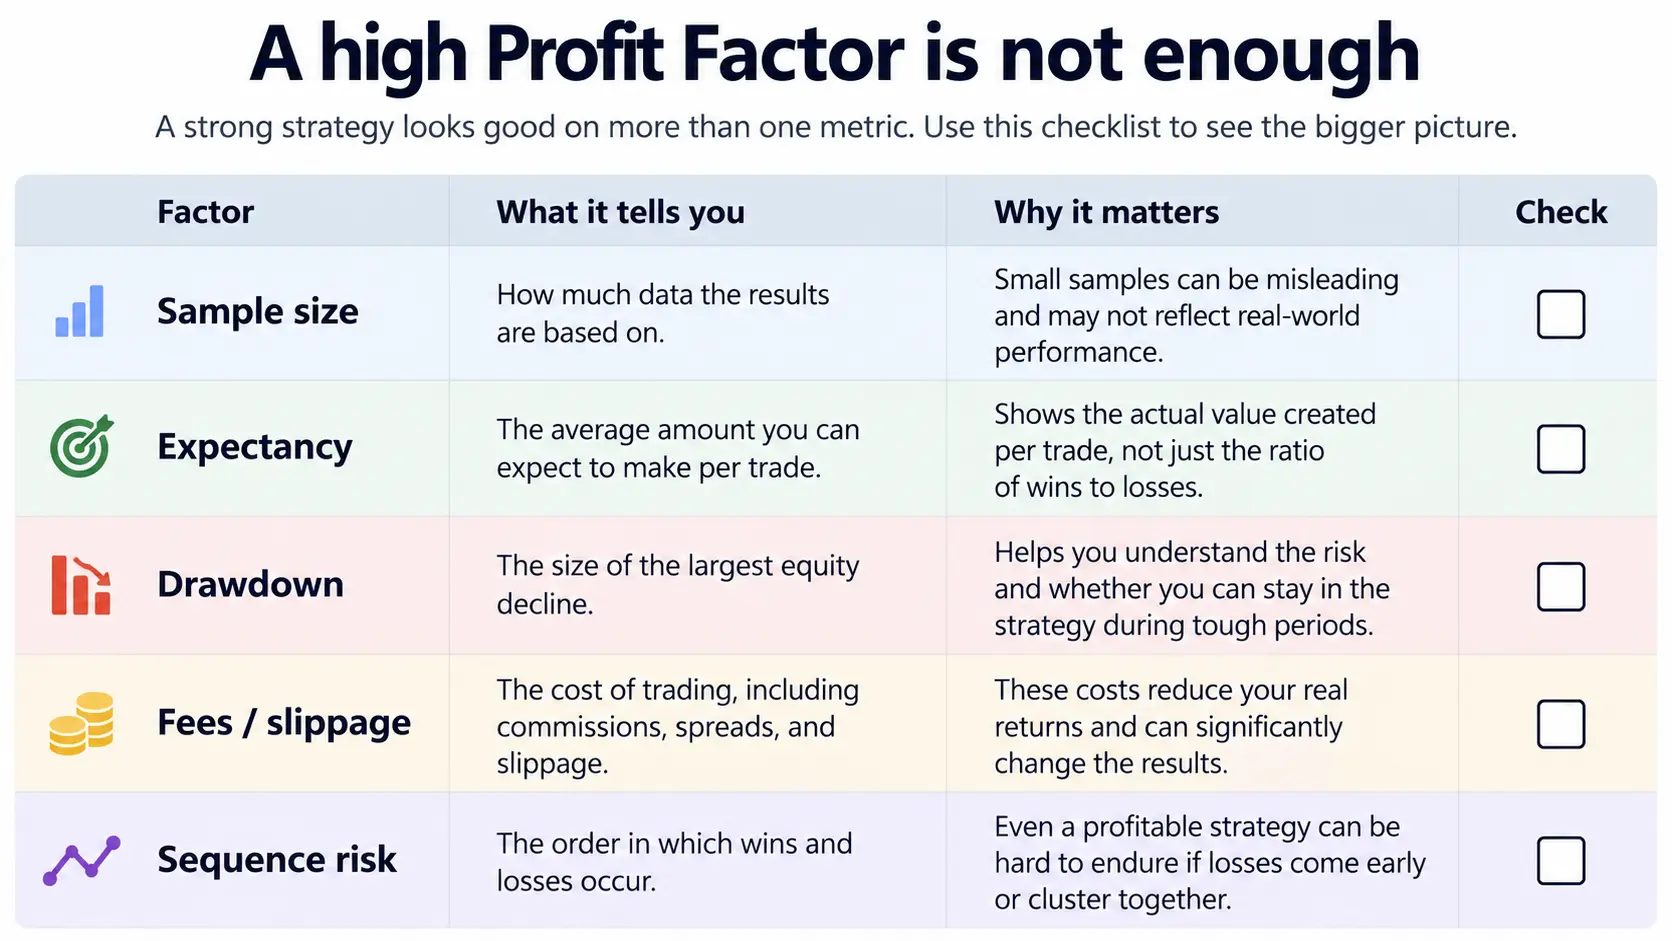
Profit Factor = Gross Profit / |Gross Loss|. State the date range, symbols, timeframe, fees, commission, swap and slippage assumptions when reporting it. A number without a definition and measurement date is difficult to reproduce or compare.
What can Profit Factor tell you?
| Observation | Possible interpretation | What it cannot establish |
|---|---|---|
| Gross profit exceeds gross loss | The aggregate result is positive before other context | That the sample will repeat |
| Profit Factor differs by setup | Trade distributions vary between groups | That one setup is universally superior |
| Profit Factor falls after costs | Trading friction matters | That the broker is always the cause |
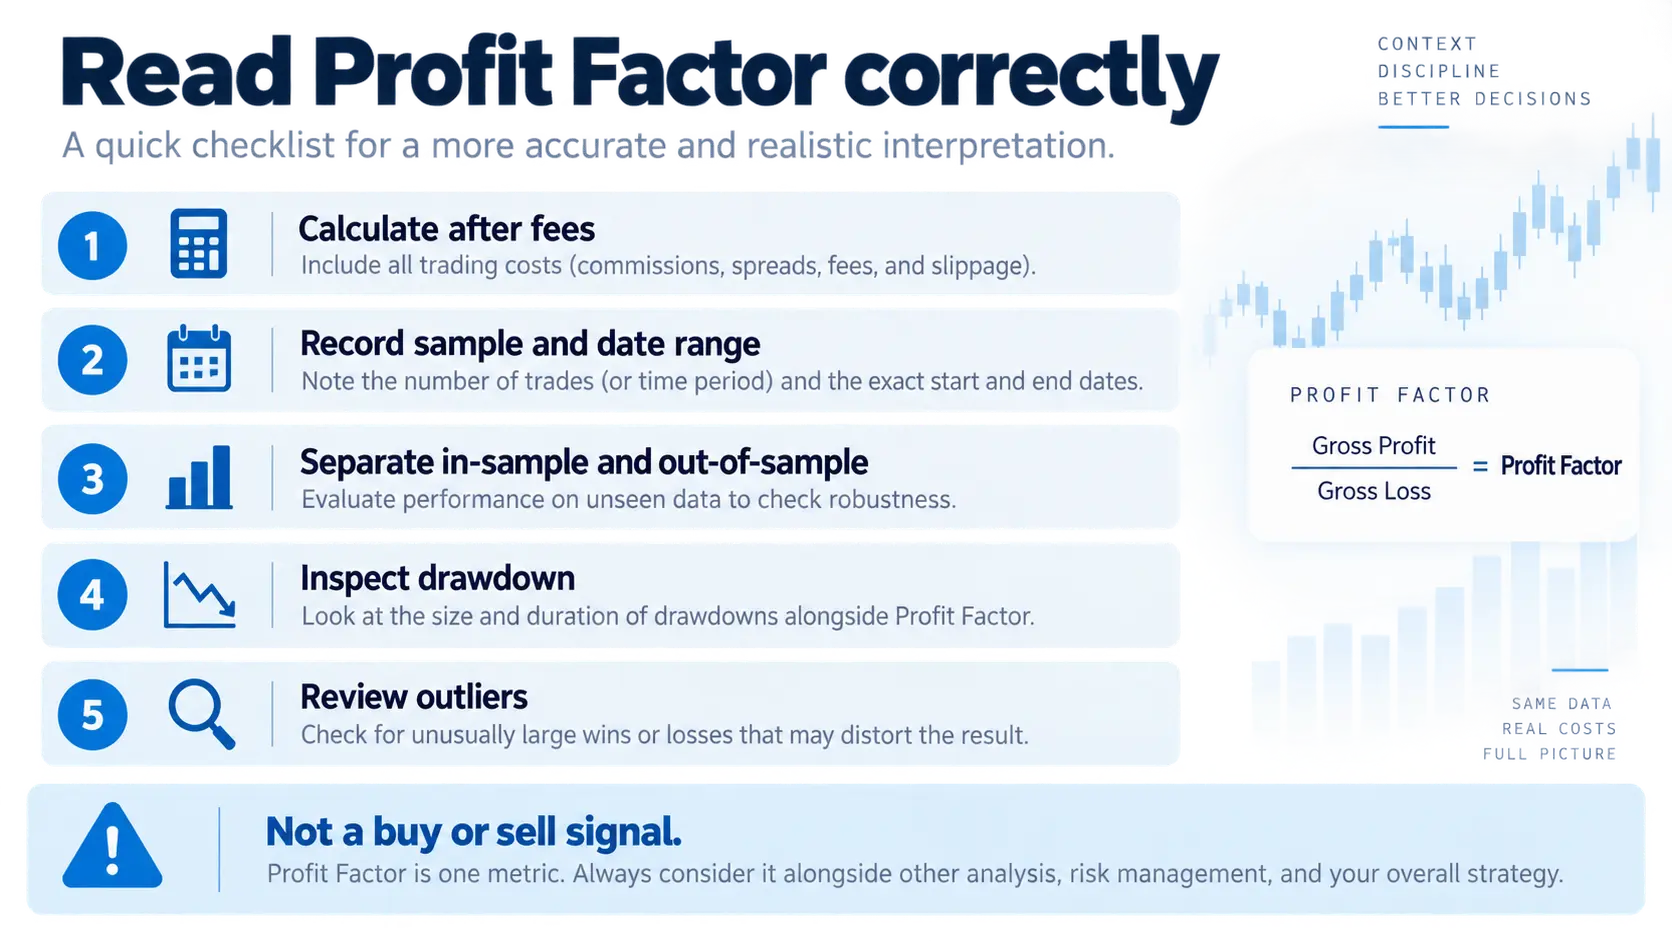
Read the metric alongside risk–reward planning, position sizing and the site’s research workflow. Profit Factor contains no direct information about recovery time or the path of drawdown.
Why a high Profit Factor is not enough
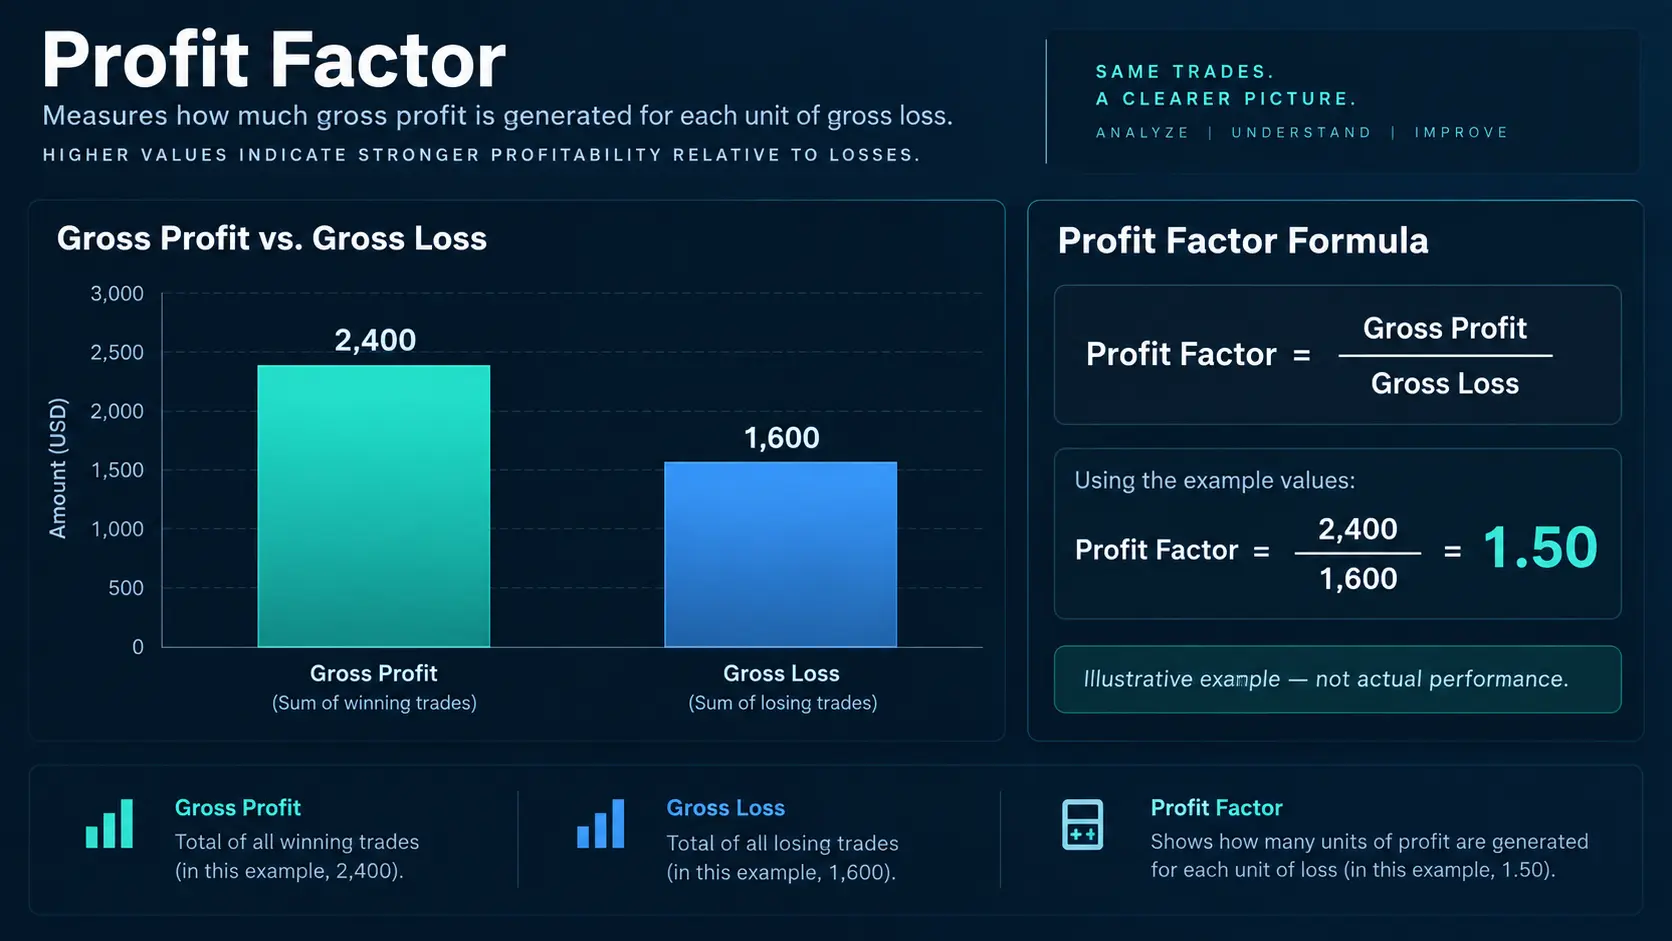
- a small sample can be dominated by a few outliers;
- gross totals do not show trade order or maximum drawdown;
- spread, commission, swap, slippage and partial fills can change gross loss;
- a strong in-sample result does not establish out-of-sample robustness.
There is no universal pass threshold for every strategy. Frequency, market, timeframe and cost model change what the same ratio means.
A reproducible calculation workflow
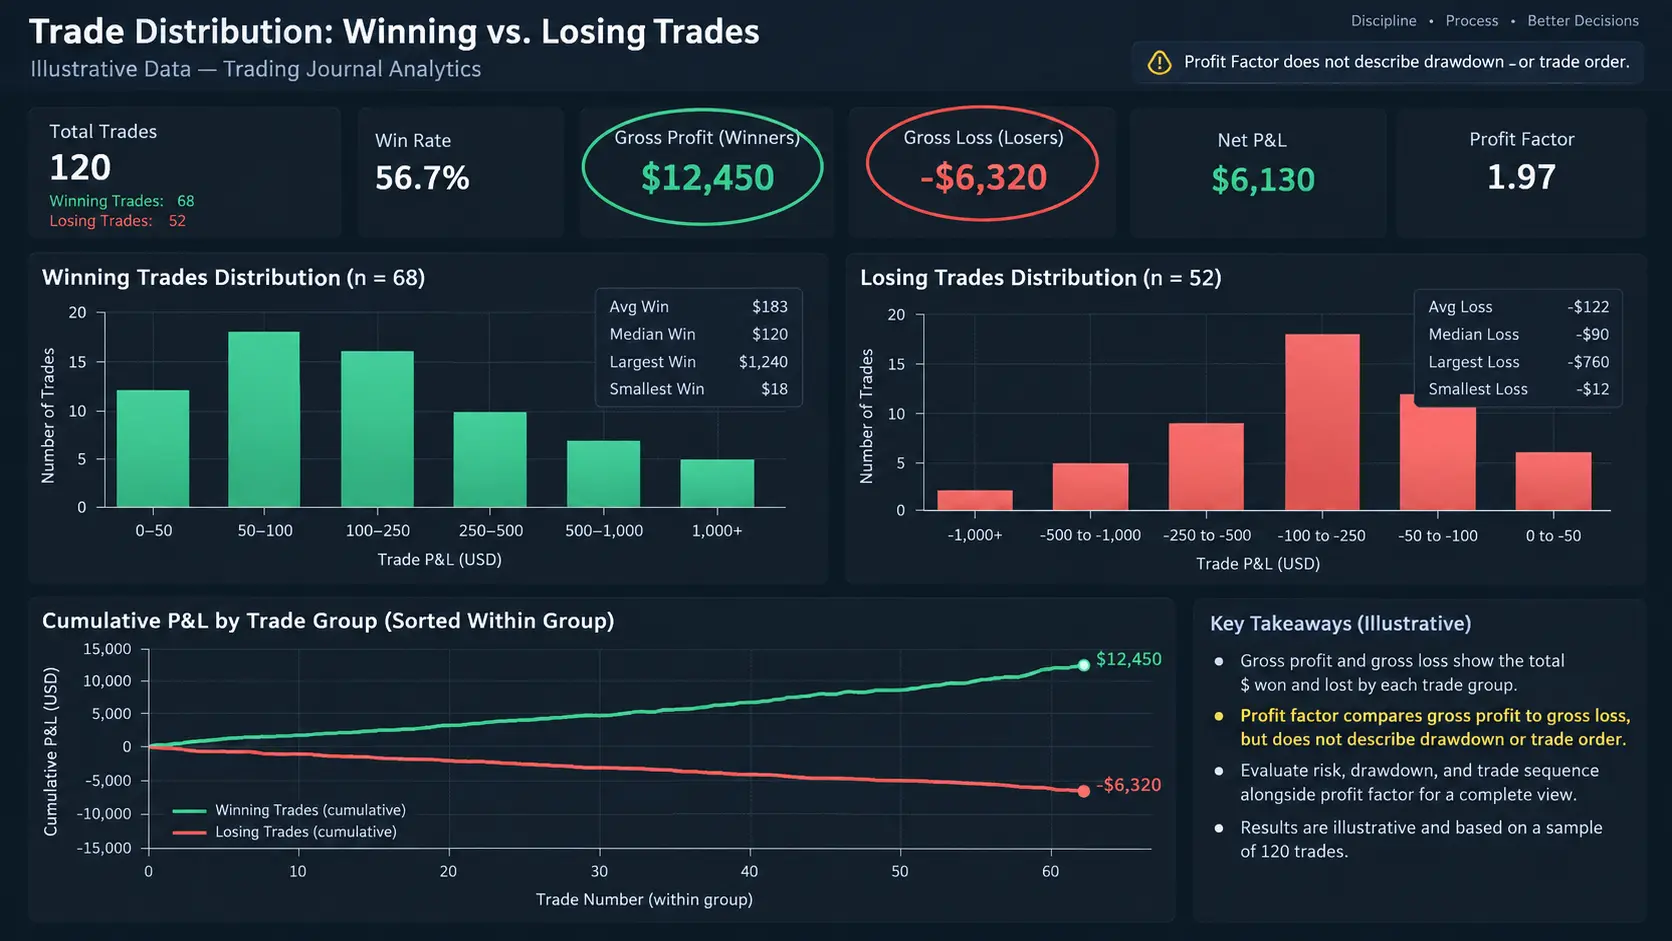
- freeze the dataset and date range before viewing results;
- separate winners, losers and costs using one documented rule;
- record Profit Factor with expectancy, maximum drawdown, MAE/MFE and trade count;
- keep development and validation samples separate and dated;
- save the calculation so it can be reproduced.
A limited numeric example
A fictional sample contains 2,400R of gross wins and −1,600R of gross losses, so PF = 1.50. Adding 400R of costs makes PF = 2,400/2,000 = 1.20. This is arithmetic for illustration, not a backtest or performance claim.
Profit Factor should be reported with context
A useful report states the period, instruments, timeframe, eligible-trade rule, sample count and whether figures are gross or net. Include commissions, spread, swaps and a stated slippage model. If one outlier contributes a large share of gross profit, show the result with and without that trade and explain why it remains in the sample.
| Metric | Question answered | Context still required |
|---|---|---|
| Profit Factor | How do gross wins compare with gross losses? | Trade count, drawdown and sequence |
| Expectancy | What is the average R per eligible trade? | Costs and regime stability |
| Sharpe/Sortino | How variable is the return series? | Distribution and sampling assumptions |
Version your research assumptions
Keep a dated record of the dataset, symbol list, signal filters, excluded trades, cost model and code or spreadsheet version. When a parameter changes, preserve the previous output instead of replacing it. This makes the metric auditable and reduces the temptation to select a favorable window after seeing the result.
Risk note: This is educational content, not investment advice. Trading can cause losses; use dated data, include costs and manage risk for your circumstances.