


A Kagi chart transforms a price series into connected vertical and horizontal lines and changes direction only after a defined reversal amount. The line becomes Yang or Yin under the chart’s rules, filtering some small moves. Because the result depends on the source price, reversal rule and timeframe, Kagi is a way to display structure—not a guaranteed signal.
Kagi Chart Structure: Lines, Yang and Yin
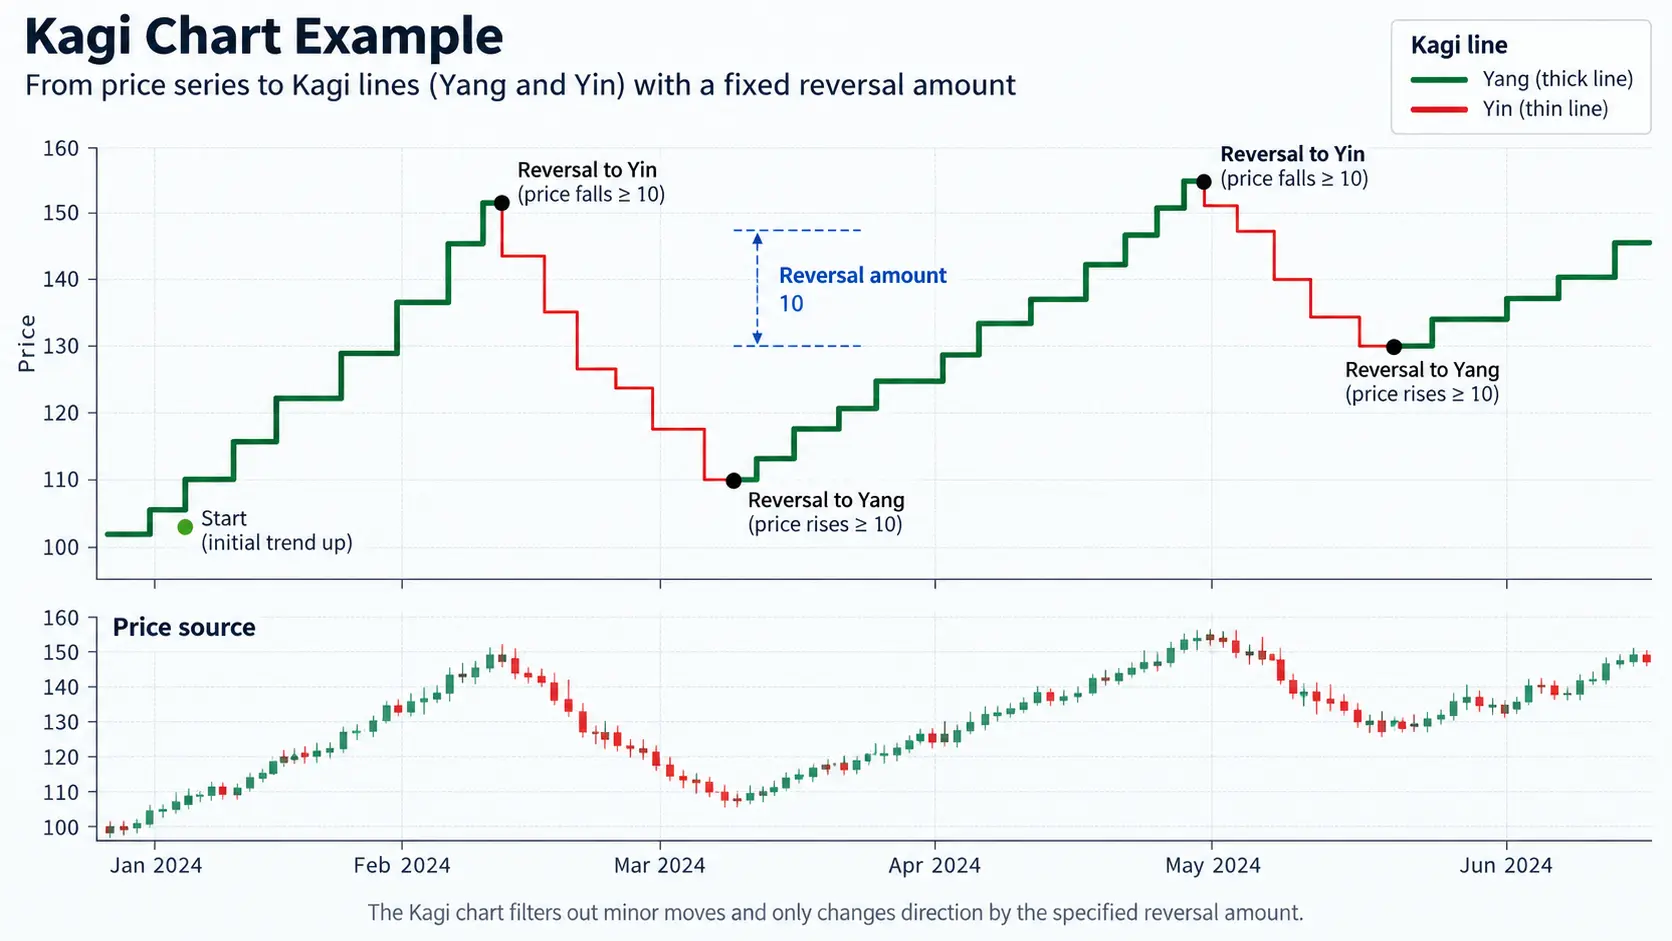
A Kagi line follows a selected price series until the move reaches the reversal threshold. The line’s thickness or color can change when it passes a prior swing, depending on the platform convention. Yang and Yin labels are descriptive states; they should not be read as automatic long or short instructions. Keep the price source—close, high/low or another setting—visible in the chart notes.
What to record
- source symbol, exchange/feed and whether the series uses close or extremes;
- reversal amount and unit: fixed points, percentage or an ATR-derived rule;
- timeframe used to build the source series and timezone;
- the rule that changes line thickness or Yin/Yang state;
- the condition that would invalidate an interpretation.
Use the candlestick guide to inspect the source bars when a Kagi move hides intrabar detail. The display removes information; it does not create new market data.
Reversal Amount: How the Filter Changes
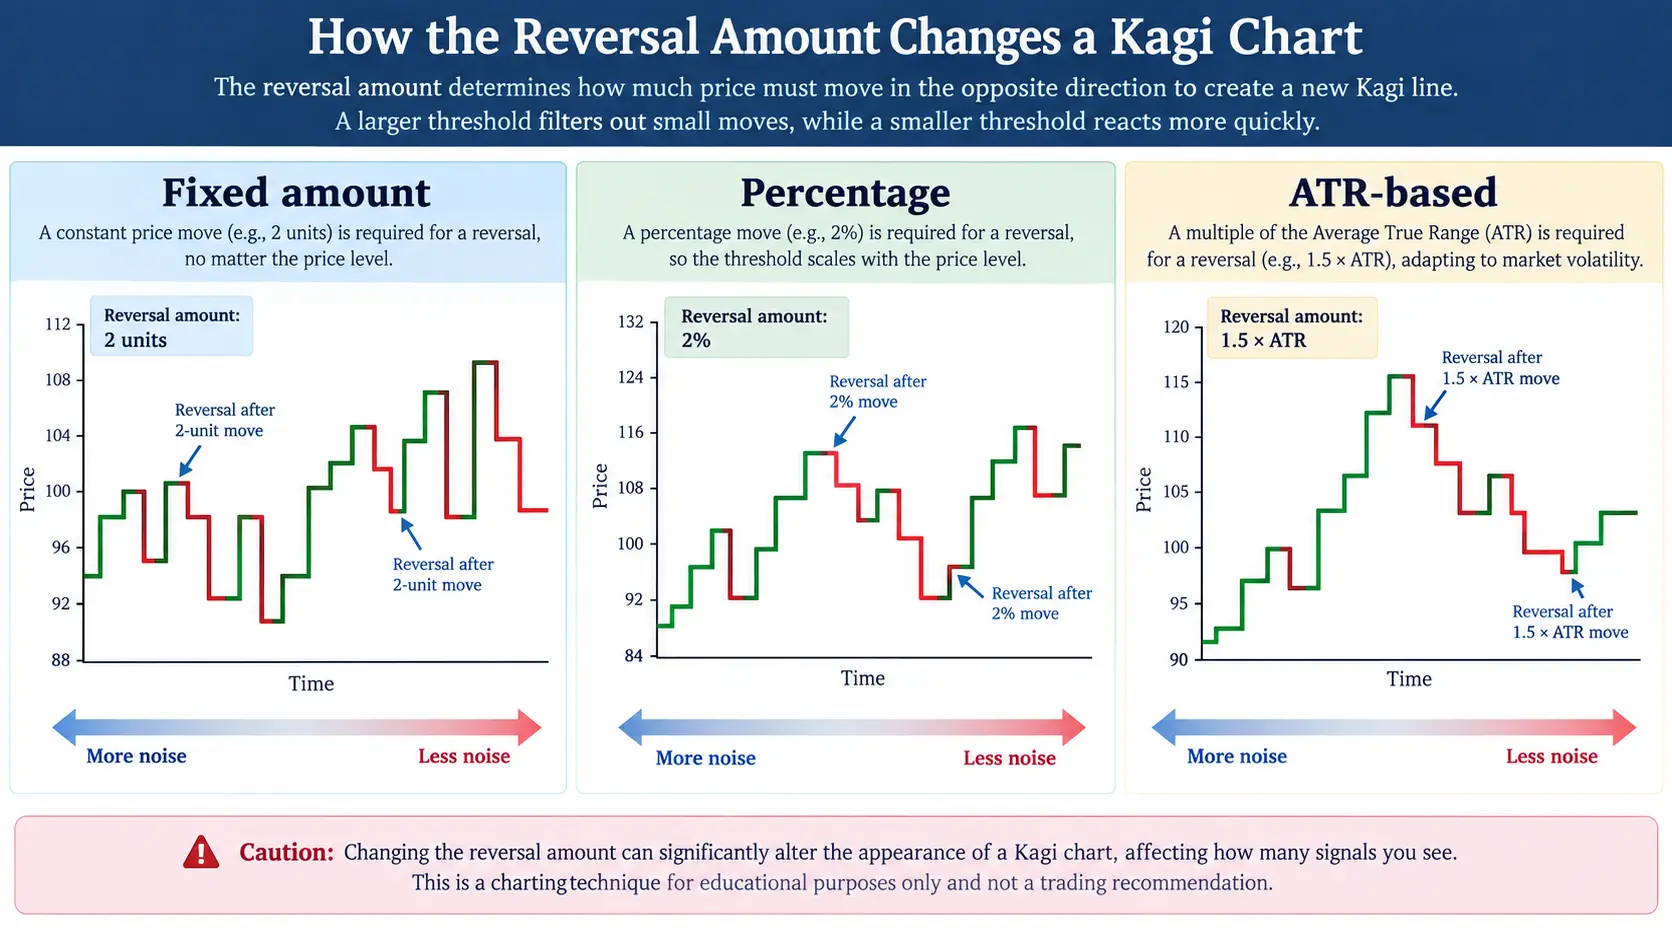
A smaller reversal amount makes the line respond to more price movement and may preserve detail while adding noise. A larger threshold filters more movement but can delay a turn. Fixed, percentage and ATR-based methods behave differently as price or volatility changes. There is no universal threshold: specify it before evaluating a sample and avoid selecting it after seeing the result.
| Choice | What changes | Limit |
|---|---|---|
| Fixed amount | Same nominal price threshold | May be too small or large as price changes |
| Percentage | Threshold scales with price | Still ignores some volatility shifts |
| ATR-based | Threshold responds to measured volatility | Depends on ATR window and data source |
Illustrative Failure: A False Reversal
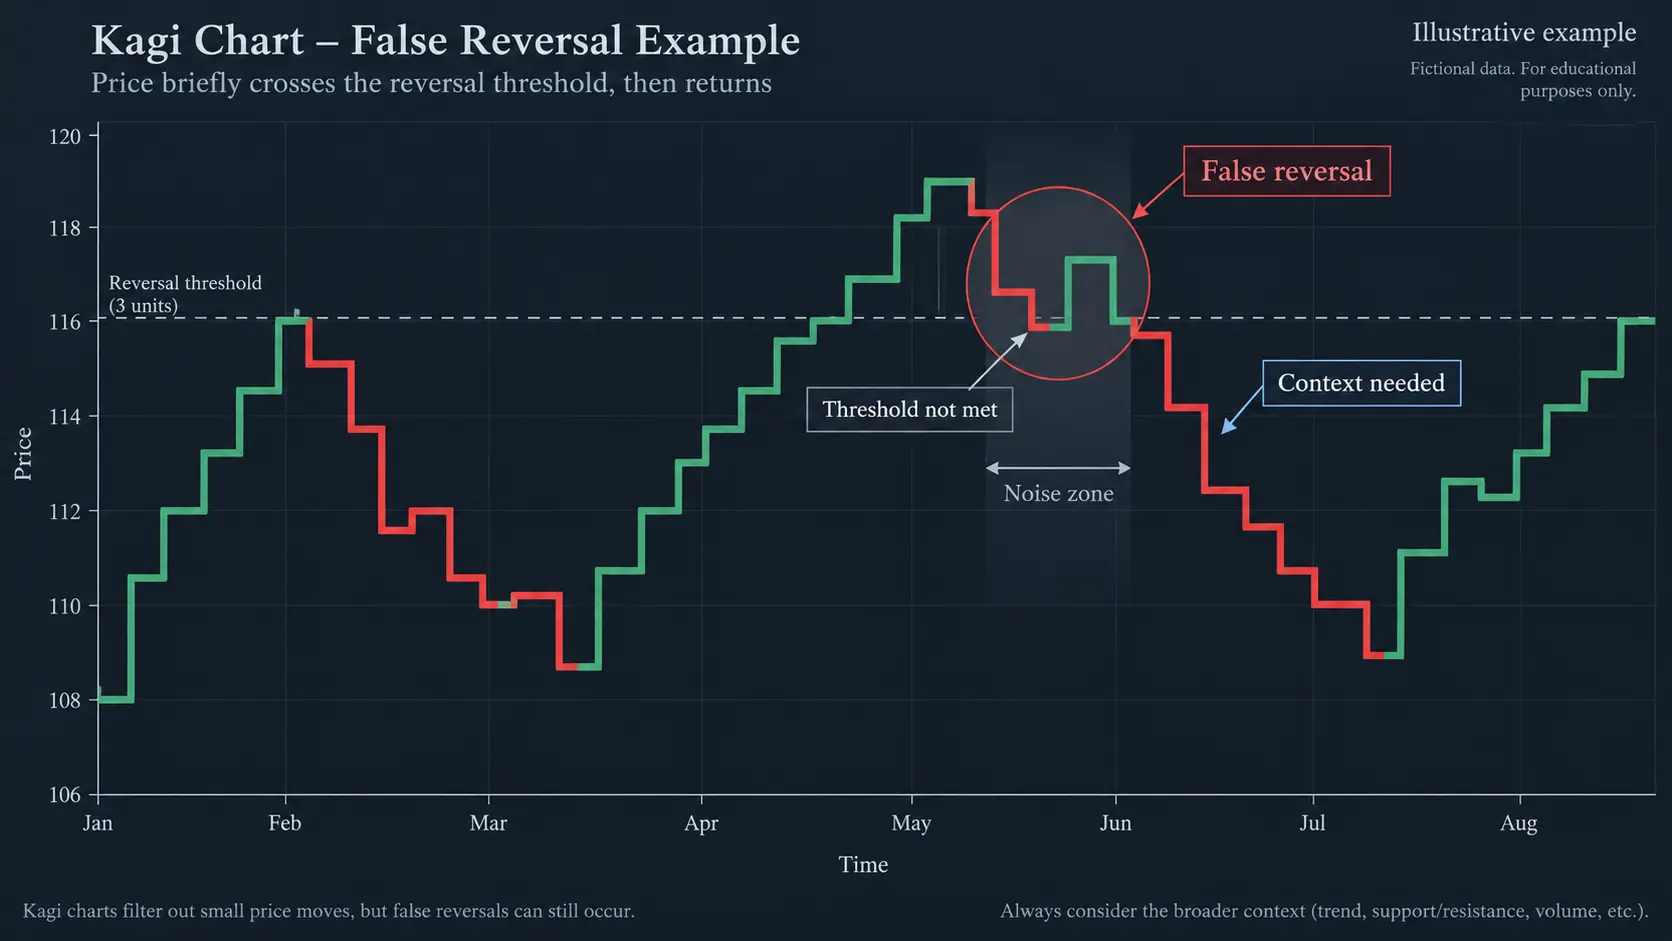
Imagine a fictional price series where a short dip appears to reverse but does not reach the selected threshold. The Kagi line remains in its prior state even though a candlestick chart shows several small bars. That is a filter outcome, not proof that the prior trend will continue. Conversely, a threshold-crossing reversal can fail if price quickly returns through the prior swing. Compare the Kagi state with structure and costs before forming a hypothesis.
The market structure guide helps identify swings that the Kagi transform may compress. It does not turn a Yin/Yang change into a probability.
A Repeatable Kagi Workflow and Data Limits
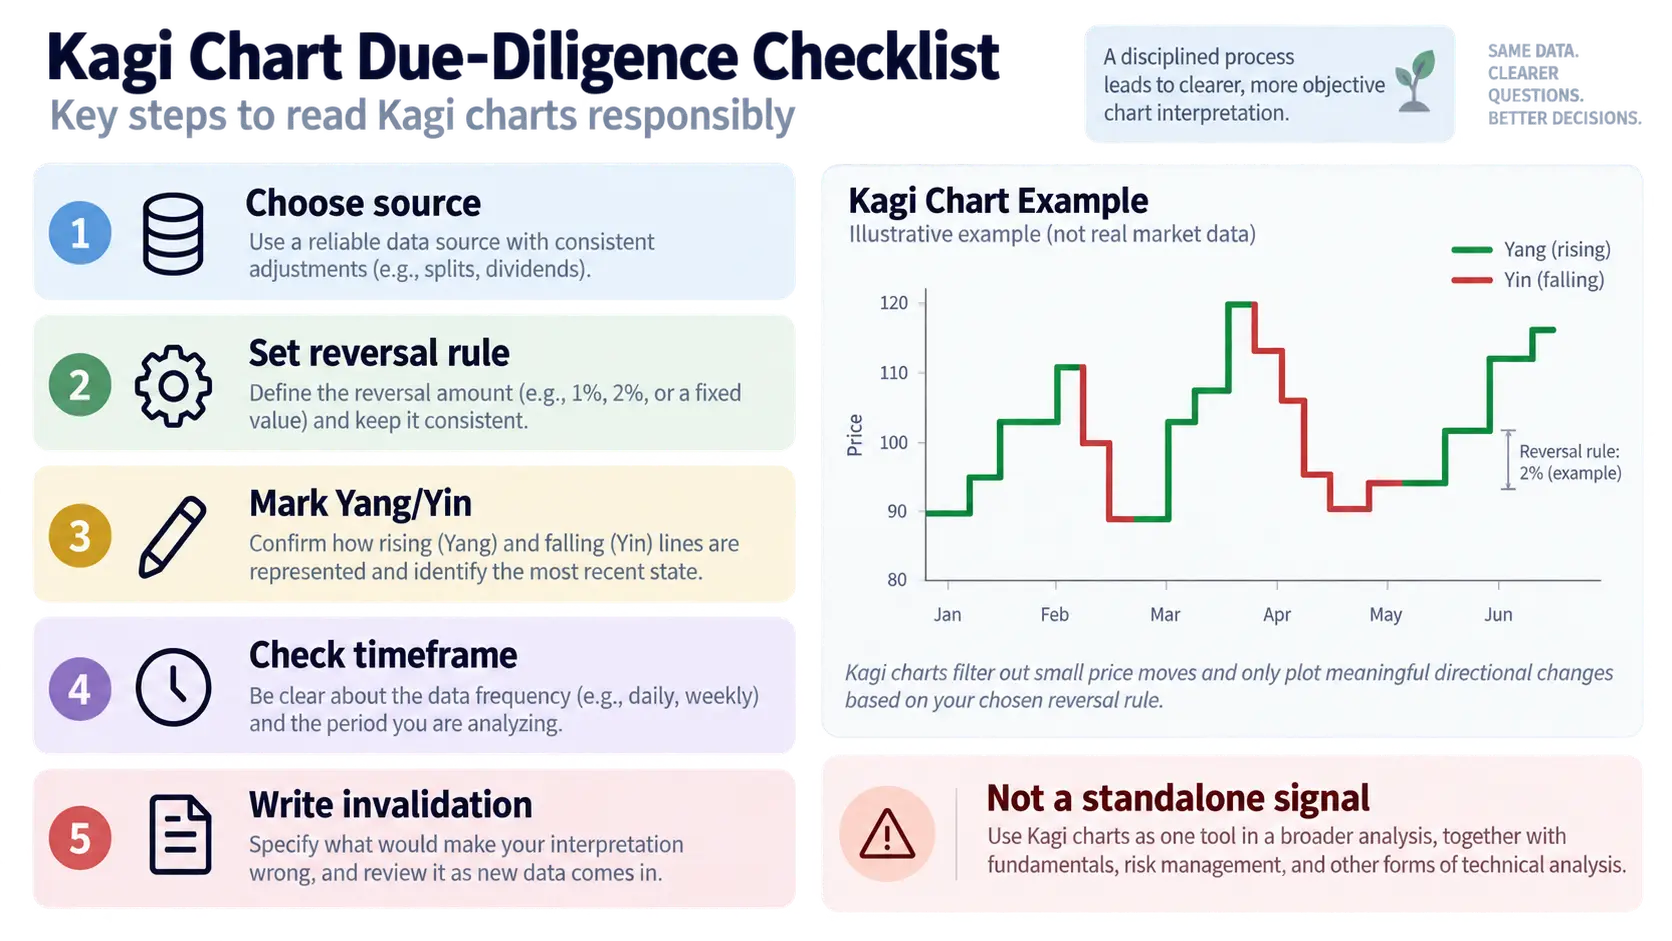
Workflow
- choose the price source and write the symbol, venue and timeframe;
- set the reversal rule before viewing later outcomes;
- mark Yang/Yin or thickness changes and the swing that caused each change;
- cross-check a reversal against the source chart, liquidity and nearby levels;
- define invalidation, costs and sample window; record false reversals rather than only successful-looking examples.
Limitations
- Kagi can hide the order and timing of intrabar moves;
- different platforms can build different lines from the same market;
- a threshold chosen on one asset may not transfer to another;
- historical chart shape is vulnerable to hindsight and parameter fitting;
- Kagi does not supply a win rate, target or risk limit.
Pair the display with risk–reward planning and a written journal. The related source reference is provided for terminology, not as proof of performance.
Key takeaways
- Kagi filters price through a stated reversal amount;
- Yang and Yin are rule-based display states;
- threshold, source and timeframe must be recorded;
- a false reversal is possible and needs an invalidation rule;
- Kagi is a charting method, not a standalone signal.
References
Risk note: This is educational content, not investment advice. Chart transformations can hide information and trading can result in losses; verify data and manage risk.