


liquidity in trading Liquidity describes the ability to transact with limited price impact; chart traders also use the word for areas where orders may cluster around visible highs and lows. These meanings are related but not identical, and candles alone do not reveal the exact quantity or owner of resting orders. The method should be treated as a testable chart-reading framework rather than a forecast. Before using it, define the market condition, confirmation event, invalidation price, transaction costs and maximum risk. This guide explains the rules, a repeatable workflow, common failure modes and the most relevant supporting concepts.
Definition: What Is Liquidity in Trading?
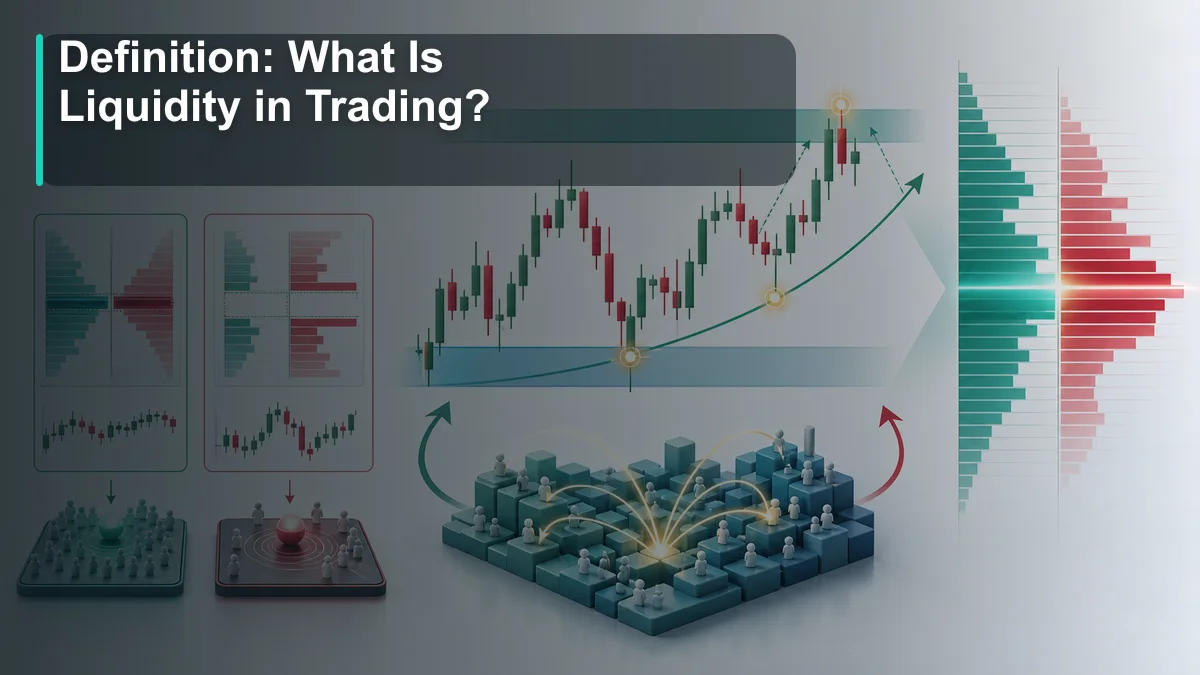
Liquidity in trading is the ability to buy or sell an asset quickly, at a fair price, and with limited price impact. A highly liquid market has many active buyers and sellers, deep order books, tight bid-ask spreads, and enough volume to absorb normal orders. A low-liquidity market has fewer participants, thinner depth, wider spreads, and a higher chance that orders move price against the trader.
Investor.gov explains liquidity as how easily or quickly a security can be bought or sold in a secondary market. That simple definition matters because execution is part of trading performance. If you buy at a poor fill or exit during a thin market, the chart setup may not matter as much as the cost of getting in and out.
The bid and ask help make liquidity visible. The bid is the highest price buyers are currently willing to pay. The ask is the lowest price sellers are currently willing to accept. The gap between them is the spread. Investor.gov describes the spread as the difference between the bid price and the ask price. In general, tighter spreads suggest better liquidity, while wider spreads suggest more friction.
Market depth is another key part. Depth shows how many orders are available near the current price. If there are many buy and sell orders at nearby levels, the market can often absorb trades more smoothly. If the order book is thin, even a modest order may push price into the next available level, causing slippage.
In chart reading, liquidity also refers to where orders may be resting. Previous highs can attract buy stops from short sellers and breakout orders from buyers. Previous lows can attract sell stops from long traders and breakdown orders from sellers. Equal highs, equal lows, session highs, session lows, range edges, and obvious swing points can become liquidity pools because many traders make decisions around them.
This is why liquidity is central to Smart Money and price action analysis. Traders do not only ask whether price is going up or down. They ask where orders may be waiting, how price reacts after reaching those orders, and whether the reaction creates a trade idea with clear invalidation.
Core Principles of Liquidity
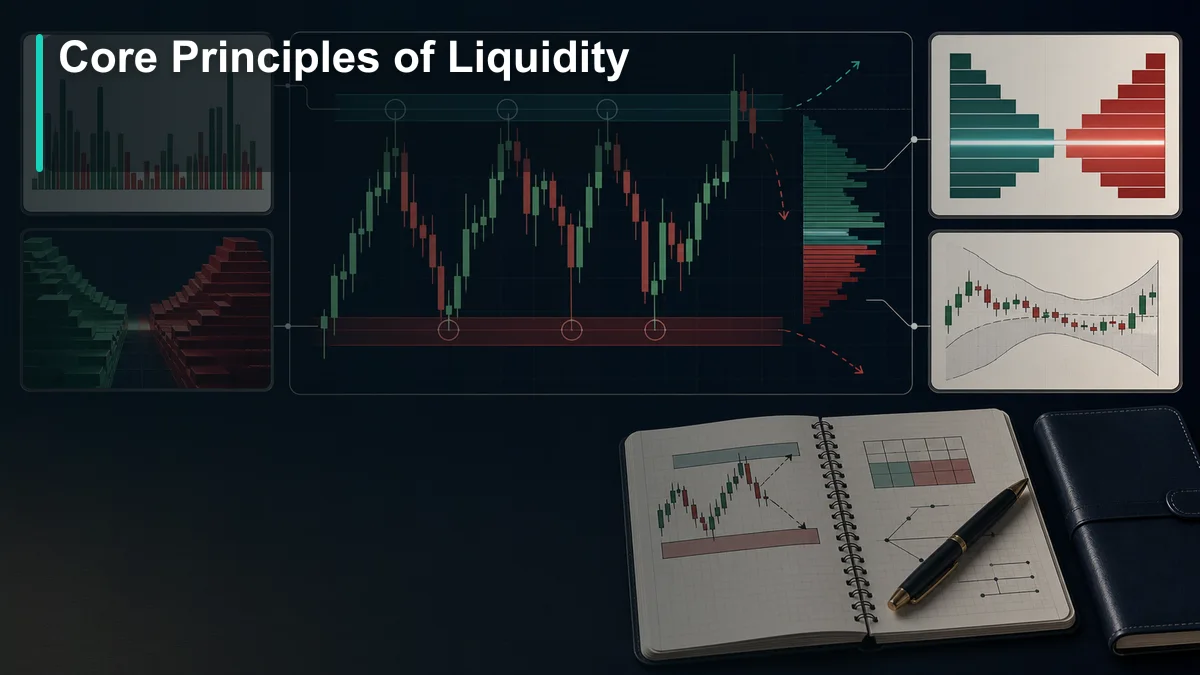
Good liquidity analysis starts with a few core principles. These principles help traders avoid treating every wick as a secret signal or every breakout as a guaranteed move.
Liquidity Depends on Participation
A market becomes more liquid when many participants are active at the same time. More buyers and sellers usually create smoother execution, tighter spreads, and more reliable fills. Major forex pairs during active sessions, heavily traded index futures, and large-cap stocks during regular market hours often have better liquidity than small-cap stocks, exotic pairs, or crypto tokens during quiet periods.
The Spread Is a Real Cost
The bid-ask spread is not just a number on a platform. It is part of the cost of trading. A trader who enters and exits frequently must overcome the spread before any profit is real. The CFA Institute notes that transaction costs include direct costs and indirect costs, and that spread, market impact, delay, and unfilled trades can all contribute to implicit trading costs.
Depth Matters More Than Volume Alone
Volume tells you how much trading has occurred. Depth tells you how much liquidity may be available near current price. A market can show high volume during a fast move but still have poor depth at the exact moment you need to enter or exit. For execution, the order book and spread often matter as much as historical volume.
Liquidity Changes With Time
Liquidity is not constant. It changes by session, news schedule, market open, market close, rollover, holidays, and unexpected events. Spreads may be tight during active hours and widen sharply during quiet sessions. A setup that is reasonable during London or New York may be weaker during a thin overnight period.
Liquidity Can Attract Price
On a chart, obvious highs and lows often act like magnets because orders collect around them. Price may move toward these pools to find enough orders for a larger participant to enter, exit, hedge, or rebalance. This does not mean price must reverse after taking liquidity. Sometimes it sweeps and reverses. Sometimes it breaks and accepts beyond the level. The reaction is the evidence.
Every Liquidity Idea Needs Invalidation
A liquidity sweep, breakout, or retest is still only a hypothesis. Before entering, the trader should know where the idea is wrong. If a bullish idea depends on a sweep below a low and a strong reclaim, then accepting back below the sweep area may weaken the idea. If a breakout idea depends on price holding above a liquidity pool, then a return inside the old range may invalidate the plan.
Key Liquidity Patterns and Models
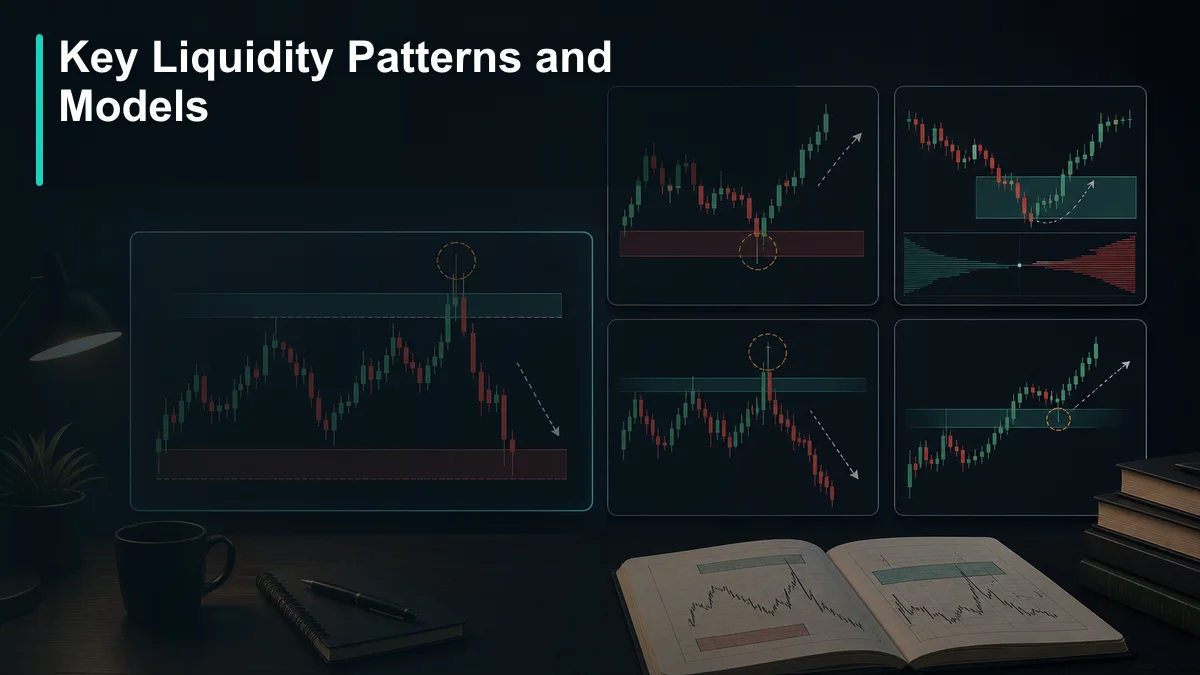
Liquidity can appear in many forms, but a few patterns show up repeatedly across forex, crypto, stocks, indices, and futures. Beginners should study these models slowly and collect examples before risking money on them.
Buy-Side and Sell-Side Liquidity
Buy-side liquidity often sits above obvious highs. It can include stop losses from short sellers and breakout buy orders from traders waiting above resistance. Sell-side liquidity often sits below obvious lows. It can include stop losses from long traders and breakout sell orders from traders waiting below support.
These areas matter because price may travel toward them before a larger move. A rally into buy-side liquidity may continue if buyers accept higher prices. It may also sweep the high and reverse if the breakout fails. A selloff into sell-side liquidity may continue if sellers accept lower prices. It may also sweep the low and reverse if selling pressure is absorbed.
Equal Highs and Equal Lows
Equal highs and equal lows are easy for many traders to see. That visibility makes them important. Equal highs can attract breakout buyers and stops from shorts. Equal lows can attract breakout sellers and stops from longs. When price pushes beyond these equal levels, the trader should watch the reaction carefully.
Liquidity Sweep
A liquidity sweep happens when price moves beyond an obvious high or low, triggers orders, and then returns back through the level. A bearish sweep may push above a previous high, fail to hold, and then break lower. A bullish sweep may push below a previous low, fail to hold, and then break higher.
The sweep itself is not enough. A wick through a level can be noise. A stronger model usually includes a sweep, quick rejection, displacement away from the level, and a clear structure shift. That sequence gives the trader more evidence than a single candle.
Breakout and Acceptance
Not every move through liquidity is a trap. Sometimes price breaks through an obvious liquidity pool and accepts beyond it. Acceptance may show as closes beyond the level, consolidation above the old resistance, a successful retest, or continued expansion with strong volume. In that case, the old liquidity pool may become a new support or resistance area.
Liquidity Void or Thin Move
A liquidity void is a fast, inefficient move through an area with limited trading. It often appears as a sharp displacement leg or a series of large candles. Price may later return to part of that move because there was not much two-way trade inside it. This concept connects with imbalance and fair value gaps inside Smart Money Concepts.
Stop Run Into Reversal Zone
A stop run becomes more meaningful when it happens at a higher-timeframe level, premium or discount area, order block, support or resistance zone, or session extreme. The stop run provides the liquidity event. The higher-timeframe level provides the location. The lower-timeframe structure shift provides the execution clue.
How to Identify Liquidity on a Chart
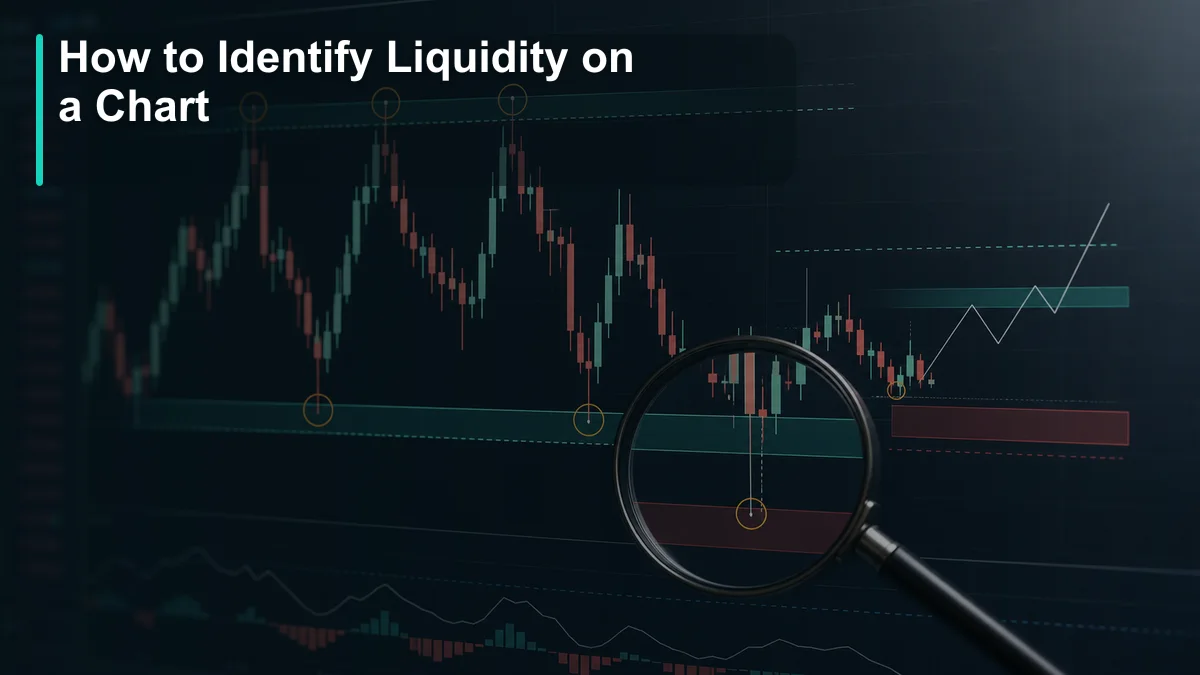
Identifying liquidity on a chart is a repeatable process. The goal is not to mark every possible level. The goal is to find the areas that are obvious enough to attract decisions from many traders.
Start With the Higher Timeframe
Begin with the timeframe that controls your trade idea. A day trader may use the daily or four-hour chart for context. A swing trader may use the weekly and daily chart. Mark the major trend, range, support, resistance, and obvious highs or lows. Liquidity on the higher timeframe usually matters more than a tiny level on the entry chart.
Mark Obvious Highs and Lows
Previous swing highs and swing lows are the simplest liquidity references. Ask where long traders may have stops, where short traders may have stops, and where breakout traders may enter. If the level is easy to see without zooming in too much, it is more likely to matter.
Look for Equal Highs and Equal Lows
Equal highs and equal lows are useful because they create a clear line in the market. Many traders treat them as breakout levels. Others place stops beyond them. When price approaches equal highs or equal lows, watch whether it breaks and accepts, or sweeps and rejects.
Use Session Highs and Session Lows
Session extremes can be important, especially for traders who study forex, indices, or intraday futures. The Asian session high, Asian session low, London high, London low, New York high, and previous day high or low can all become liquidity references. They are not automatic trade levels, but they help define where orders may collect.
Watch the Reaction, Not Only the Level
A liquidity level becomes useful only after price reacts. Does price wick through the level and reclaim it? Does it close strongly beyond the level? Does it retest and hold? Does it create displacement? Does the lower timeframe shift structure? These questions matter more than the line itself.
Separate a Sweep From a Real Breakout
A sweep usually takes liquidity and returns back through the level quickly. A real breakout usually accepts beyond the level and builds structure on the other side. Beginners often lose money because they buy the top of a sweep or sell the bottom of a sweep. Waiting for reaction and confirmation can reduce that mistake.
Liquidity analysis becomes stronger when combined with multi-timeframe analysis. A five-minute sweep means more when it happens at a four-hour level. A one-hour breakout means less if it runs directly into daily resistance.
A Liquidity Trading Workflow
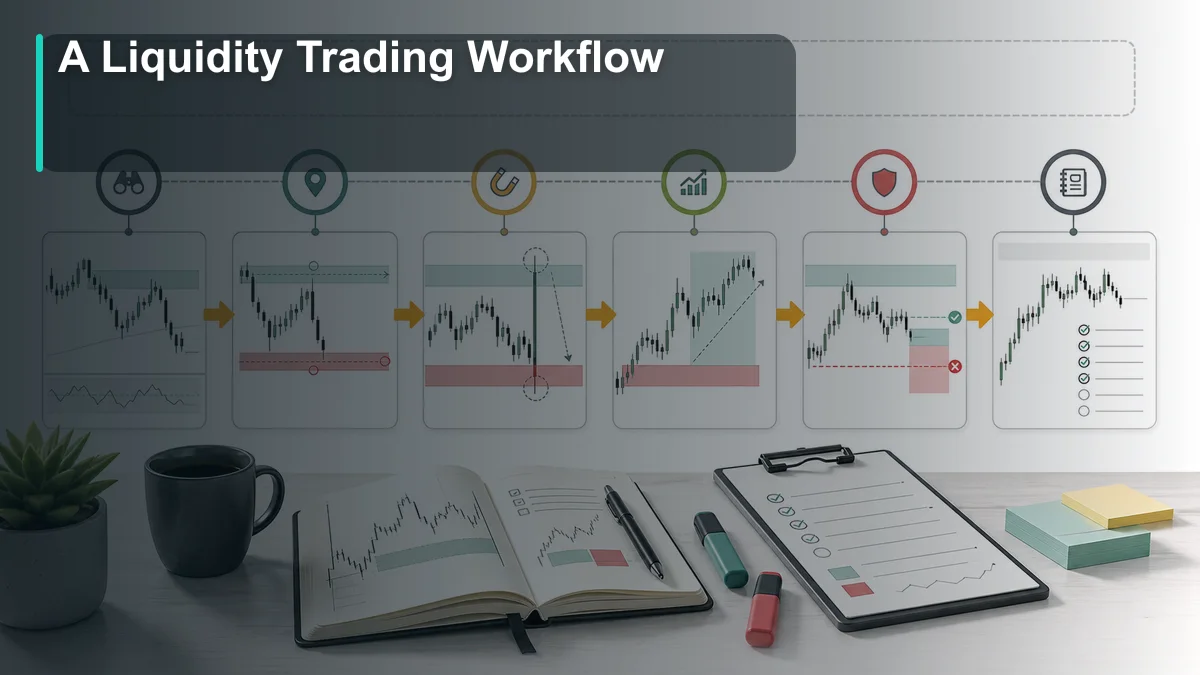
A workflow turns liquidity from an idea into a repeatable process. Without a workflow, traders often jump into every sweep, chase every breakout, or enter during thin market conditions.
Step 1: Define the Market Environment
Start by asking whether the market is trending, ranging, reversing, or transitioning. A liquidity sweep inside a range is different from a sweep inside a strong trend. A breakout in a healthy trend is different from a breakout directly into major resistance. This step connects liquidity with market structure.
Step 2: Check Current Liquidity Conditions
Before planning a trade, check spread, session, news risk, volatility, and depth if your platform provides it. Avoid assuming that a chart setup is clean when the market is thin. Liquidity is often worse around rollovers, holidays, major news releases, and quiet sessions.
Step 3: Mark the Active Liquidity Pool
Choose the liquidity that matters now. It may be a previous day high, previous day low, equal highs, equal lows, a range boundary, or a recent swing point. Do not mark ten levels and call all of them important. The active pool should be the one price is approaching or reacting from.
Step 4: Wait for Sweep, Acceptance, or Rejection
When price reaches liquidity, wait. If price sweeps and quickly rejects, a reversal model may begin to form. If price breaks and accepts, a continuation or breakout-retest model may become more logical. If price chops around the level without clear behavior, the best decision may be to stand aside.
Step 5: Confirm With Structure and Displacement
After a liquidity event, look for evidence. A bullish reversal idea may need a reclaim, displacement higher, and a break of short-term structure. A bearish reversal idea may need rejection, displacement lower, and a break of short-term structure. A continuation idea may need acceptance beyond the level and a retest that holds.
Step 6: Define Entry, Invalidation, and Target
Entry should come after context and evidence, not before. Invalidation should be placed where the liquidity idea is wrong. Target can often be the next opposing liquidity pool, such as buy-side liquidity after a bullish sweep or sell-side liquidity after a bearish sweep. Position size should be based on risk, not confidence.
Step 7: Journal the Setup
Save screenshots before and after the trade. Record the liquidity pool, market condition, spread, session, sweep or breakout behavior, structure confirmation, entry, invalidation, target, and outcome. Over time, your journal will show whether you trade liquidity with discipline or only after emotion takes over.
Examples of Liquidity in Trading
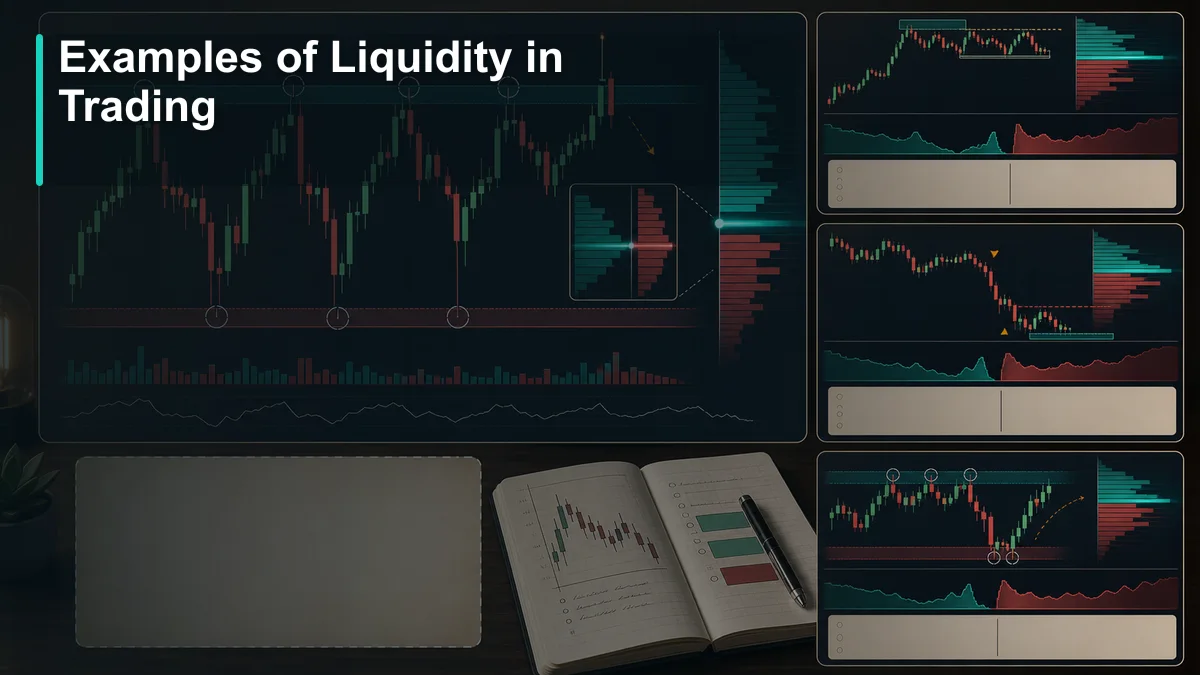
Example one: a major forex pair trades during the London and New York overlap. The spread is tight, volume is active, and price reacts cleanly around previous highs and lows. A trader can enter and exit with less friction than during a quiet session. The trade can still lose, but execution conditions are generally cleaner.
Example two: a small-cap stock opens with a large gap and limited depth. The chart may show a breakout, but the spread is wide and price jumps between levels. A market order may fill far away from the expected price. This is liquidity risk. The trader may need a smaller position, a limit order, or no trade at all.
Example three: price forms equal highs inside a range. Breakout buyers wait above the highs, while short sellers place stops above the same area. Price pushes above the equal highs, triggers buy-side liquidity, fails to hold, and then breaks back into the range with strong bearish displacement. This is a classic bearish liquidity sweep model.
Example four: price trades below a previous low during an active session, but immediately reclaims the level. On the lower timeframe, it breaks a short-term high and leaves a clean imbalance. A trader may interpret this as sell-side liquidity being swept before a bullish reaction. The idea still needs invalidation below the sweep area and a realistic target.
Example five: price breaks above a range high and holds above it. Instead of returning inside the range, it consolidates above the old high and then retests it as support. This is not a failed breakout. It is acceptance beyond liquidity. In this case, buying the first wick above the high may be risky, but a confirmed retest may offer a cleaner continuation idea.
The lesson from these examples is simple: liquidity is both an execution condition and a chart behavior concept. Tight spread and deep markets help execution. Liquidity pools help analysis. A complete trader respects both.
Related Guides and Next Learning Path

Liquidity belongs naturally inside the Smart Money hub. Smart Money traders study where liquidity sits, how price moves toward it, whether price sweeps or accepts beyond it, and how displacement changes the trade idea. If you are building a structured learning path, liquidity should come early because it explains why highs, lows, stops, and breakout zones matter.
The next internal guide to review is the Smart Money Concepts complete trading guide. That article explains the broader framework of liquidity, structure, displacement, order blocks, fair value gaps, premium and discount, and risk control.
After that, study the Market Structure complete guide. Liquidity levels are more useful when you understand the current structure. A sweep inside an uptrend, a sweep inside a range, and a sweep after a failed breakout do not all mean the same thing.
The ICT Trading complete beginner guide is also useful because ICT models often combine liquidity sweeps, market structure shifts, fair value gaps, order blocks, timing windows, and opposing liquidity targets. ICT can become complicated, but the foundation is still liquidity and structure.
For broader context, connect this guide with Price Action Trading and Multi-Timeframe Analysis. Price action helps you read behavior at the level. Multi-timeframe analysis helps you decide whether the liquidity event is meaningful or only short-term noise.
Future liquidity cluster guides can go deeper into topics such as buy-side and sell-side liquidity, liquidity sweep trading, equal highs and equal lows, stop runs versus breakouts, and liquidity and risk management. Those cluster articles should link back to this pillar so the Liquidity category has a strong internal structure.
For beginners, the best practice is to keep liquidity analysis clean. Mark the obvious pools. Watch the reaction. Confirm with structure. Respect spread and execution conditions. Define invalidation before entry. Then journal the result. Liquidity is powerful because it connects market mechanics with chart behavior, but it only becomes useful when it supports a repeatable trading process.
The liquidity sweep validation guide separates a rejected move through a level from acceptance and continuation beyond it.
Key takeaways
- Liquidity describes the ability to transact with limited price impact; chart traders also use the word for areas where orders may cluster around visible highs and lows.
- These meanings are related but not identical, and candles alone do not reveal the exact quantity or owner of resting orders.
- Separate execution liquidity from a chart hypothesis, then judge the reaction after price reaches the level.
- A valid plan separates location, trigger, invalidation, position size and exit logic.
A validation workflow you can reproduce
- Define the sample: choose the market, timeframe, session and date range before reviewing outcomes.
- Write the rule: Separate execution liquidity from a chart hypothesis, then judge the reaction after price reaches the level.
- Record invalidation: identify the observable price event that disproves the setup.
- Include execution costs: account for spread, commission and slippage where relevant.
- Validate separately: test the finished rule on data that was not used to create it.
When this concept is unreliable
Liquidity analysis fails when every breakout wick is called a sweep without a predefined level, reaction rule or alternative continuation scenario. Keep failed and skipped examples in the journal so the review is not limited to attractive winners.
Use this concept within a complete analysis
This method should remain connected to its parent framework and adjacent decision steps. Use Point of Interest in Trading: Complete Guide, Order Block Trading: How to Find High-Probability POIs and Breaker Block Trading Guide to compare definitions, establish context and avoid treating one signal as a complete trading system.
References and methodology
Terminology note: SMC, ICT and MSNR terms are practitioner conventions, not standardized exchange or regulatory definitions. This article defines the convention it uses and avoids inferring participant identity from candles alone.
Practise before considering real capital
Use historical charts or a demo account to test the written rules before considering live execution. Review the Exness account and demo information. Availability, protections and trading conditions depend on jurisdiction, so review the applicable legal documents yourself.
Affiliate disclosure: Học Làm Trader may receive a commission if you open an account through this link, at no additional cost to you. This relationship does not determine the educational conclusions.
Risk warning: This article is for education and general information only. It is not investment advice, a trade signal or an invitation to trade. Trading can result in loss of capital, and past examples do not guarantee future results. Assess your own circumstances and risk tolerance.
Related guides in this topic
Related reading: Equal Highs and Equal Lows Trading Guide