


Gann Fan trading A Gann Fan projects geometric lines from a selected price-time anchor, commonly including a 1×1 relationship between price and time units. Its appearance changes with chart scaling and anchor choice, so results cannot be compared unless those settings are fixed. The method should be treated as a testable chart-reading framework rather than a forecast. Before using it, define the market condition, confirmation event, invalidation price, transaction costs and maximum risk. This guide explains the rules, a repeatable workflow, common failure modes and the most relevant supporting concepts.
Setup Overview
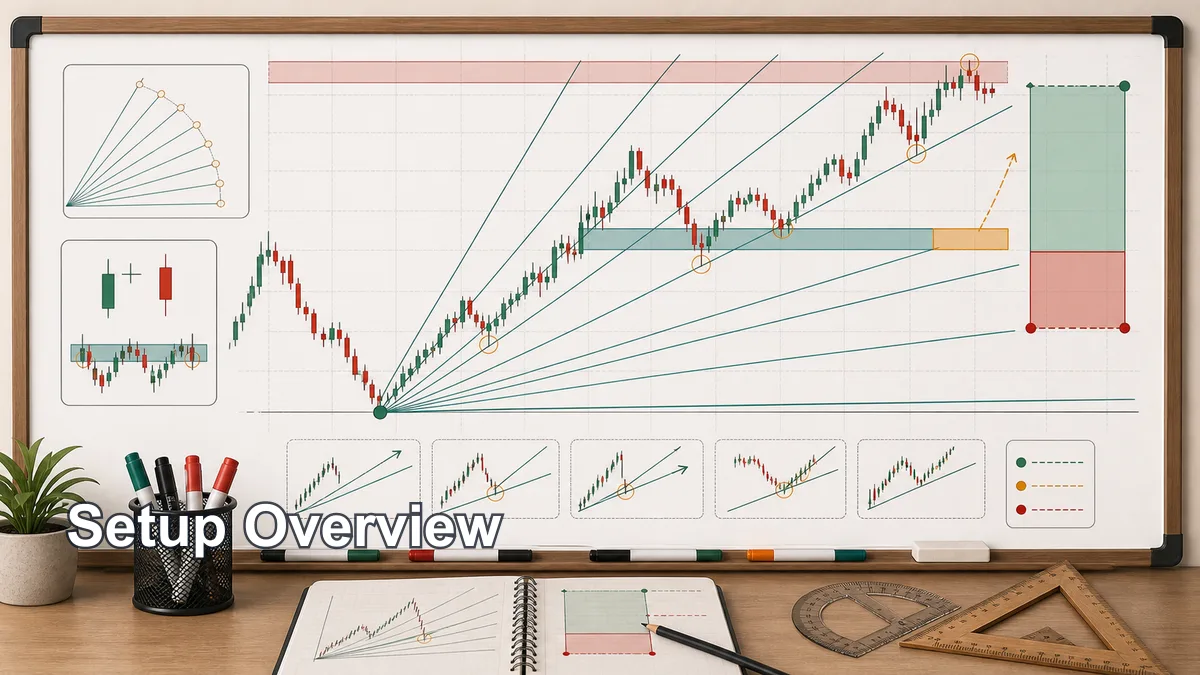
The basic setup starts with a significant swing high or swing low. In an uptrend strategy, traders usually anchor the Gann fan at an important low and project the angles upward and forward. In a downtrend strategy, they anchor the fan at an important high and project the angles downward and forward.
The most discussed Gann fan angle is the 1×1 line. In simple terms, it represents a balanced relationship between one unit of price and one unit of time. Other angles represent faster or slower rates of movement. If price stays above a rising angle, the trend rhythm may still be strong. If price loses that angle and accepts below it, the rhythm may be weakening.
The setup only makes sense if the chart scale is usable. Gann fans are more sensitive to scaling than normal trendlines. If your platform changes the visual angle when you zoom or compress the chart, the fan can become misleading. Before using the tool live, learn how your charting platform handles scale, anchor points, and angle settings.
A clean setup should include the fan, nearby horizontal support and resistance, the current market structure, and a planned invalidation level. The fan is a map, not a trade by itself. It becomes useful only when price reacts around an angle and the reaction matches the broader structure.
Market Conditions for a Gann Fan Strategy
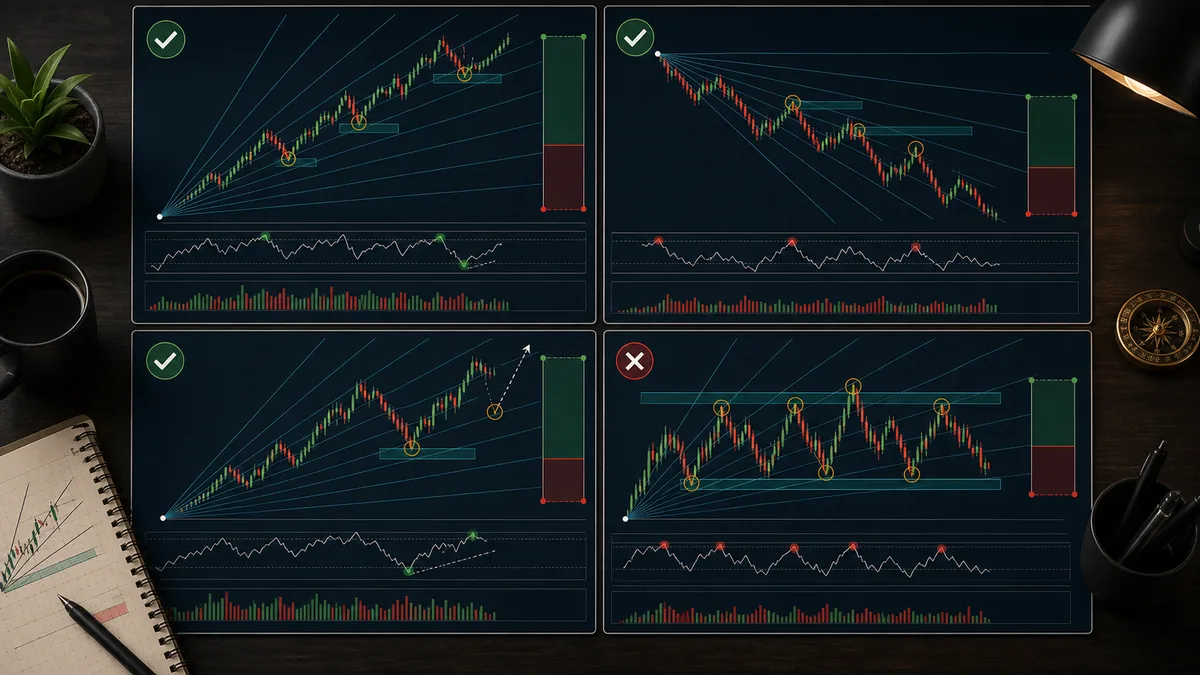
A Gann fan strategy is most useful in markets with clear directional structure. The tool is designed to study price-time rhythm, so it needs swings that actually respect rhythm. A trending market with higher highs and higher lows, or lower lows and lower highs, gives the fan something to measure.
Balanced pullbacks are also useful. If price moves away from an anchor point, pulls back toward an angle, and then reacts, the trader can judge whether the angle is acting like dynamic support or resistance. This is where the fan can connect with price action and structure.
Choppy ranges are less suitable. If price crosses every fan angle repeatedly, the tool is probably not giving useful information. A market with random spikes, low liquidity, or news-driven movement can also reduce the value of the fan. In those conditions, horizontal levels and simple risk control may be more important than geometric projections.
The best condition is alignment. The fan angle should align with a meaningful swing, the broader trend, and a level where price has reason to react. If a Gann angle overlaps with a previous high, previous low, range boundary, or pullback zone, the area becomes more interesting. Confluence does not guarantee success, but it makes the setup less arbitrary.
Entry Rules
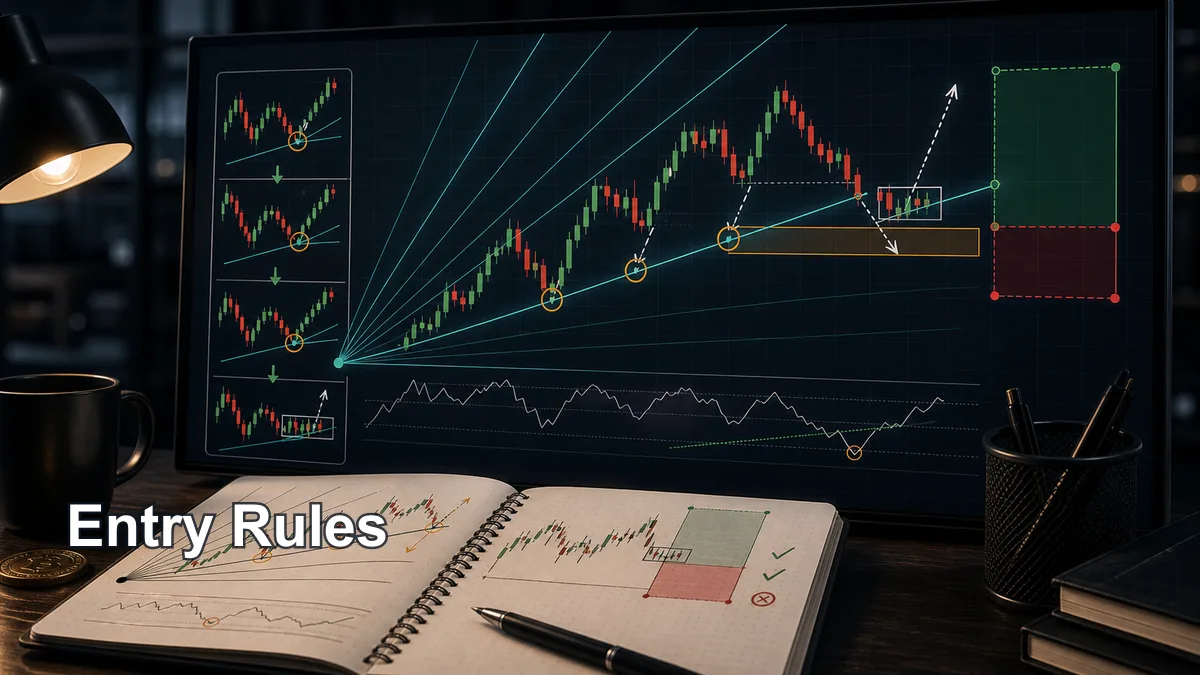
A simple bullish entry rule is to wait for price to pull back toward a rising Gann angle, reject the area, and then confirm with price action. Confirmation may be a bullish candle close, a break of a minor swing high, a failed breakdown below the angle, or a retest that holds.
A simple bearish entry rule is the reverse. Price rallies toward a falling Gann angle, rejects it, and confirms with bearish structure. The trader may look for a bearish candle close, a break of a minor swing low, a failed breakout above the angle, or a retest that cannot reclaim the angle.
Do not enter only because price touches a line. Gann angles are zones of interest, not magic barriers. Price can pierce an angle, retest it, or ignore it completely. The reaction matters more than the touch. A trader should ask: did price reject the angle, did structure shift, and is there enough room to the next target?
One practical rule is to define the trigger before price reaches the angle. For example: “If price pulls back to the 1×1 area, forms a bullish rejection, then breaks the minor high, I will consider a long.” This prevents emotional entries and keeps the strategy repeatable.
Stop Loss
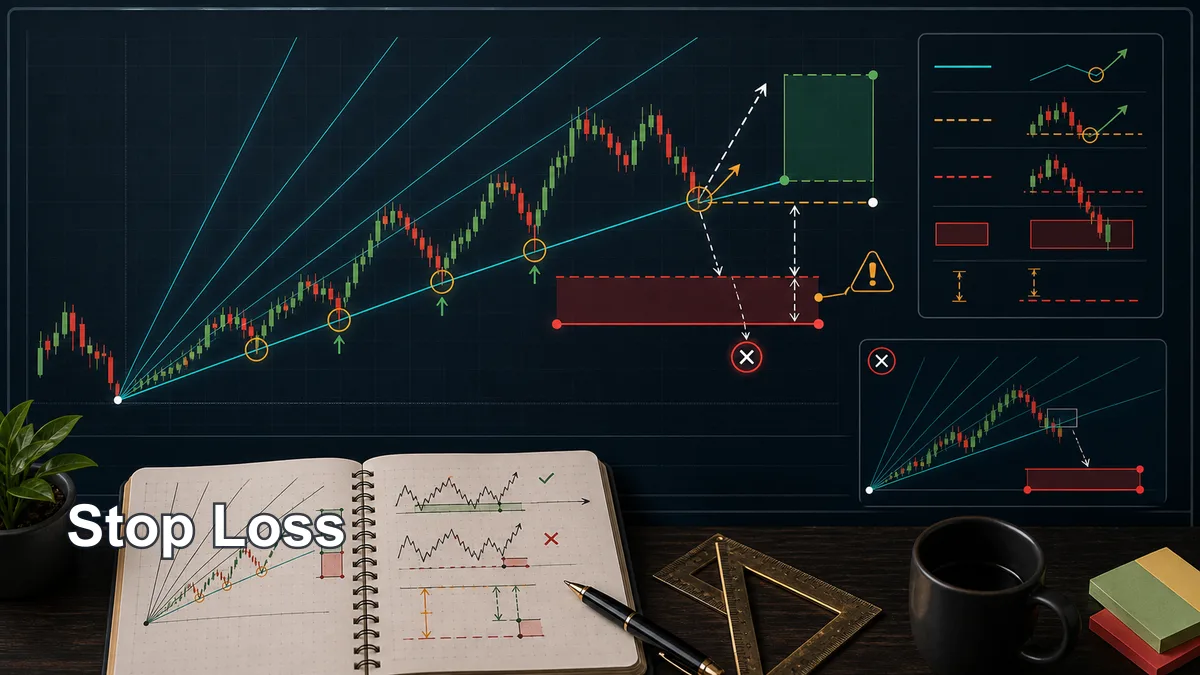
The stop loss should be based on invalidation, not on hope. If a bullish setup depends on price holding a rising angle and a nearby swing low, the stop should usually be beyond that swing structure. If price accepts below the angle and breaks the swing, the reason for the trade may no longer exist.
For a bearish setup, the stop is often placed beyond the reaction high or beyond the angle that price should not reclaim. If sellers are supposed to defend a falling angle, a strong close back above that angle may weaken the idea. The stop should reflect that logic.
Leave room for normal volatility. A stop placed exactly on the angle can be vulnerable to a small wick. A better plan often uses the angle as context and the actual swing point as invalidation. The buffer depends on the market, timeframe, spread, and volatility.
Order type matters. A stop order can become a market order after the stop price is reached, and execution can differ in fast markets. This is why the trader should understand the available order types, position size, and possible slippage before using any strategy live.
Take Profit
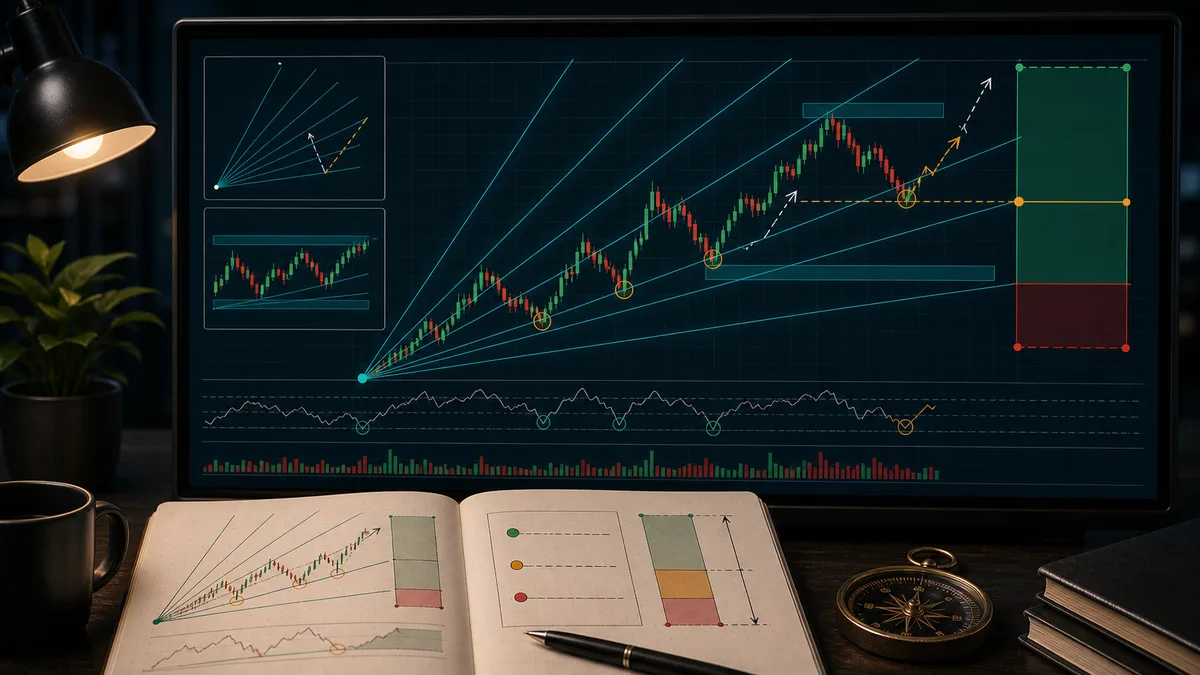
Take profit can be planned in several ways. The first method is to target the next meaningful Gann angle. If price bounces from one rising angle, the next higher angle may become a reaction area. In a downtrend, the next lower angle may become the next target zone.
The second method is to use horizontal structure. Previous highs, previous lows, range boundaries, and higher-timeframe support or resistance often matter more than diagonal geometry. If a Gann angle target sits beyond a major resistance level, the trader should not ignore the resistance.
The third method is reward-to-risk. Before entry, calculate whether the target gives enough room compared with the stop. A clean-looking angle bounce may still be a poor trade if the next obstacle is too close. The chart can be correct and the trade can still be unattractive.
Some traders scale out. They may take partial profit at a nearby structure level and hold the rest toward the next angle. Others use a trailing method based on swings or angle breaks. The important point is consistency. Choose the exit logic before entry so the trade is managed by plan, not emotion.
Confirmation Checklist
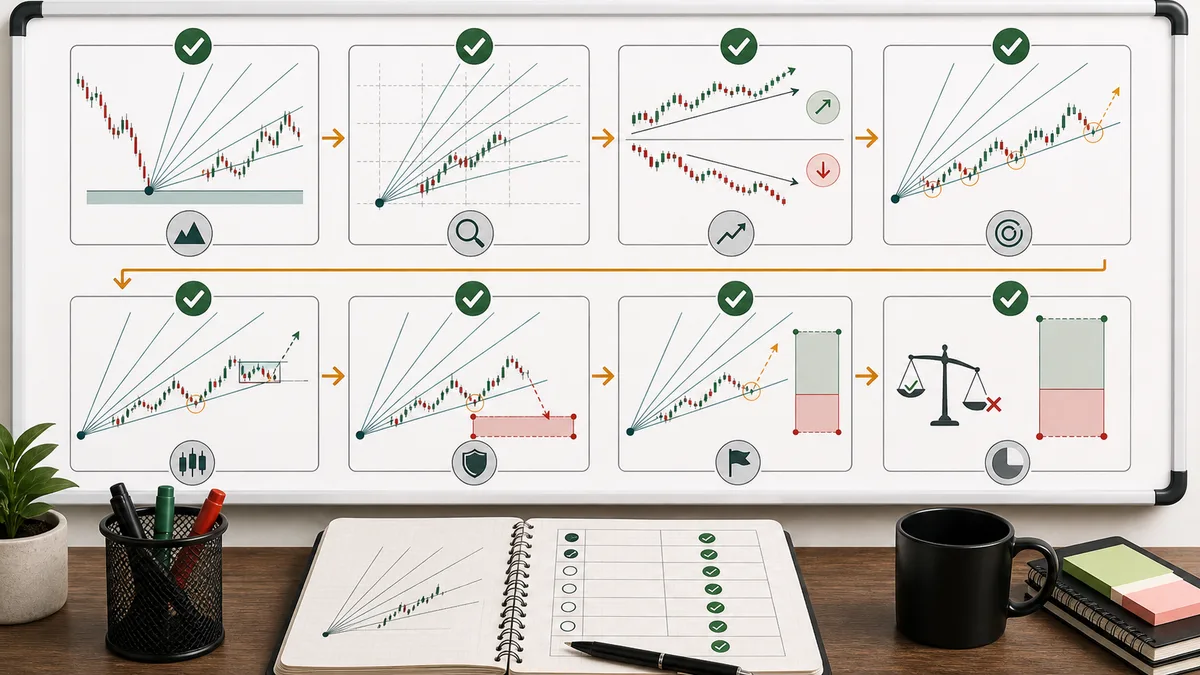
Use a checklist before taking a Gann fan trade. First, is the anchor point meaningful? A random candle high or low can create a random fan. The anchor should be an obvious swing, reversal point, breakout origin, or higher-timeframe decision area.
Second, is the chart scale usable? If the fan shifts dramatically when you zoom, be careful. Third, is the market trending or at least moving with clear swings? A choppy market that cuts through every angle is a weak environment for this method.
Fourth, is price reacting at the angle? A touch is not enough. Look for rejection, close behavior, a retest, or a structure shift. Fifth, is there confluence with horizontal support, resistance, liquidity, or a previous swing? Sixth, is invalidation clear?
Seventh, is there enough target space? A trade into immediate resistance or support may not be worth it. Eighth, is the position size appropriate? A strategy can be logically built and still fail. Risk control is the part that keeps a failed idea from becoming a damaging mistake.
Example Trade
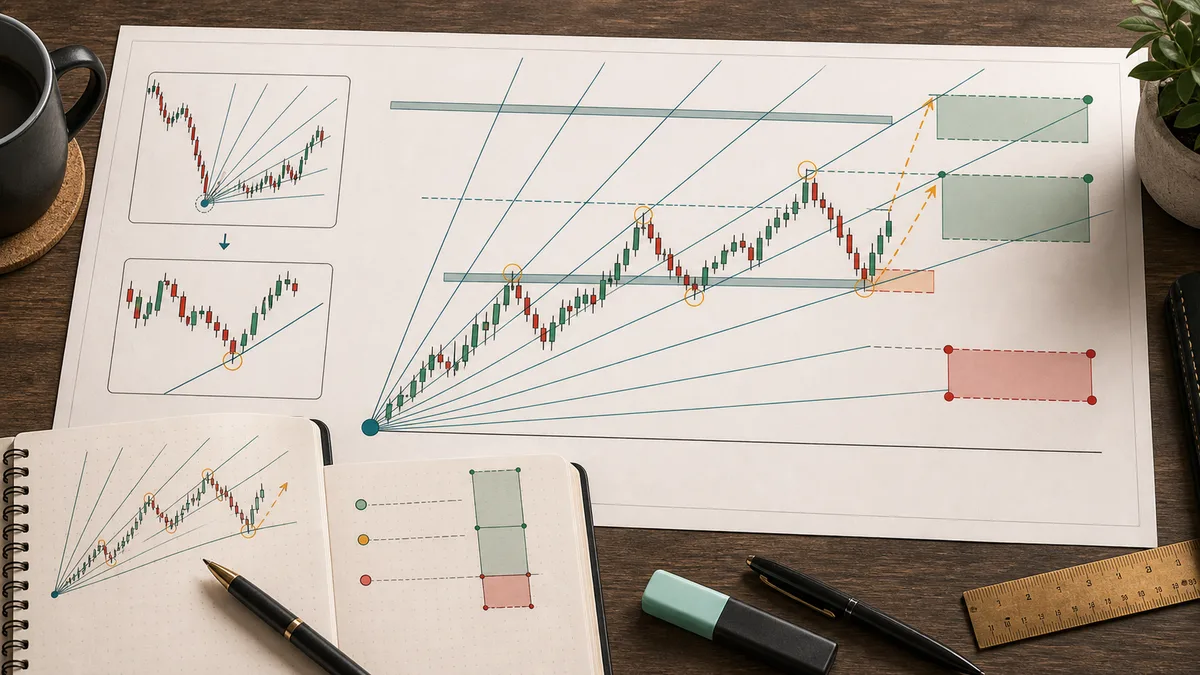
Imagine a market is in a higher-timeframe uptrend. Price makes a strong swing low, rallies, and then begins a controlled pullback. The trader anchors the Gann fan at the swing low and notices that the pullback is approaching a rising angle that also overlaps with a previous resistance-turned-support area.
The trader does not enter on the first touch. Instead, they wait. Price wicks below the angle, closes back above it, and then breaks a minor lower-timeframe high. That reaction gives a possible trigger. The stop is placed below the pullback low because a break there would mean the angle reaction failed.
The first target is the previous swing high. The second target is a higher fan angle or projected resistance area. If the distance to the first target is too small compared with the stop, the trade is skipped. If the reward-to-risk is acceptable, the trader can execute according to the plan.
The same logic works in reverse for a bearish setup. Anchor the fan from a significant swing high, wait for price to rally into a falling angle, confirm rejection, place invalidation above the failed reaction, and target the next support or lower angle. The structure matters more than the label.
Mistakes
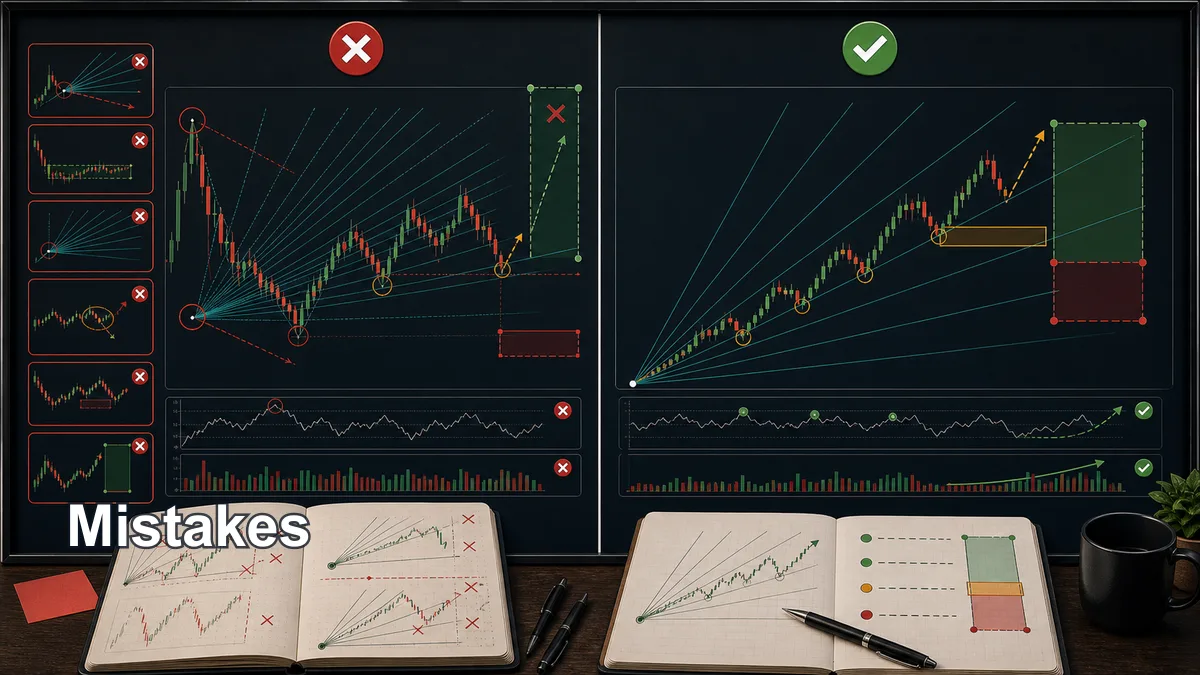
The first mistake is using the wrong anchor. If the fan begins from an unimportant point, the projected angles may be meaningless. Anchor quality is the foundation of the strategy.
The second mistake is ignoring scale. A Gann fan is not the same as a casual diagonal trendline. If the platform scale is distorted, the angle can look useful while saying very little about price-time balance.
The third mistake is drawing too many fans. A chart covered with angles from every swing high and low becomes impossible to read. Start with one major anchor and one main question. Add complexity only after testing shows it helps.
The fourth mistake is entering on touch alone. A line touch without reaction is not confirmation. The fifth mistake is placing stops too tightly on the angle. Price often wicks around diagonal levels. Use structure and volatility, not just the line.
The sixth mistake is treating Gann as forecasting magic. The fan is a planning tool. It helps you organize support, resistance, rhythm, and risk. It does not remove uncertainty. A good Gann fan trading strategy is boring in the best way: clear anchor, clear condition, clear trigger, clear invalidation, clear target, and honest review after the trade.
Key takeaways
- A Gann Fan projects geometric lines from a selected price-time anchor, commonly including a 1×1 relationship between price and time units.
- Its appearance changes with chart scaling and anchor choice, so results cannot be compared unless those settings are fixed.
- Document scale, units and anchor rules before drawing the fan and require price confirmation at an angle.
- A valid plan separates location, trigger, invalidation, position size and exit logic.
A validation workflow you can reproduce
- Define the sample: choose the market, timeframe, session and date range before reviewing outcomes.
- Write the rule: Document scale, units and anchor rules before drawing the fan and require price confirmation at an angle.
- Record invalidation: identify the observable price event that disproves the setup.
- Include execution costs: account for spread, commission and slippage where relevant.
- Validate separately: test the finished rule on data that was not used to create it.
When this concept is unreliable
The Gann Fan is unreliable when auto-scaling changes its geometry or anchors are moved to fit a completed move. Keep failed and skipped examples in the journal so the review is not limited to attractive winners.
Use this concept within a complete analysis
This method should remain connected to its parent framework and adjacent decision steps. Use Trading Theories: Complete Guide to Technical Analysis Frameworks, Wyckoff Method: Complete Beginner Guide, Elliott Wave Impulse Waves Explained, Gann Theory: Complete Beginner Guide, Wyckoff Accumulation Explained and Elliott Wave Theory: Rules, 5–3 Structure and Limits to compare definitions, establish context and avoid treating one signal as a complete trading system.
References and methodology
Practise before considering real capital
Use historical charts or a demo account to test the written rules before considering live execution. Review the XM account and demo information. Availability, protections and trading conditions depend on jurisdiction, so review the applicable legal documents yourself.
Affiliate disclosure: Học Làm Trader may receive a commission if you open an account through this link, at no additional cost to you. This relationship does not determine the educational conclusions.
Risk warning: This article is for education and general information only. It is not investment advice, a trade signal or an invitation to trade. Trading can result in loss of capital, and past examples do not guarantee future results. Assess your own circumstances and risk tolerance.
Related reading: Gann Box Trading Guide