


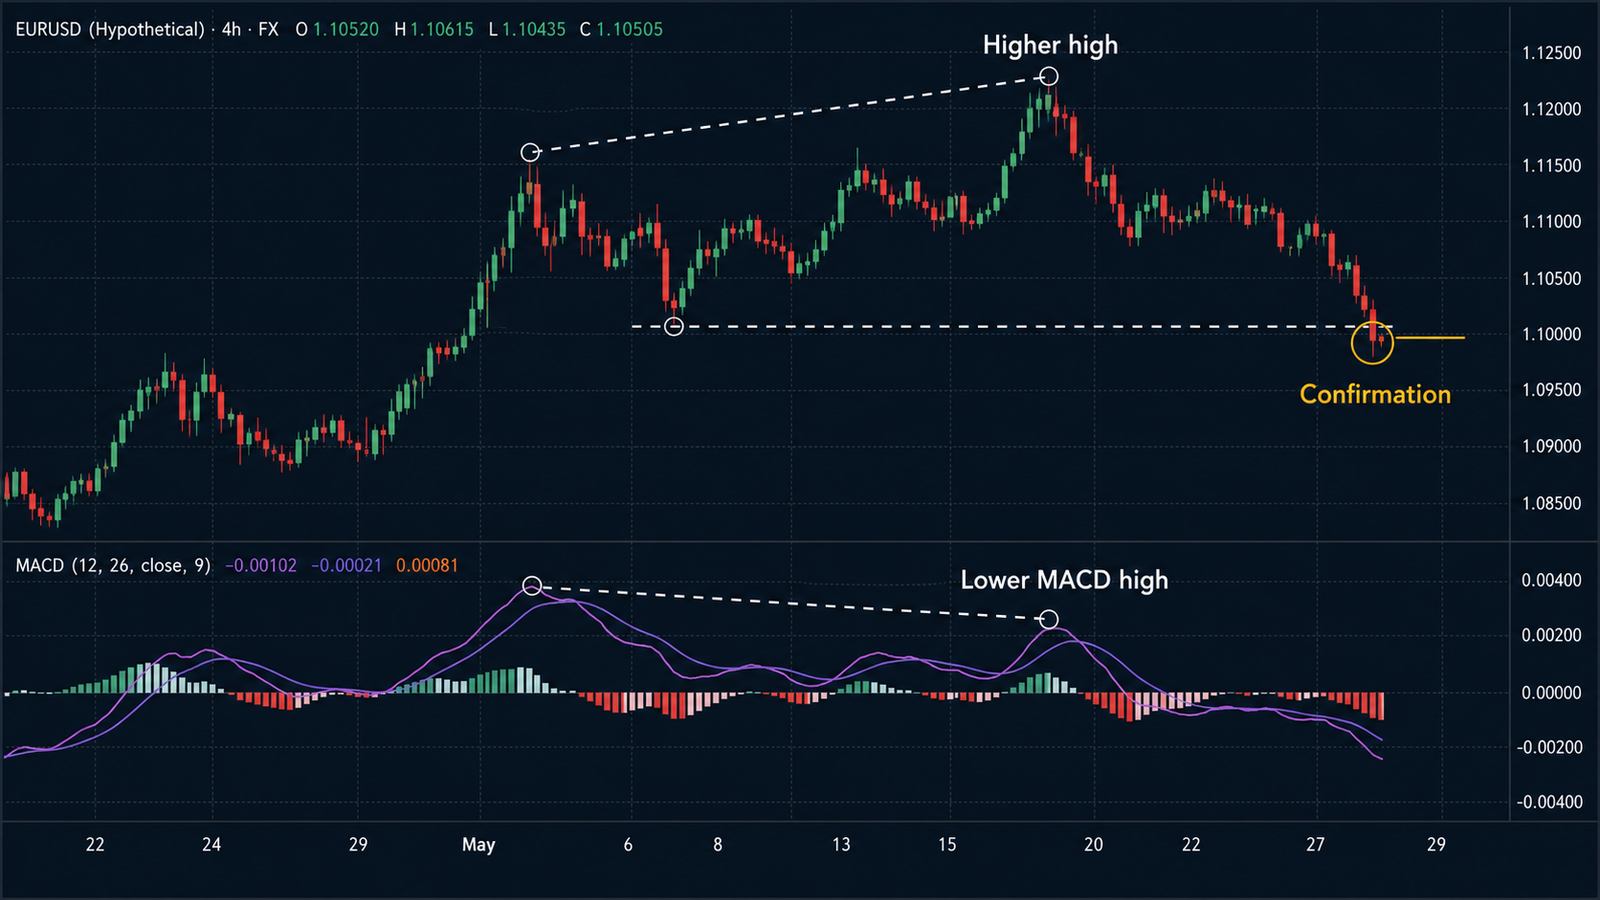
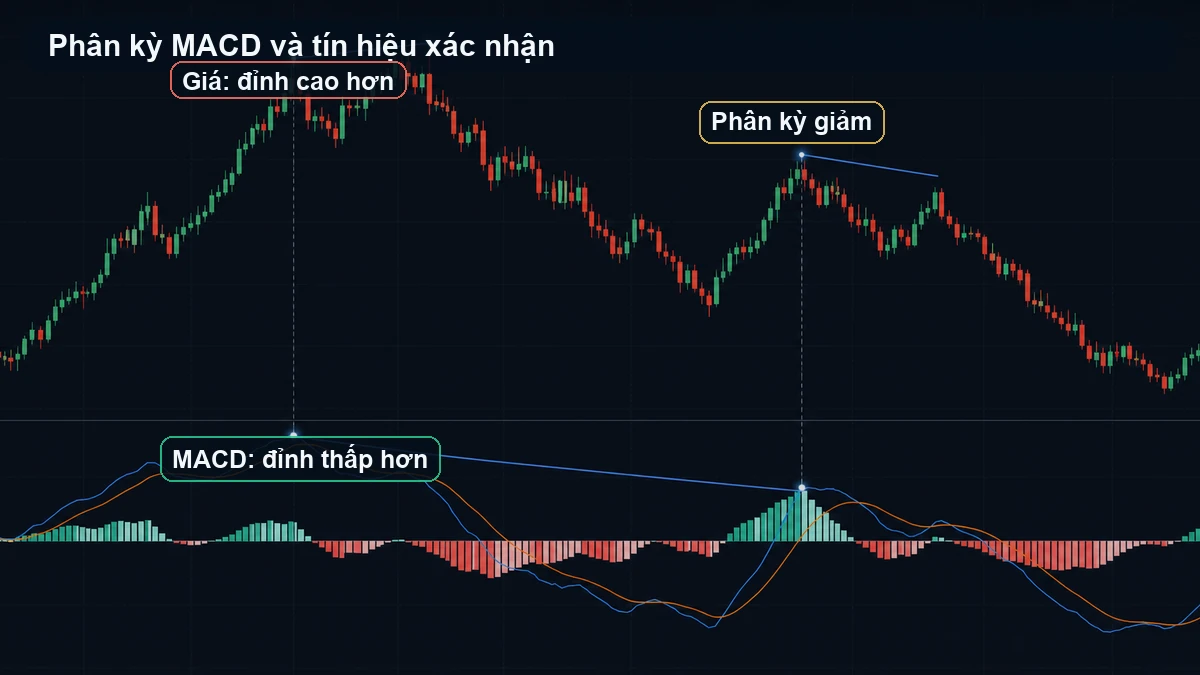
MACD divergence appears when price and the MACD oscillator form conflicting swing directions. A bearish example can show price making a higher high while MACD makes a lower high. Divergence is an alert about momentum, not an automatic reversal signal. Confirmation should come from a written price or structure rule, with risk defined before entry.
What regular divergence actually says
Regular bearish divergence suggests that the second price high is not matched by the oscillator’s momentum. It does not identify the exact turning point, and it can remain visible while price continues trending. Hidden divergence has a different interpretation and should not be mixed into the same test.
A confirmation-first workflow
- Define the swing rule and compare like-for-like highs or lows.
- Check the broader trend and the nearest support or resistance.
- Mark the divergence before looking at the future candles.
- Wait for a specified trigger, such as a close below the intervening swing low.
- Set invalidation above the structural high and calculate size from the stop.
- Record whether the signal occurred during an event or abnormal spread.
Hypothetical example
Price prints a higher high while the MACD line prints a lower high. The divergence alone is an observation. If price later closes below the intervening swing low, a bearish confirmation rule may be met. If price instead holds above the swing and prints another high, the divergence has not “failed” as an observation; it simply did not provide a timely reversal.
Common mistakes
- Comparing unmatched swings or changing the oscillator settings for each chart.
- Entering as soon as divergence appears without a trigger.
- Ignoring trend strength and treating every divergence as a reversal.
- Counting histogram colour changes as a separate confirmation without testing it.
- Using a tiny stop inside normal oscillator and price noise.
How to backtest it responsibly
Keep settings, timeframe, market and confirmation rule fixed. Separate in-sample from out-of-sample data, include missed fills and report drawdown as well as win rate. MACD is calculated from historical prices, so it cannot remove market uncertainty.
Continue learning: the Smart Money Concepts hub, ICT market structure, the Fair Value Gap guide, liquidity sweeps, trading tools and the English learning hub.
FAQ
Which MACD settings are best?
The standard 12, 26 and 9 settings are a starting convention, not a universal optimum. Test any change on data not used to choose it.
Is divergence stronger on higher timeframes?
It may be less noisy, but signals are less frequent and stops can be wider. The timeframe must match your plan and sample.
Can divergence be used alone?
It can be studied alone as a hypothesis, but a complete trading plan still needs context, entry, invalidation and risk rules.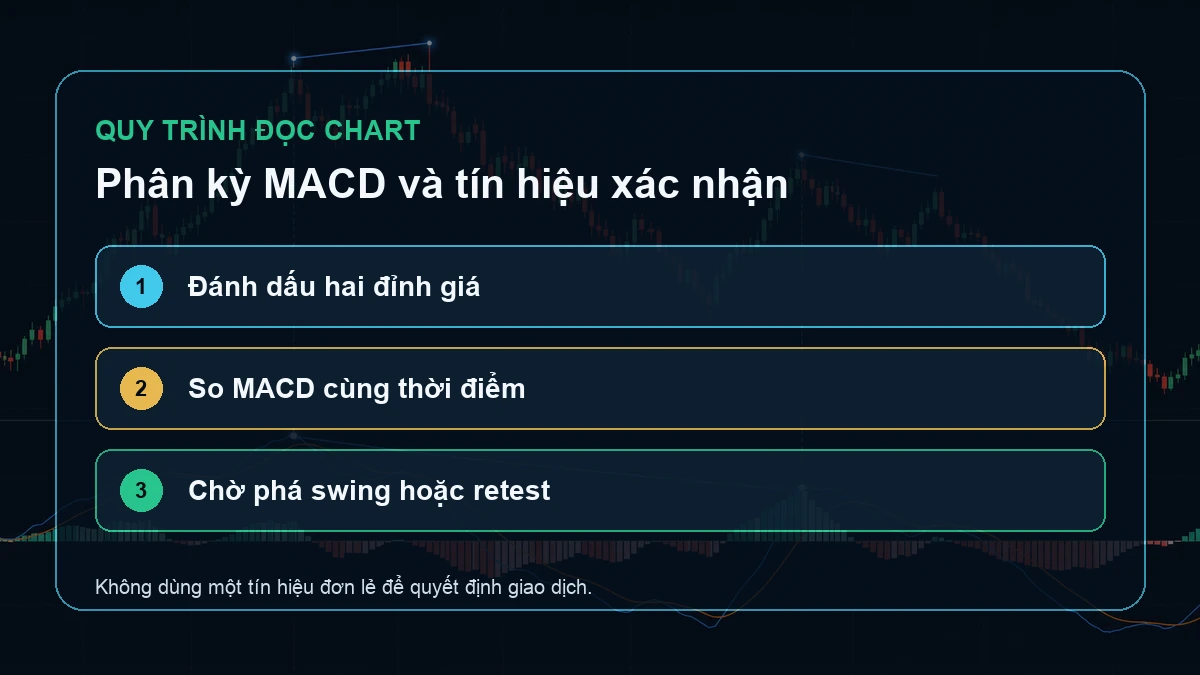
Sources and further reading
- CFTC customer advisory on retail Forex risks
- CME Group technical-analysis education
- TradingView Help Center
Risk notice: This article is for education only. It is not investment advice, a trading signal or an invitation to trade. Trading can result in the loss of capital. Examples are hypothetical and past results do not guarantee future results.