


MSS in SMC (Market Structure Shift) is not every break of a high or low. The useful definition is a change in how price forms swings, usually supported by displacement and a meaningful close. This guide puts MSS beside BOS and CHOCH so you can label the event consistently instead of turning an early clue into a reversal promise.
The worked example uses EURUSD H1 and tick volume. Volume is broker-dependent and is not a stand-alone confirmation.
What BOS, CHOCH and MSS are each trying to answer
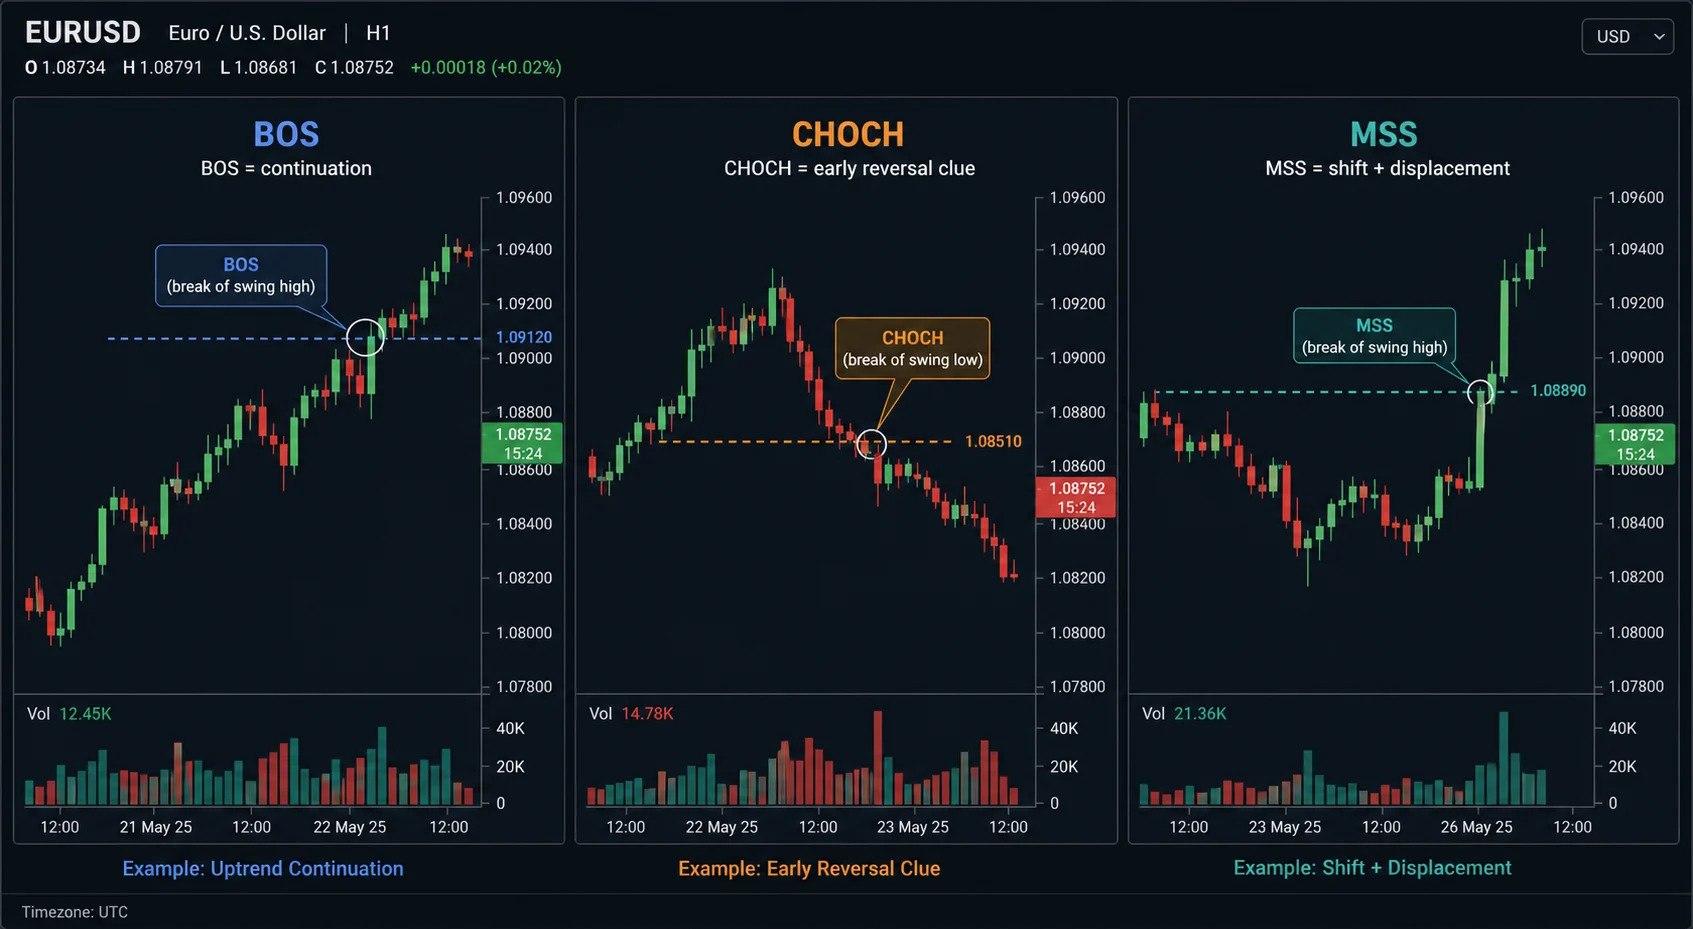
BOS asks whether the active trend is continuing. CHOCH is an early warning that the opposing leg has broken a meaningful swing. MSS sets a higher bar: price breaks a protected swing with displacement and then holds the area on a retest. A CHOCH can therefore appear before an MSS, while a BOS usually points in the direction of the existing structure.
Confirmation condition table
| Signal | Context | Swing broken | Useful confirmation | Main failure mode |
|---|---|---|---|---|
| BOS | Trend continuation | Trend-side high or low | Close beyond the level; next leg does not reclaim it | Calling BOS on a wick |
| CHOCH | Opposing leg appears | Nearest protected swing | Close through the swing plus higher-timeframe context | Range noise masquerading as reversal |
| MSS | Structure changes state | Protected swing with displacement | Close, outsized candle/volume and a holding retest | Chasing before the retest |
A price, time and volume example
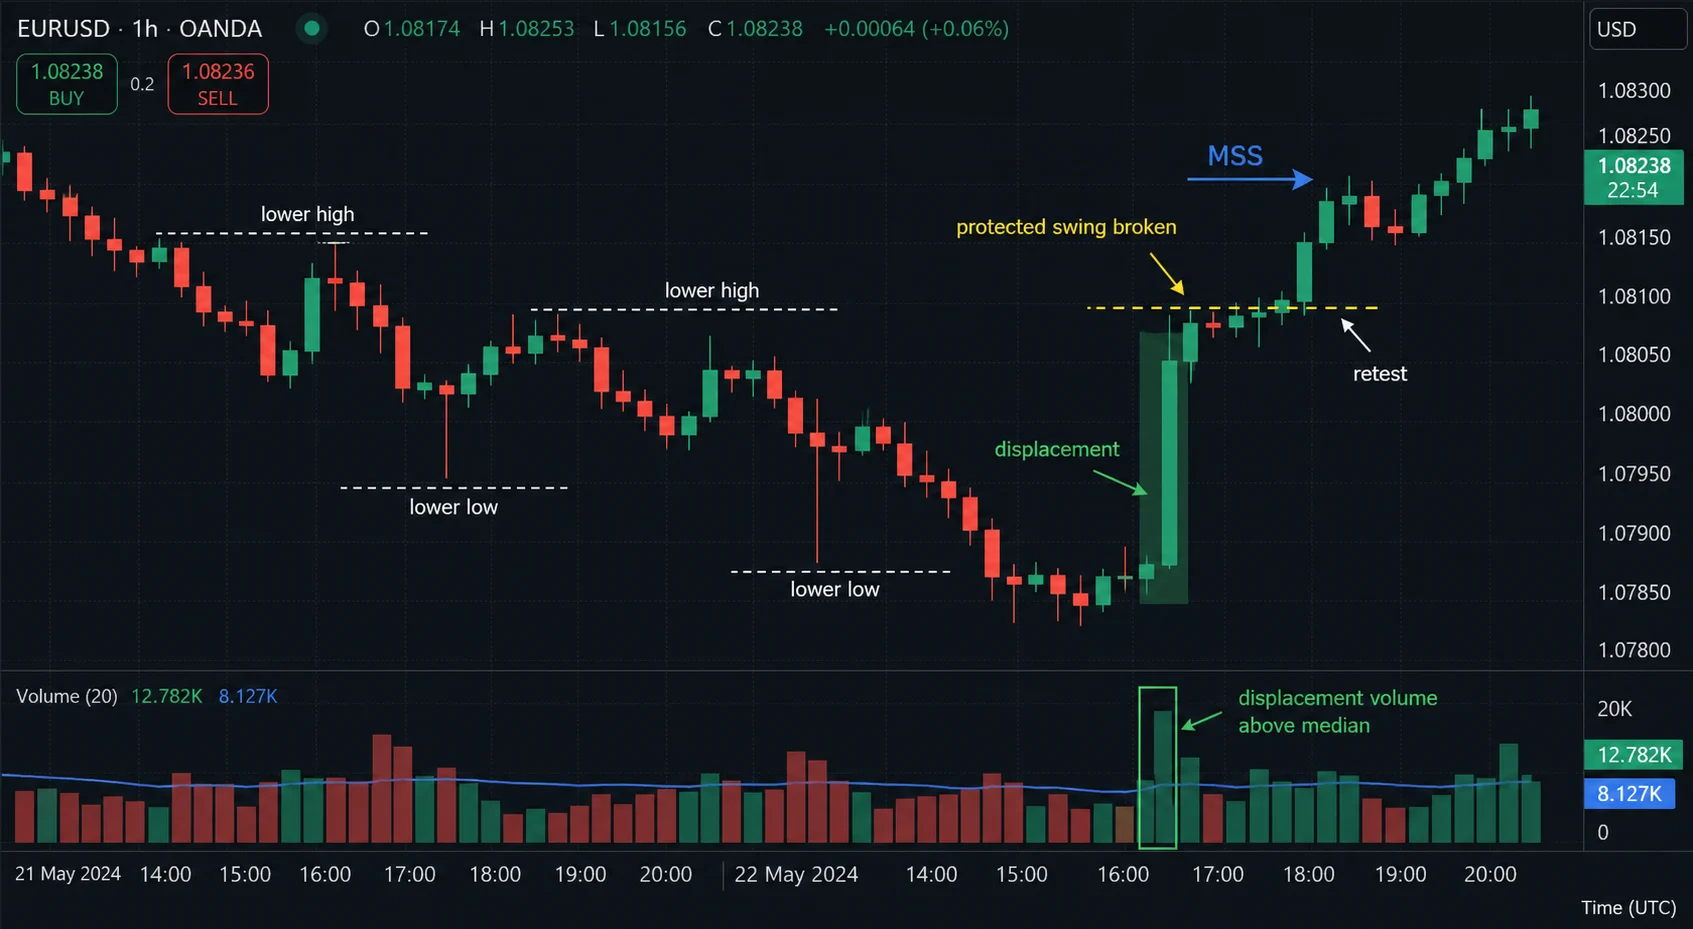
On 22 May 2024, EURUSD H1 was printing lower highs and lower lows. The protected swing sat at 1.0810. The 16:00 UTC candle closed at 1.0823 with an 18-pip body; tick volume was 12.78K versus a 20-bar median of 8.13K. The 17:00 candle retested 1.0810 and closed back above 1.0814. That is a bullish MSS candidate because close, displacement and a holding retest align. A wick above 1.0810 followed by a close below it is only a sweep/CHOCH clue.
A five-step anti-mislabel process
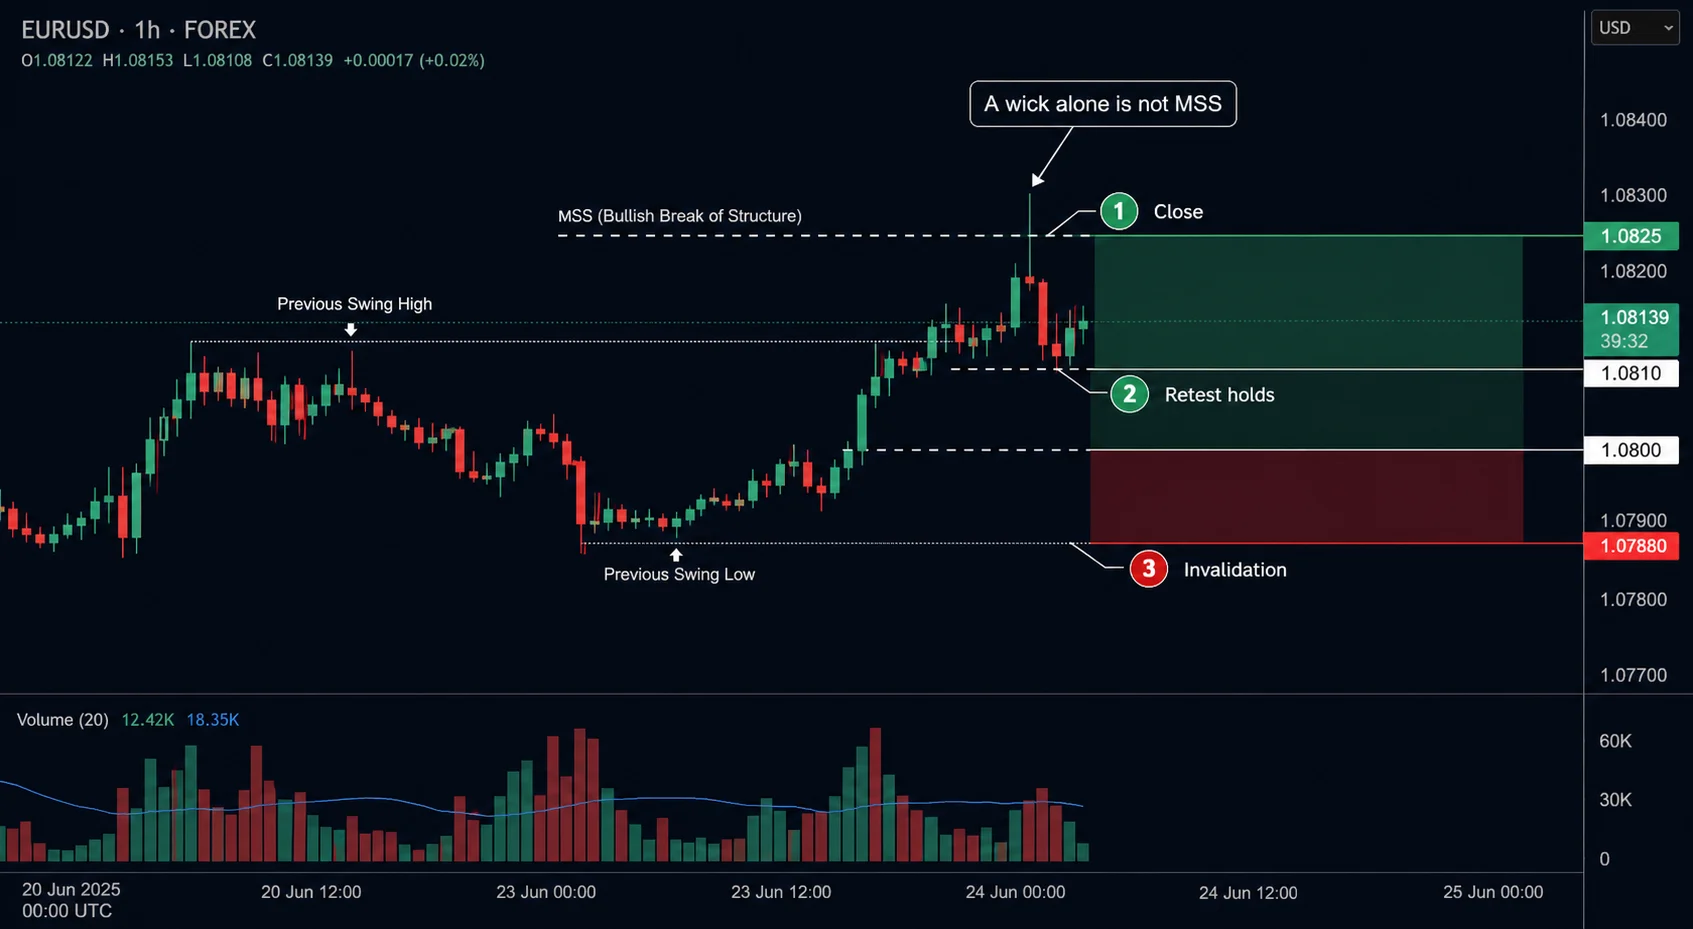
- Mark the swing that currently protects structure on one chosen timeframe.
- Wait for a candle close beyond it; a wick alone is insufficient.
- Compare displacement with the prior 10–20 candles.
- Watch the retest: the old level must hold its new role.
- Define invalidation before entry; abandon the idea if price closes back through the zone.
For broader context, read ICT Market Structure: BOS, CHoCH and Liquidity Context and compare the internal/external structure framework in the Vietnamese companion article Cấu trúc thị trường nội bộ và bên ngoài.
Frequently asked questions
Does MSS require higher volume?
No. Volume is a supporting filter. Close, displacement and the reaction on a retest matter more, and tick volume varies by broker.
Does every CHOCH become an MSS?
No. CHOCH is an alert. Without displacement or with a quick close back through the swing, the MSS thesis has failed.
Editorial note: Học Làm Trader Editorial Team. Educational content only, not investment advice. Test on your broker data and use defined risk before live trading.