


In SMC, swing highs and swing lows anchor market structure, liquidity and protected highs/lows. If swings are marked by feel or mixed between H1 and M15, every BOS or MSS label becomes unstable. This guide gives you a repeatable rule you can put on a checklist.
A repeatable swing-marking rule
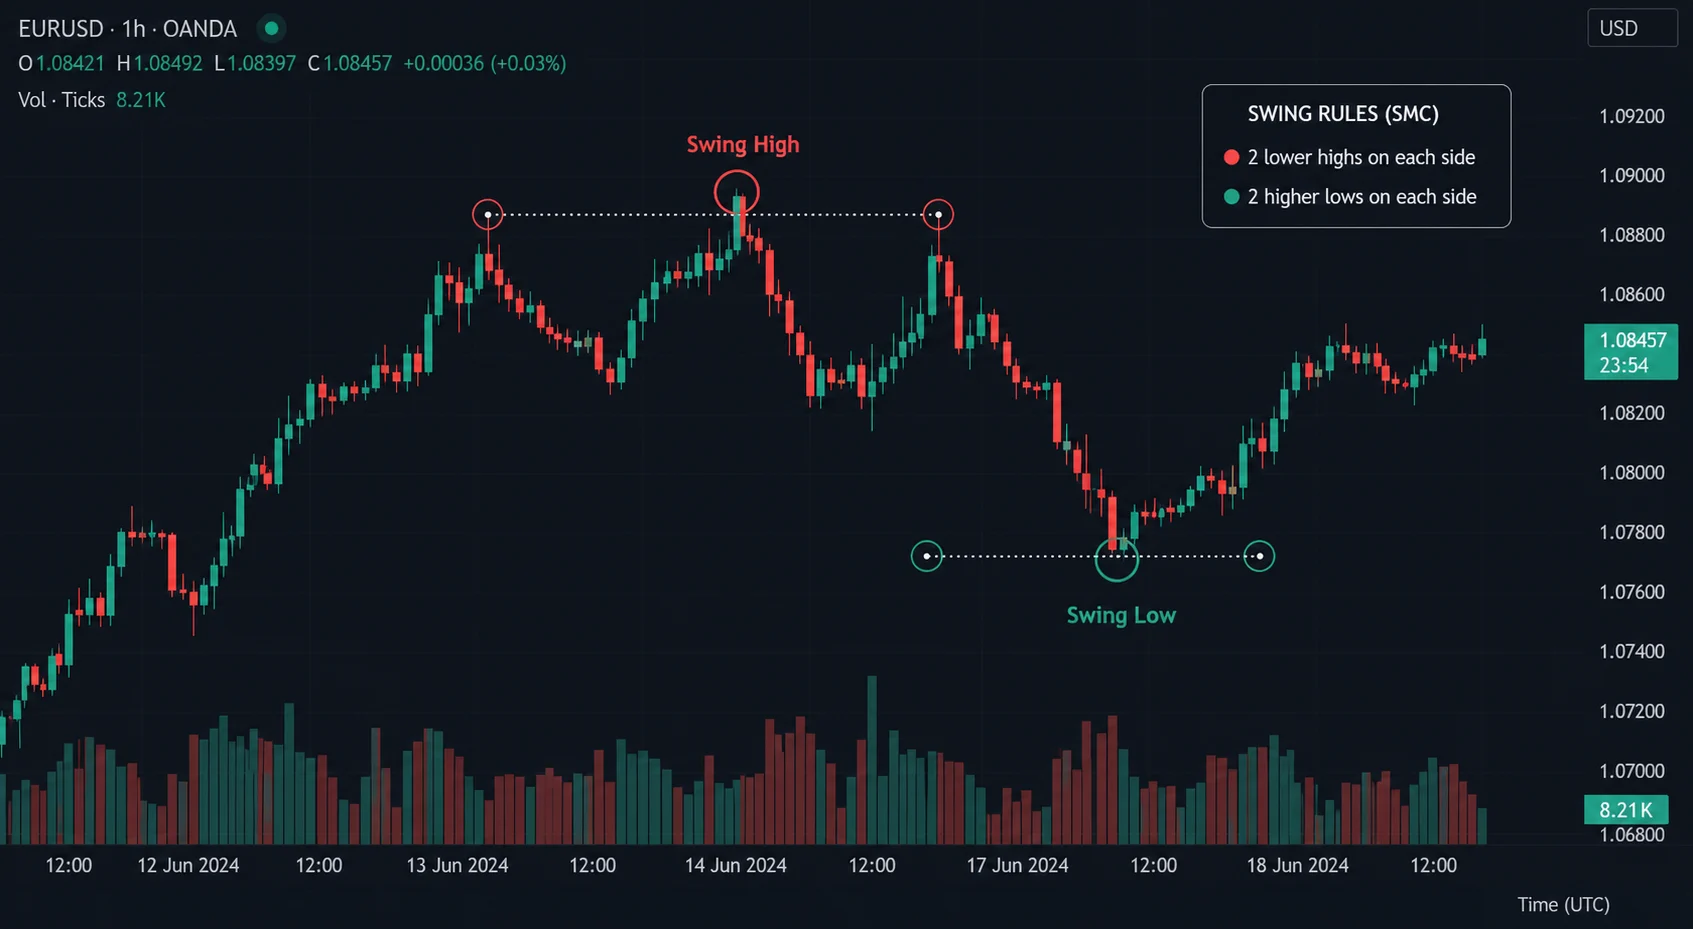
On the selected timeframe, a valid swing high has at least two lower highs on the left and two lower highs on the right. A swing low has at least two higher lows on each side. Until the required candles print, the point is only provisional; do not use it to declare BOS or MSS. Wicks help record the extreme, but the level definition must stay consistent with the purpose of the analysis.
Fractals and timeframes: choose one anchor frame
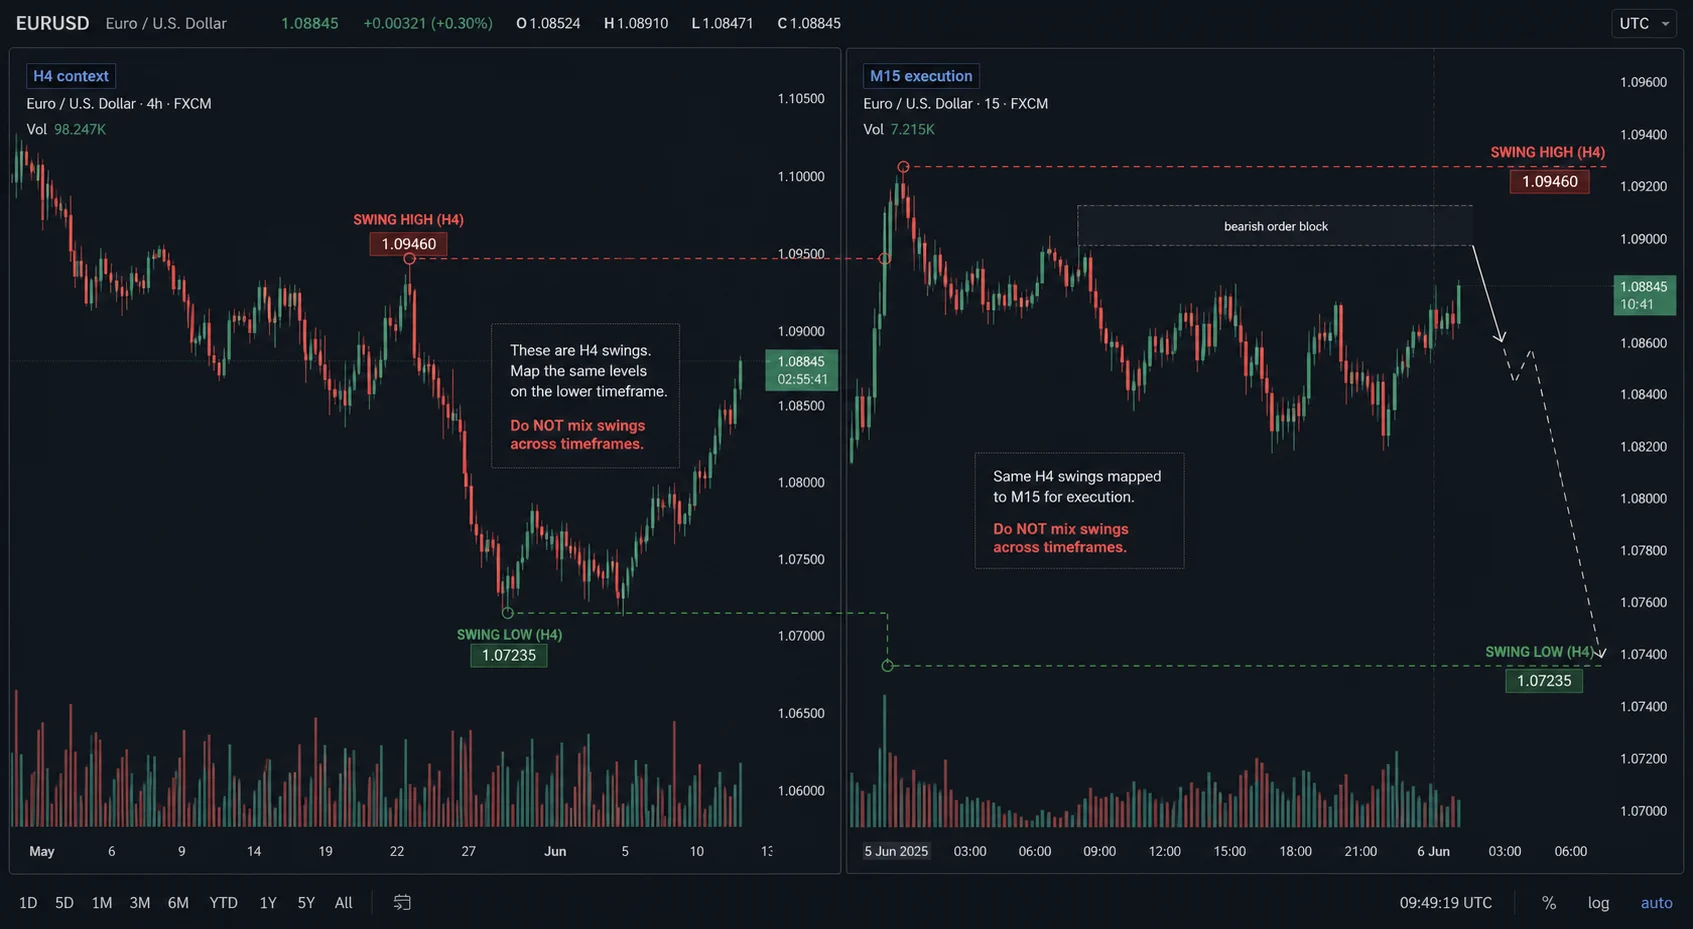
Swings are fractal: the same price leg can contain H4, H1 and M15 swings, but their meaning is different. Choose the context timeframe first, for example H4, then map the same H4 levels to M15 for execution. Do not promote a small M15 pivot to the protected low of H4. When the frames conflict, let the higher-timeframe structure set the bias.
How a protected high/low differs from a liquidity pool
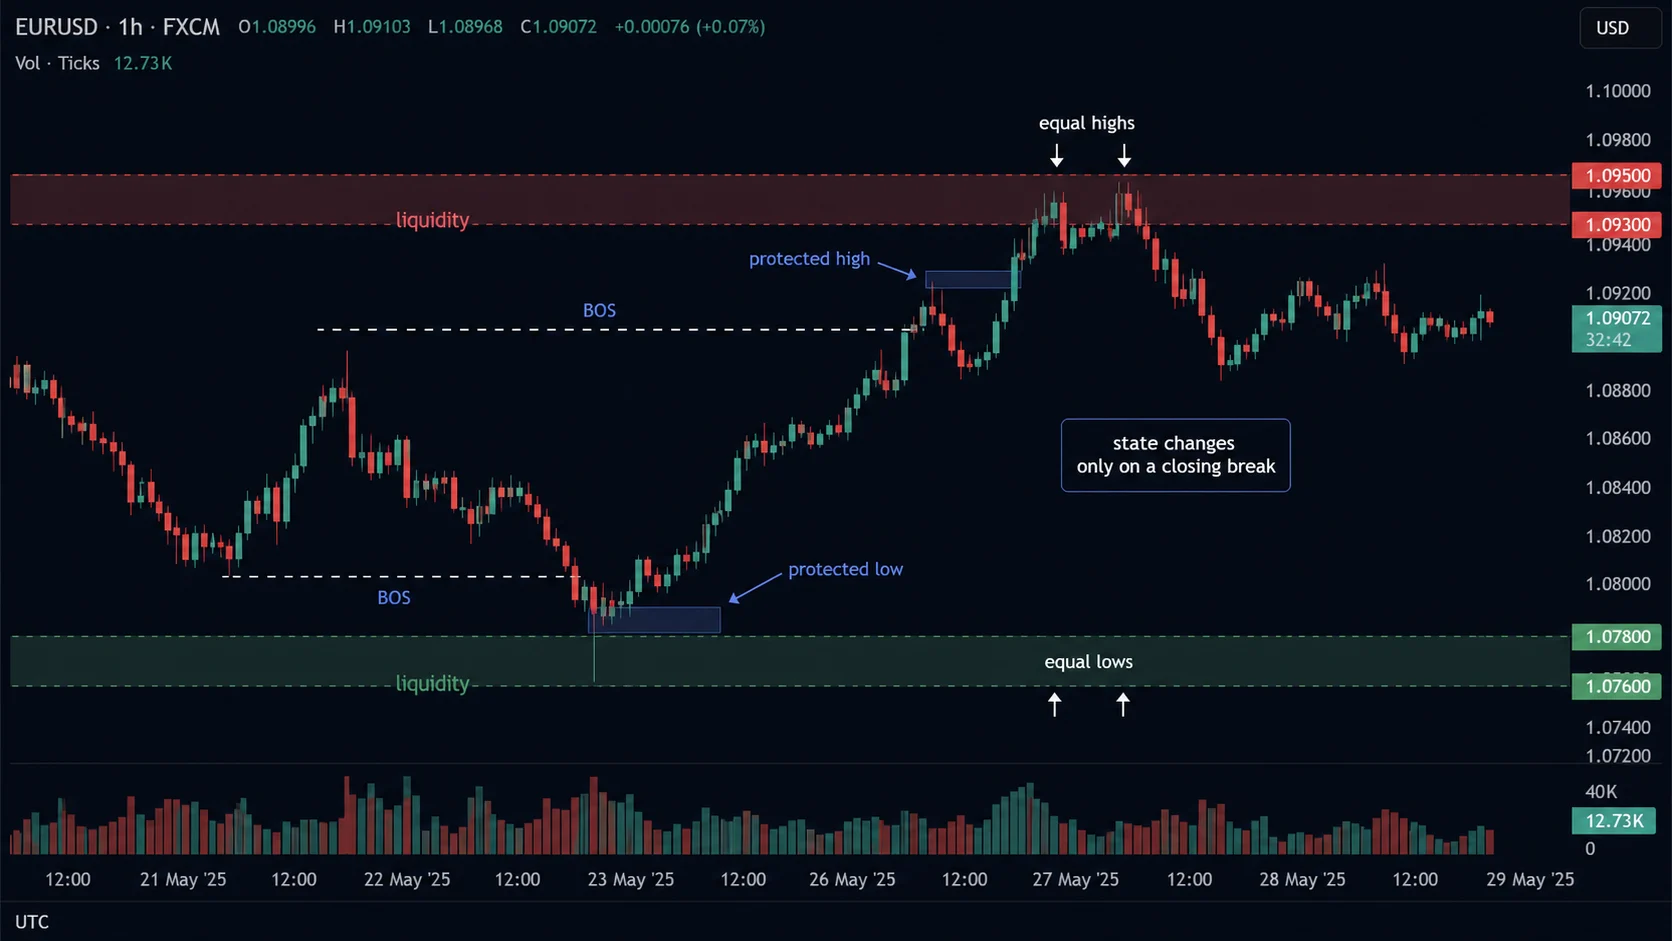
A protected high or low is the swing whose closing break can change the current structural state. A liquidity pool is an area containing clustered stops, often around equal highs or equal lows; price can sweep it without changing structure. Do not call every equal high a protected high. Ask which swing protects the trend, and whether a candle has actually closed beyond it.
A price-labelled checklist example
On EURUSD H1, the 1.0920 high has two lower highs on each side and the 1.0778 low has two higher lows on each side, so both are confirmed swings. After a bullish BOS, the 1.0840 pullback low becomes a protected low if the rally holds. Equal highs around 1.0950 are liquidity above; a wick into 1.0950 does not remove the protected low. Reassess the bullish state only after an H1 close below 1.0840.
A four-step process
- Write the timeframe and fractal rule (2–2) on the chart.
- Wait for both sides to print before confirming a swing.
- Mark external swings first, then internal swings.
- Label protected levels and liquidity separately; change the label only after a confirming close.
For the broader framework, read ICT Market Structure: BOS, CHoCH and Liquidity Context before using swings to label BOS or MSS.
Frequently asked questions
Must every system use exactly two candles?
No single fractal rule fits every system. The 2–2 rule here is testable; if you choose 3–3, apply it consistently in your backtest and state the timeframe.
Does a wick count as a swing?
The wick records the extreme, but protected status still requires a structural context and a confirming close.
Editorial note: Học Làm Trader Editorial Team. Educational content only, not investment advice; test your data and cap risk before live trading.