


Intermarket Analysis compares related markets—such as the US dollar index (DXY), Treasury yields and gold—to understand context and changing regimes. Correlations can strengthen, weaken or reverse, so the method is a way to test relationships rather than a rule that one market must predict another. Define the time window, data source and failure condition before drawing a conclusion.
What intermarket analysis compares
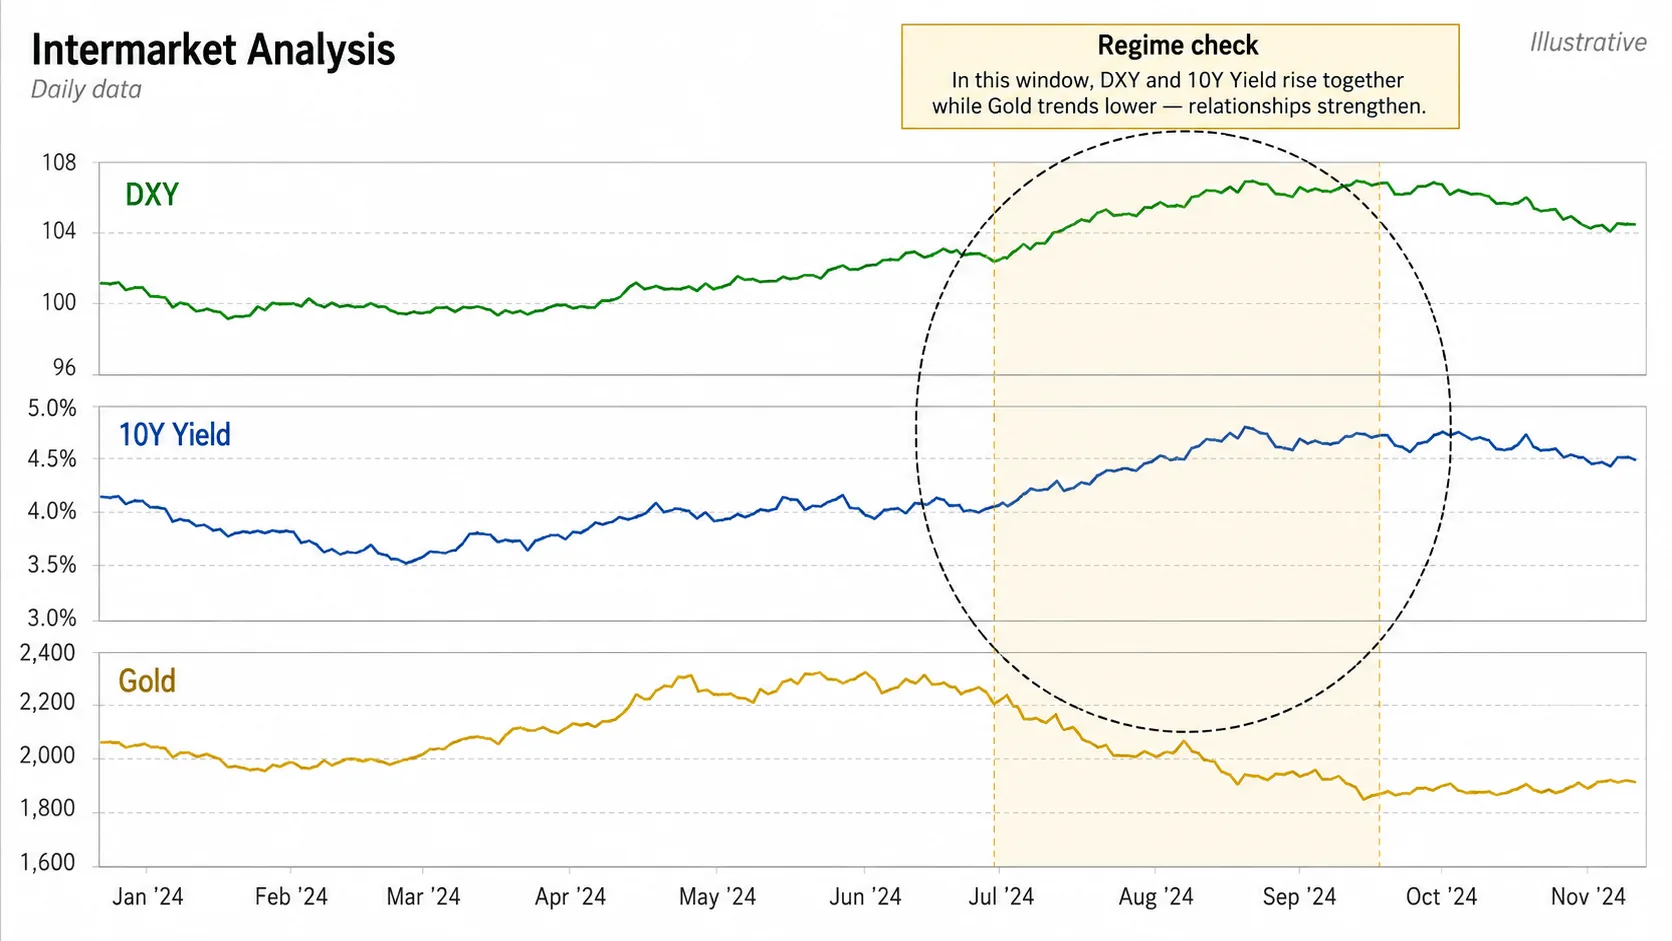
DXY represents a dollar-index series, Treasury yields reflect the market’s pricing of borrowing and duration risk, and gold is often studied as a real-rate, currency and risk-sentiment asset. These are different measurements, not interchangeable indicators. A chart can show them side by side, but visual co-movement does not establish a stable causal relationship.
Start with a specific question: “When the dollar strengthens in this regime, how has gold responded over the chosen horizon?” Add yields only if they answer a separate question about rate expectations or real-rate pressure. The technical-analysis frameworks guide is a useful place to separate macro context from a price trigger.
Use consistent timestamps and transforms. Compare returns or percentage changes rather than raw price levels, and state whether the yield is a level or a change. A rising yield and a falling bond price are related descriptions, while DXY and gold may show different sensitivity across sessions. Avoid mixing daily closes with intraday prices without documenting the alignment.
Measure correlation without mistaking it for causation
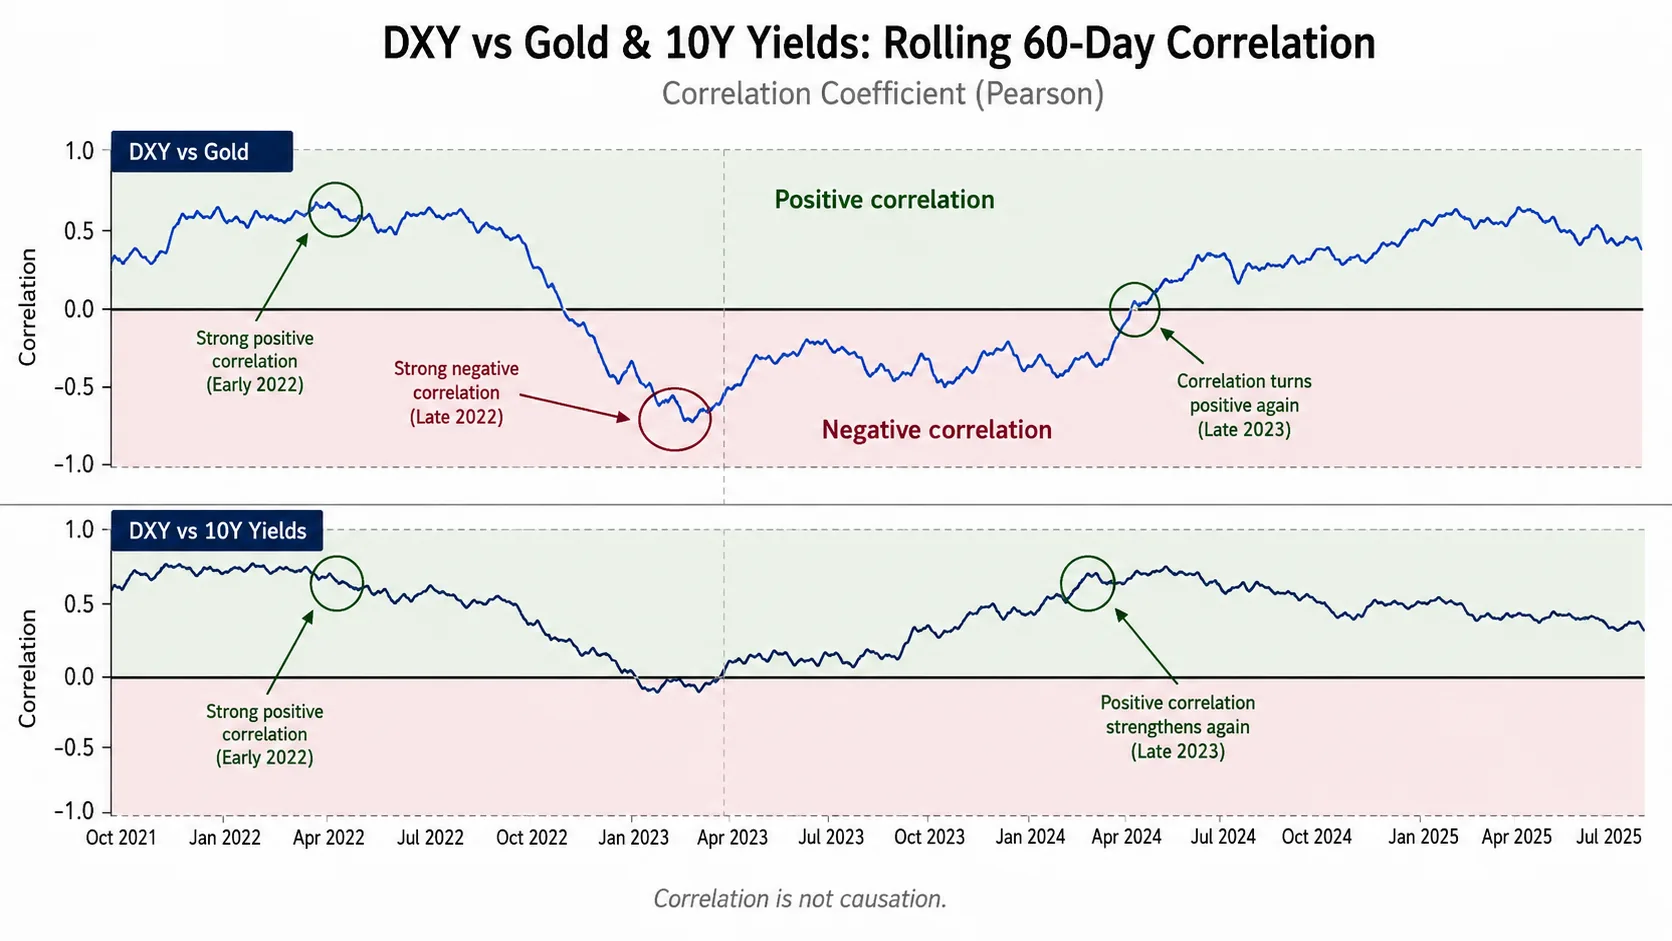
A simple Pearson correlation over a rolling window is corr(X,Y) = cov(X,Y) / (σX × σY). It measures co-movement in the selected sample, not a mechanism. A positive value means the two return series moved in the same direction more often or more strongly within that window; a negative value means the opposite. It says nothing about which market leads or why.
| Check | Why it matters | Safer wording |
|---|---|---|
| Window length | Short windows are noisy; long windows can hide regime shifts | “In this sample and window…” |
| Lead/lag | Same-day correlation can miss timing differences | Test lags explicitly |
| Data alignment | Different holidays and session closes distort pairs | Use matched timestamps |
| Multiple testing | Trying many windows can create a lucky result | Predefine the protocol |
Official series such as the Federal Reserve Bank of St. Louis FRED broad dollar index, 10-year Treasury yield and gold price can provide reproducible inputs. Check units, revisions, missing values and timezone before calculating. Do not turn an illustrative chart into a claim about a current market regime.
Build a regime-aware workflow
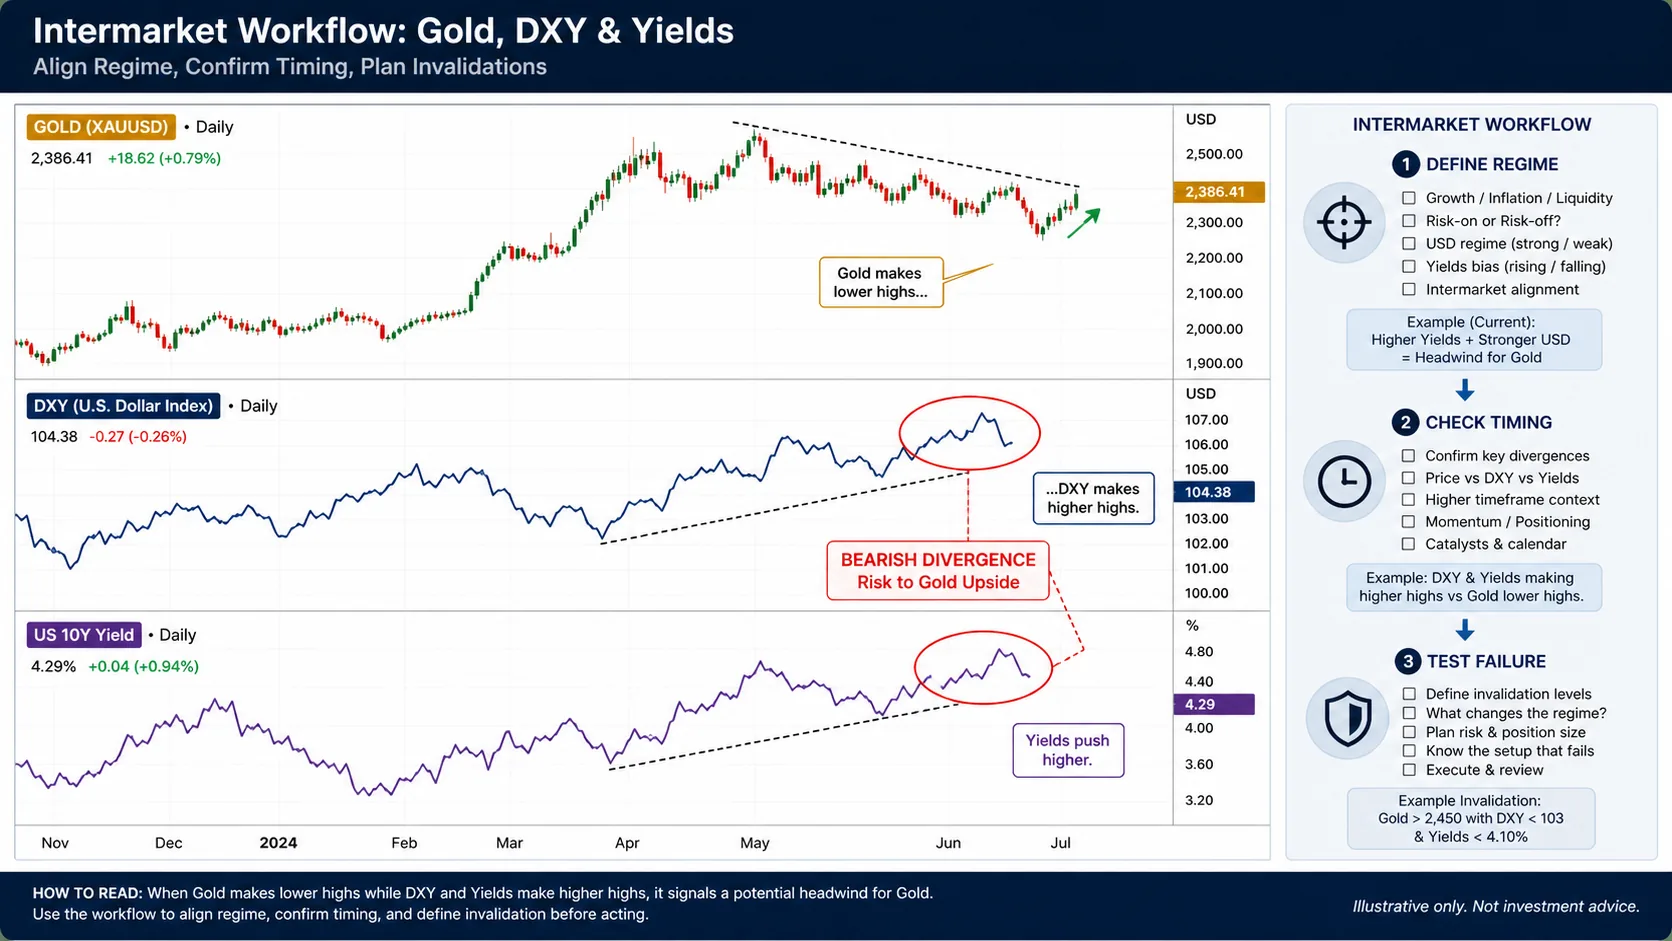
- Define the regime: choose the dates, instrument, session and economic question.
- Normalize the data: use matched returns, a stated frequency and a documented source.
- Compare structure: mark trend, range and event levels on the traded instrument.
- Test a trigger: require price behaviour—not correlation alone—to confirm or invalidate an idea.
- Review failures: record correlation breaks around policy events, liquidity shocks and data gaps.
For a gold-related chart idea, the Price Action beginner guide keeps the execution step separate from macro context. A correlation that reverses is information about the regime, not proof that the old relationship was “wrong.” If the data disagree or the event risk is unclear, no trade is a valid result.
Do not publish a win rate, forecast or causal claim without a dated dataset, a transparent sample and out-of-sample validation. Correlation is a filter for questions; position size and risk limits remain independent decisions.
Further reading: Use the trading glossary to keep DXY, yield and correlation definitions explicit.
Risk disclosure: This article is educational information, not investment advice or a solicitation to trade. Auction, correlation and harmonic observations can fail, illustrative charts do not predict future results, and trading can result in loss of capital. Define risk and verify your data before acting.
Pingback: ICT Killzones: Session Context, Confirmation And Limits