


Chaikin Money Flow (CMF) combines a volume-weighted close location with a chosen rolling window to describe whether price tended to finish nearer the high or low while activity was recorded. CMF can add context to accumulation or distribution hypotheses, but it is not an independent buy/sell trigger and depends on the quality of OHLCV data.
What Is Chaikin Money Flow?
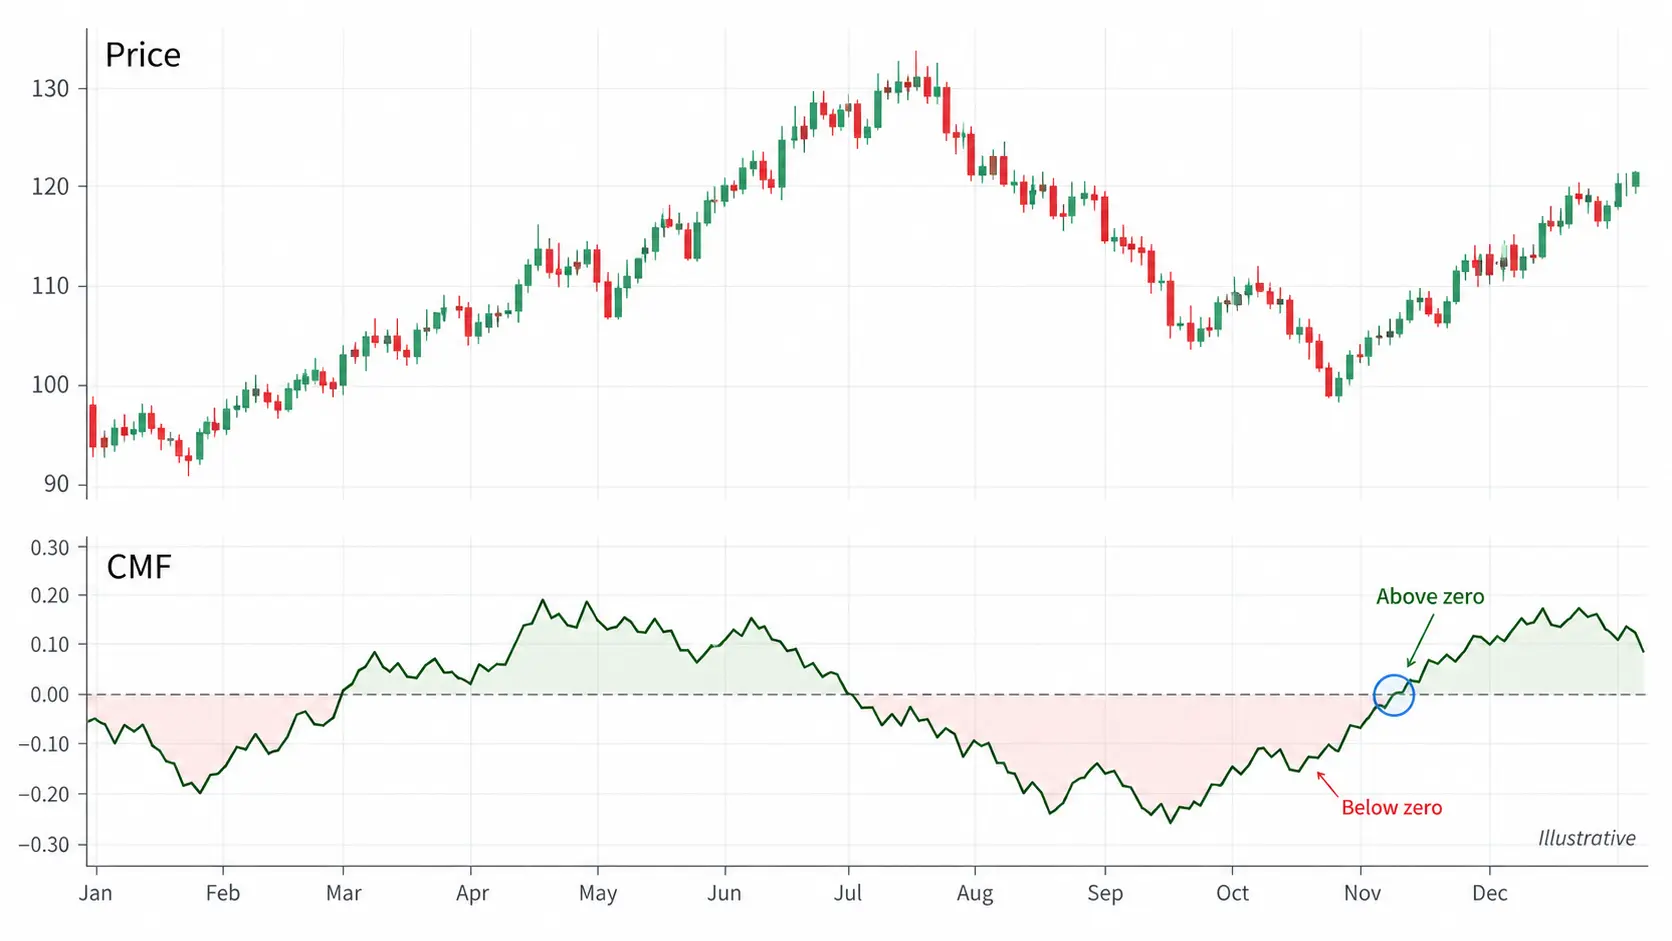
CMF uses the close location value (CLV) of each bar and weights it by volume, then sums the result over a rolling window and divides by volume over that window. A value above zero means closes were, on balance, nearer the upper part of ranges in the sample; below zero means the opposite tendency. The sign is descriptive, not proof of institutional flow.
Compare CMF with candlestick context and note whether the feed supplies reliable volume. In spot Forex, tick volume is broker-specific activity and is not centralized traded volume.
CMF Calculation and the Zero Line
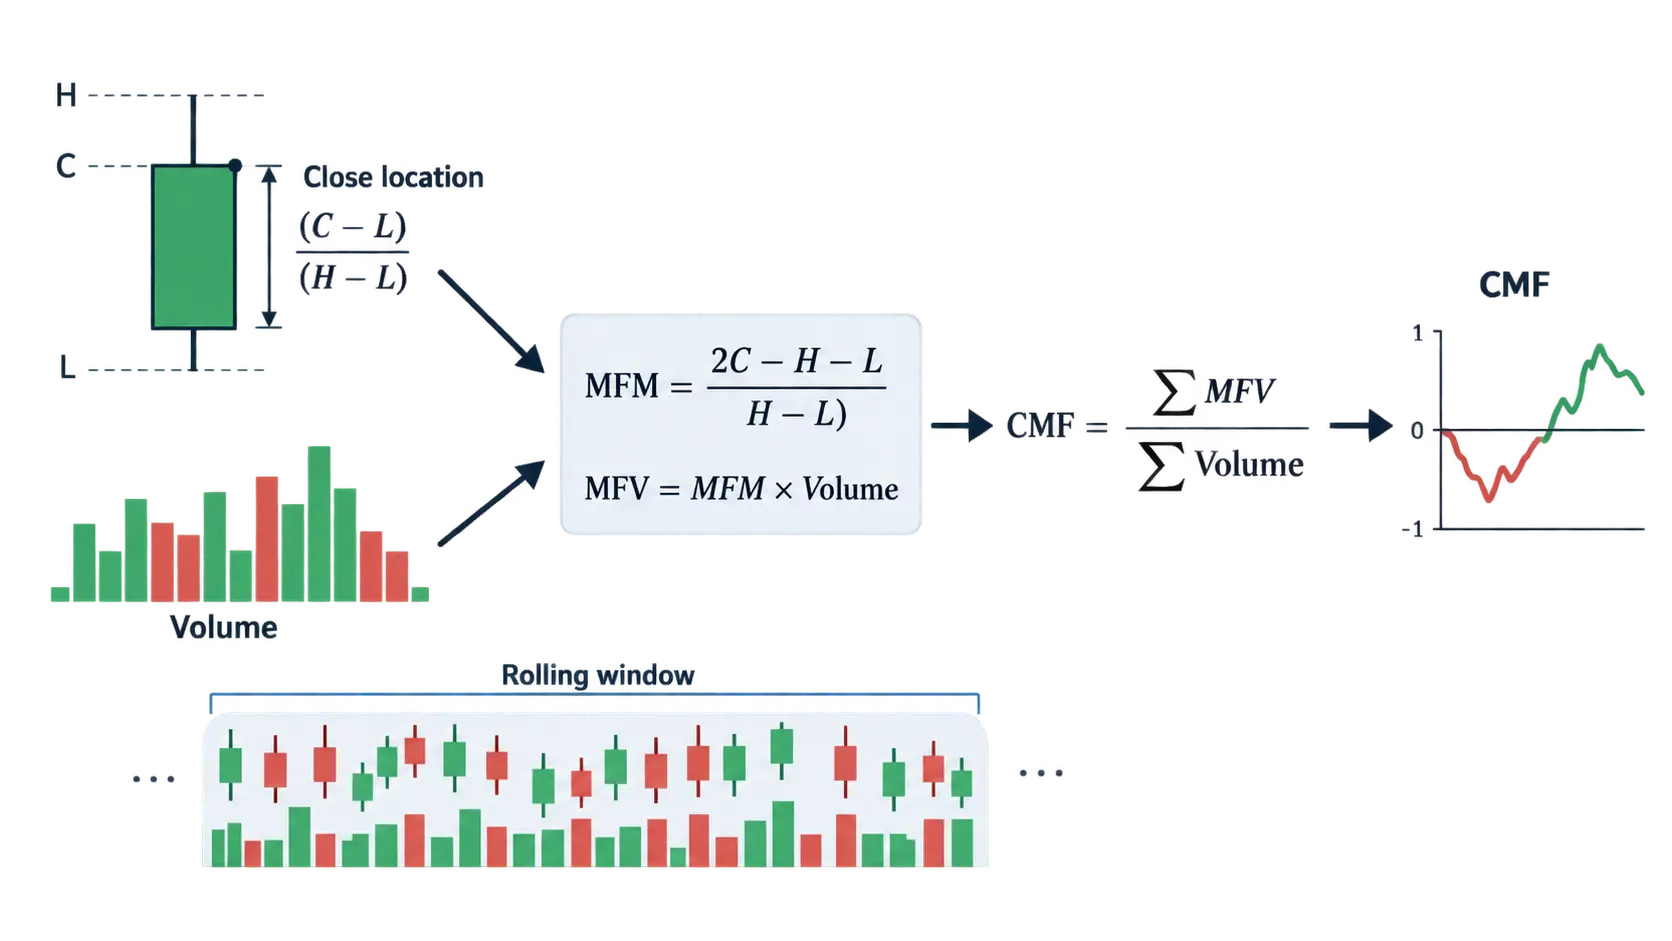
CLV = ((Close − Low) − (High − Close)) / (High − Low); CMF = Σ(CLV × Volume) / ΣVolume over the chosen window. A zero crossing can occur because of the window rolling forward, not necessarily because a new trend began. Record the window, price field, volume source and treatment of zero-range bars.
| Observation | Possible reading | Still unknown |
|---|---|---|
| CMF above zero | Closes lean toward range highs in the window | Future demand or price direction |
| CMF below zero | Closes lean toward range lows | Future supply or reversal |
| CMF crosses zero | Rolling balance changed | A confirmed breakout |
| Price/CMF diverge | The measures disagree in the sample | Timing or cause of a reversal |
Illustrative Divergence and Failure Cases
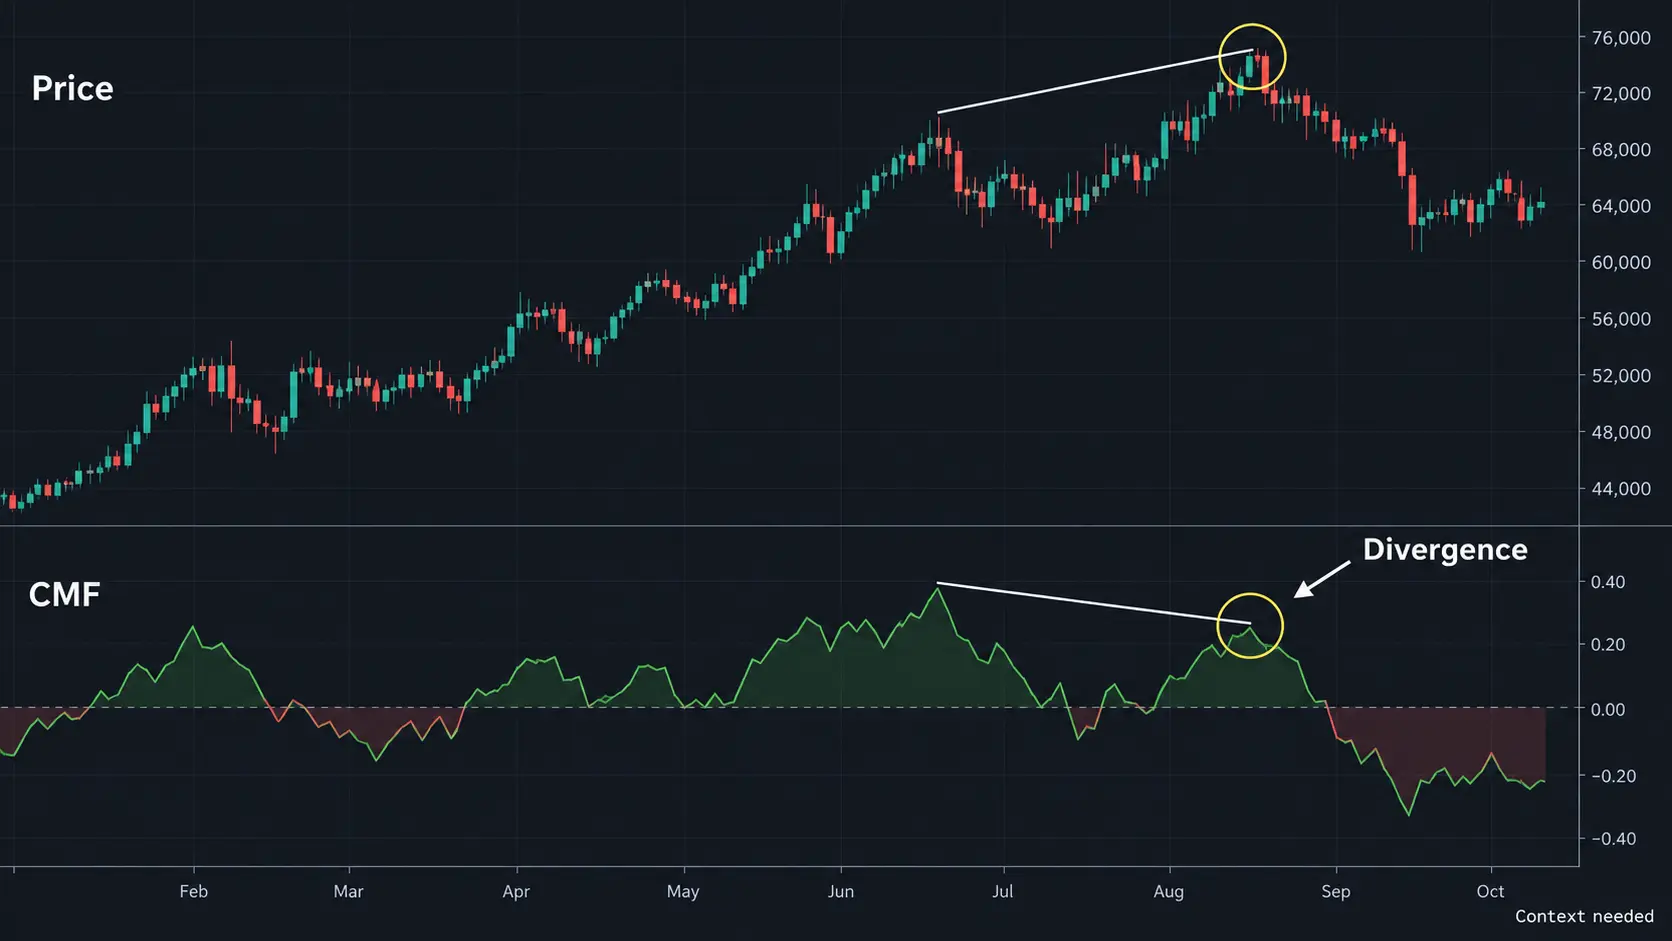
Imagine a fictional BTCUSD daily sample in which price makes a marginal higher high while CMF fails to exceed its prior peak. This is an observation of disagreement between price and the rolling volume-weighted close location. It does not establish a short, an exact top or a probability of decline. The divergence can disappear when the window rolls or when volume data is revised.
Failure cases
- using tick volume as if it were centralized exchange volume;
- comparing CMF values built with different windows or price fields;
- treating a single zero cross as confirmation;
- ignoring gaps, illiquid bars or a zero High–Low range;
- selecting divergence examples only after knowing the outcome.
A Responsible CMF Workflow and Limits
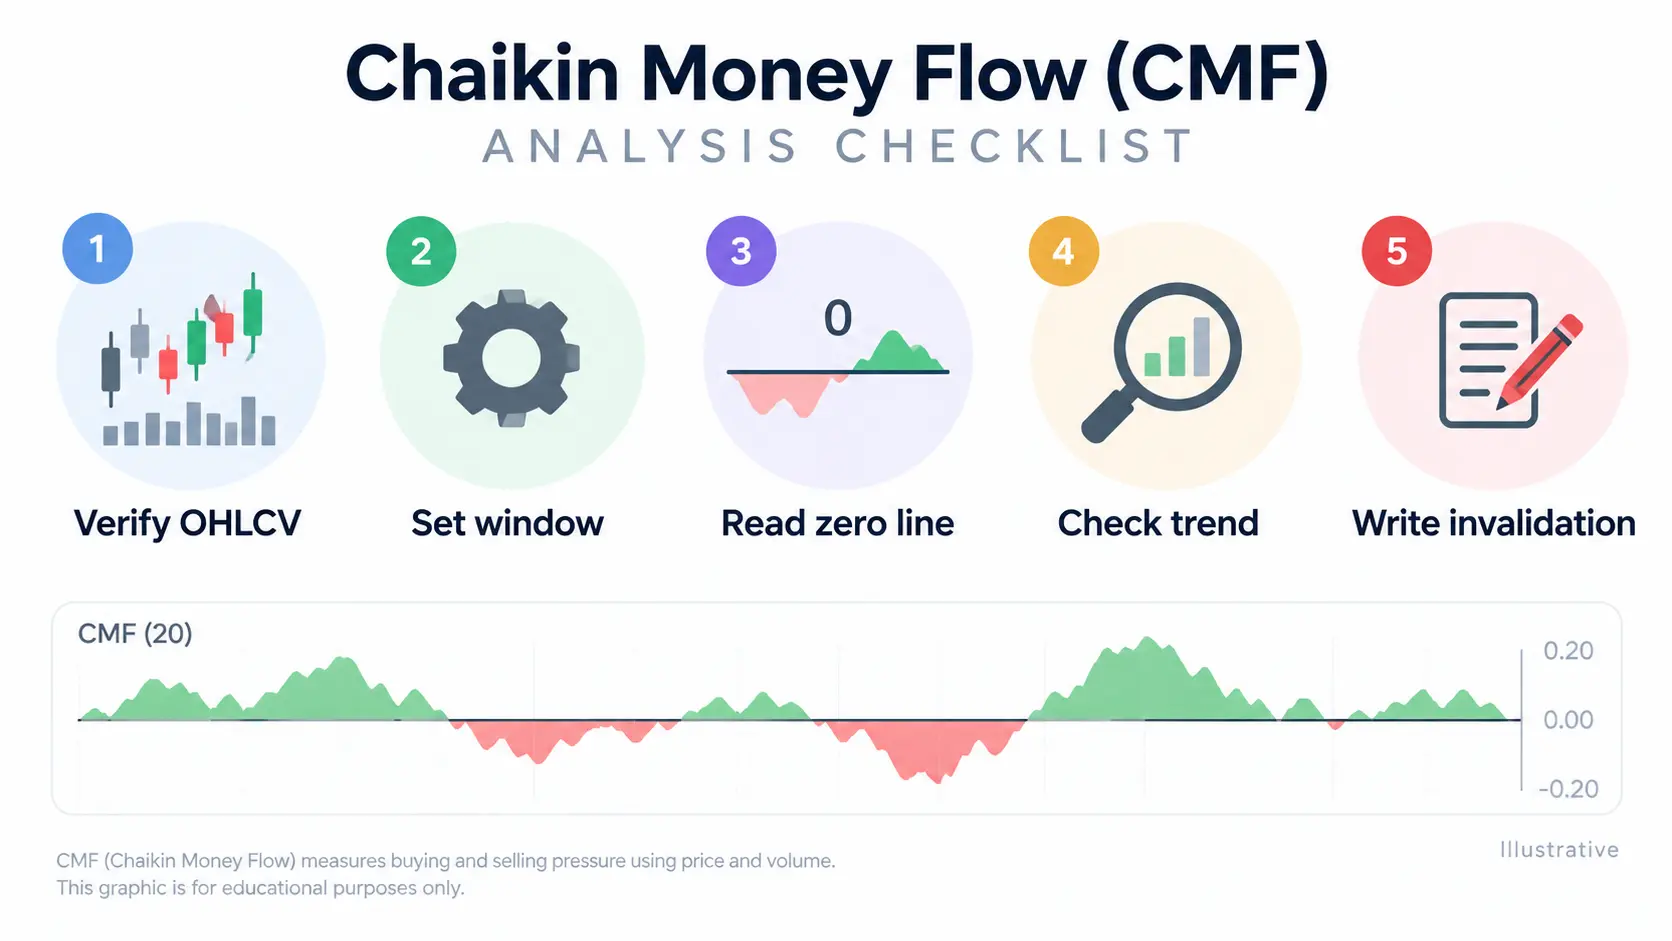
- verify OHLCV fields, volume definition and the data feed;
- choose and document the rolling window before reading outcomes;
- read the zero line with price structure, trend/range and nearby levels;
- treat divergence as a hypothesis and require a separate confirmation test;
- write invalidation, costs and risk limits; log both failed and successful-looking samples.
Limits
- CMF is sensitive to window length and volume quality;
- different feeds can produce different values;
- a rolling calculation can change as old bars leave the window;
- CMF cannot identify every participant or prove cause;
- the indicator does not provide a win rate, target or risk limit.
For risk documentation, use risk–reward planning. It helps define invalidation and costs, not a CMF signal.
Key takeaways
- CMF summarizes volume-weighted close location over a window;
- above/below zero are descriptive tendencies, not forecasts;
- window, volume source and zero-range handling matter;
- divergence needs context and can fail or roll away;
- verify data and manage risk before using the indicator.
References
Risk note: This is educational content, not investment advice. Volume indicators can be distorted by data limitations and trading can result in losses.