


Short answer: Candlestick charts encode open, high, low and close for a chosen period. Bodies, wicks and closing location can describe momentum, rejection or indecision, but a named pattern has no standalone predictive power. Read it in trend or range context, define confirmation and invalidation, and keep position risk separate from the pattern label.
How to Read a Candlestick
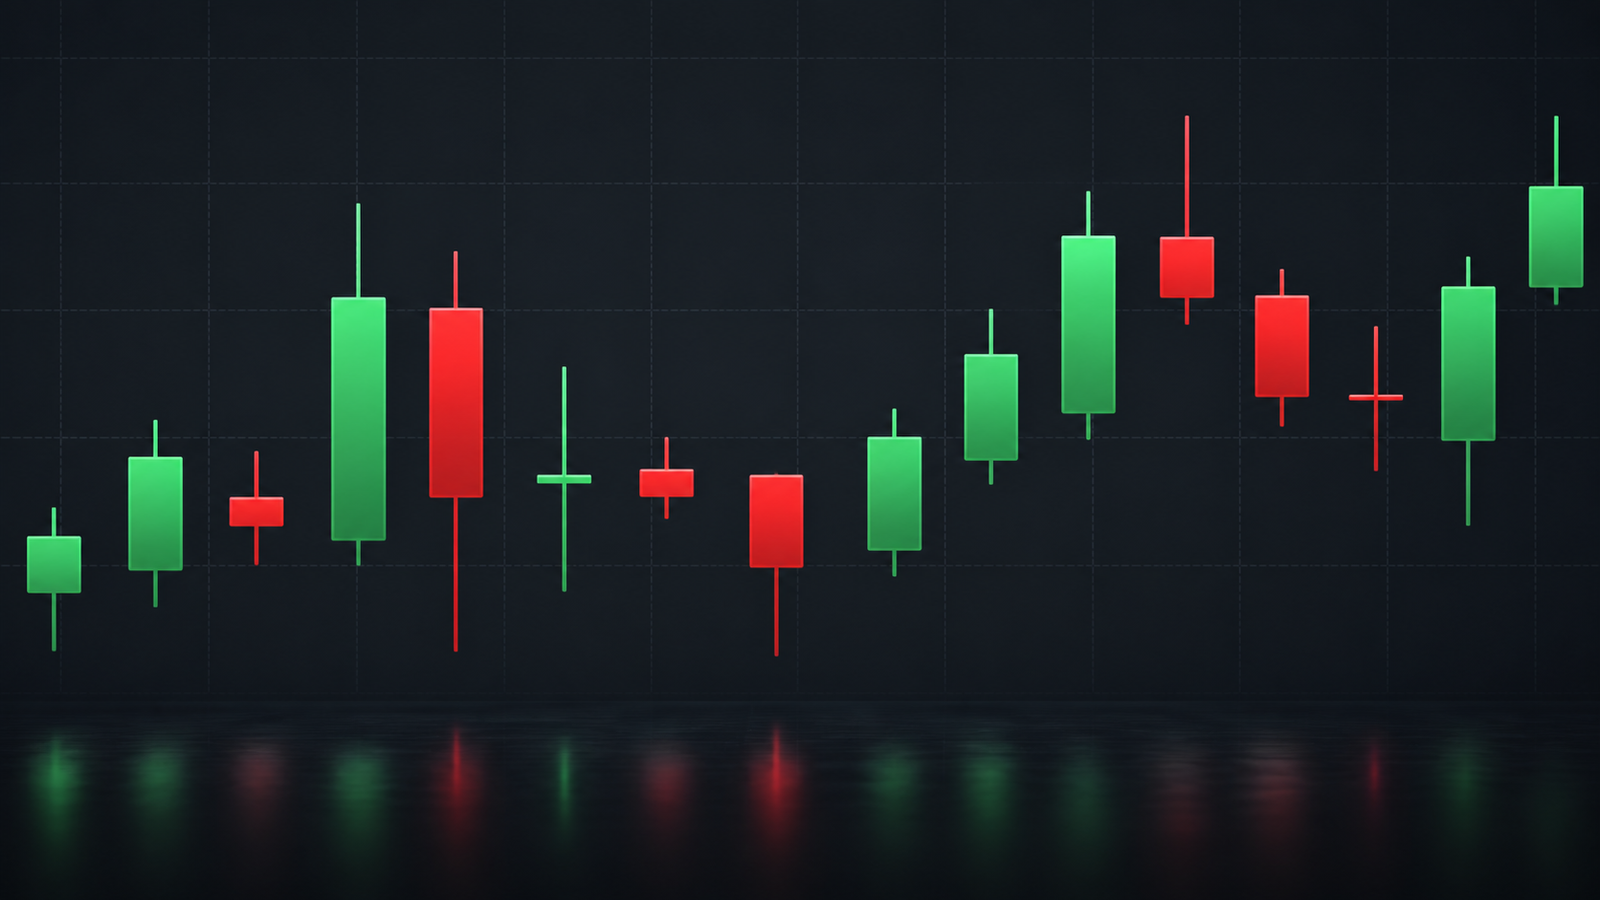
Each candle records OHLC: open, high, low and close. The body is the distance between open and close; the upper and lower wicks show how far price travelled before the period ended. A green or red body describes the close relative to the open—it does not identify every buyer or seller behind the move.
Record the instrument, timeframe, session and date range before naming a pattern. A five-minute pin bar is not equivalent to a daily pin bar, and a doji in the middle of a range is not the same as a doji at a tested boundary. The site’s candlestick-reading guide covers the OHLC foundation.
Bodies, Wicks and Closing Location
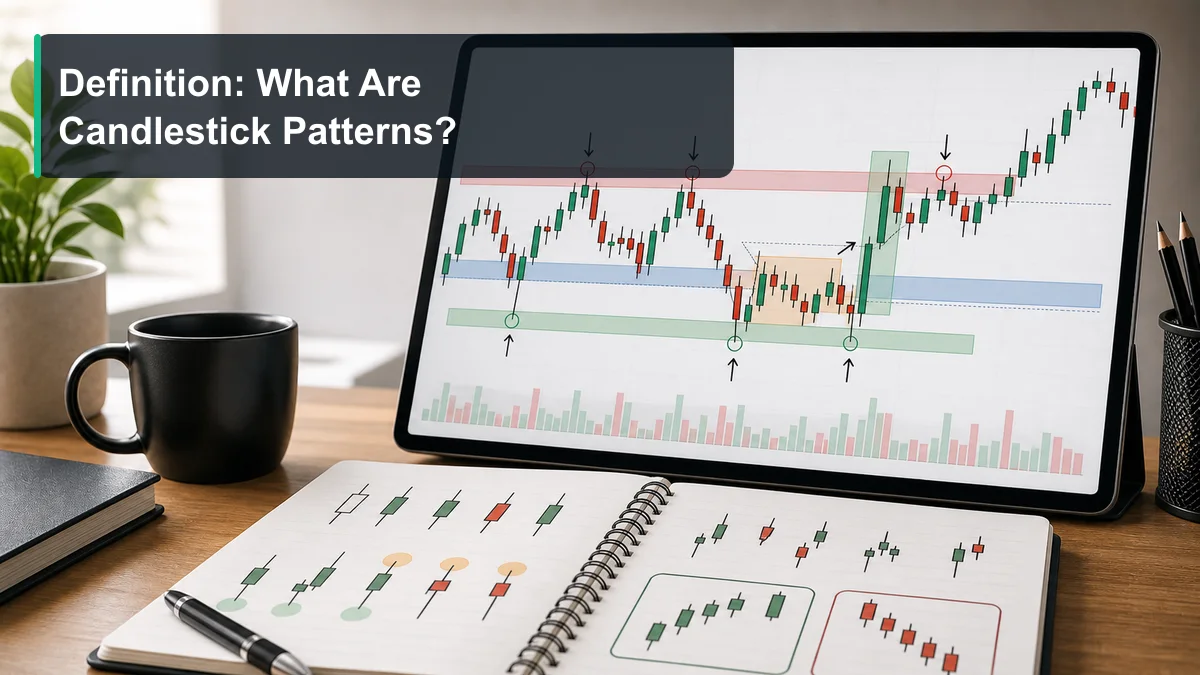
A large body records a large open-to-close move during the bar; a long wick records a test that was not fully held. A close near the high can show demand during that period, but follow-through is still unknown. The same logic applies to a close near the low and potential supply.
Compare size with a local baseline. A 20-pip body can be unusually large in a quiet Asian session and ordinary during a news release. Do not use candle colour as a substitute for location, structure or liquidity. The site’s close-based price-action article explains why the closing price needs context.
| Observation | Possible interpretation | Not enough to conclude |
|---|---|---|
| Wide body, close near high | Momentum was present in that bar. | The trend must continue without a retest. |
| Long upper wick, weak close | Higher prices were rejected during the bar. | A reversal is certain at every location. |
| Small body, two long wicks | Temporary indecision or two-sided auction. | A specific breakout direction is guaranteed. |
Trend, Range and Pattern Location
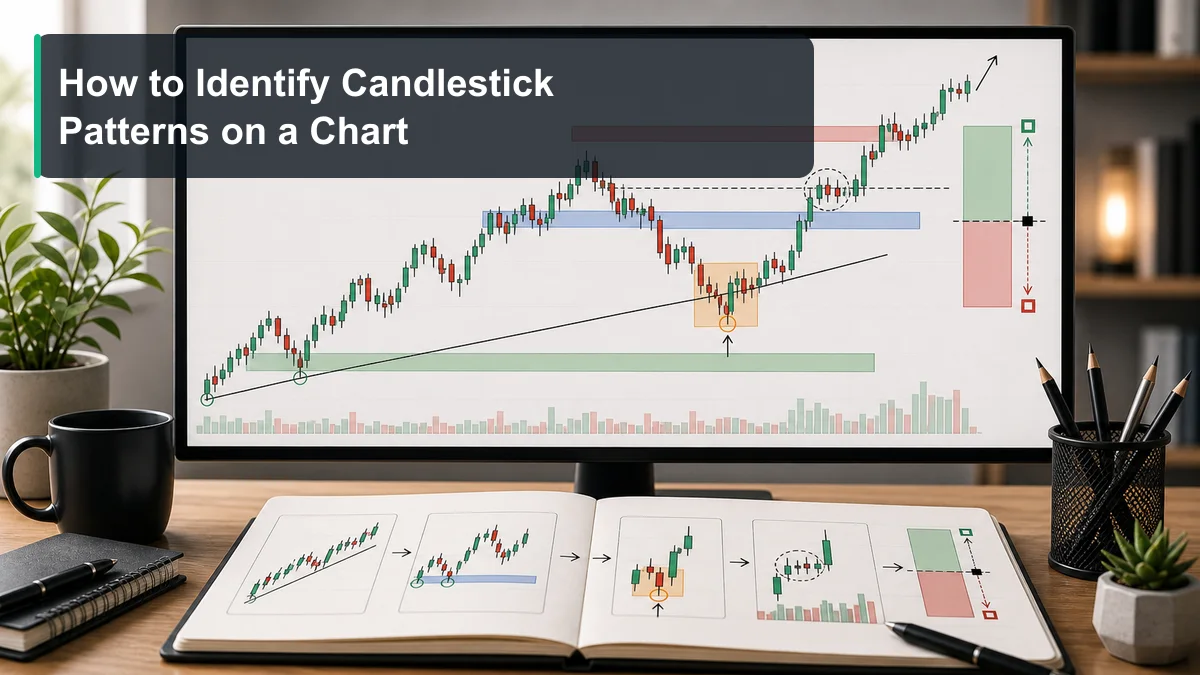
In a trend, a candle that agrees with the larger direction may be a continuation candidate, while an opposing candle may simply be a pullback. In a range, a rejection at a tested boundary is more informative than the same rejection in the centre. These are context hypotheses, not entry rules.
Mark market structure and levels before searching for a pattern name. If there is no meaningful location, write a neutral description such as “a long upper wick.” The market-structure guide helps separate a real swing from chart noise.
Reversal Group: Doji, Engulfing and Pin Bar
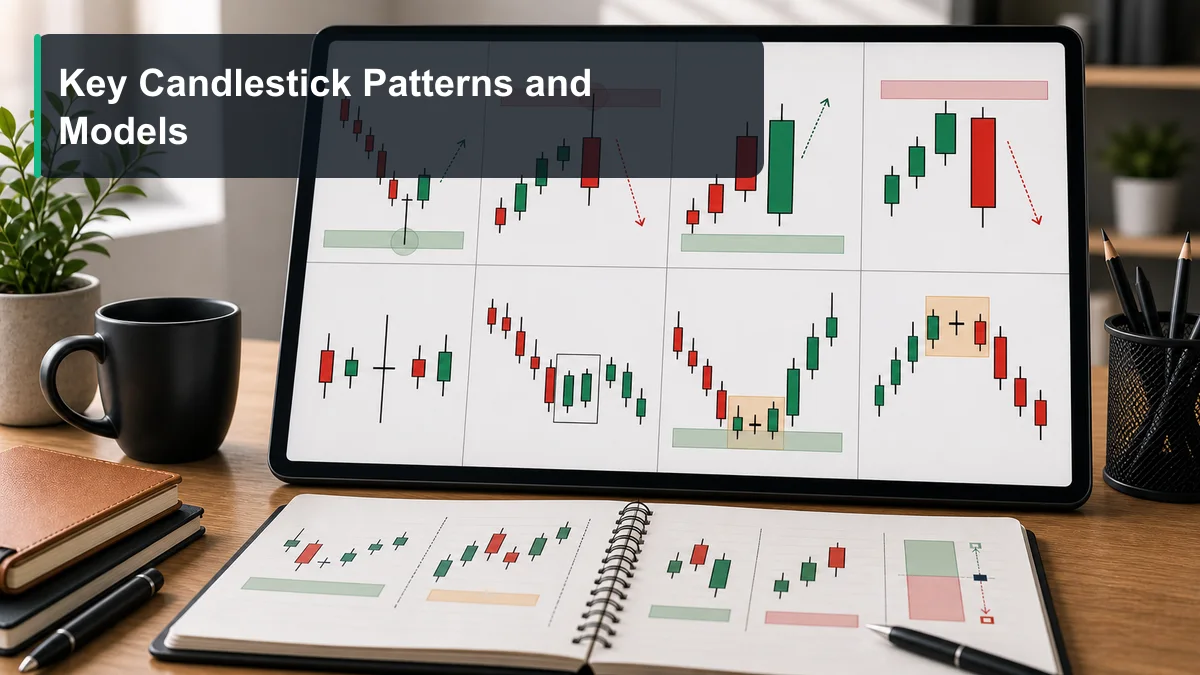
A doji has an open and close near one another and can show temporary balance. An engulfing candle has a later body that covers the prior body, but its relevance depends on the level and the size of the move. A pin bar emphasises a rejected wick; it is not a reversal merely because the wick is long.
For each pattern, record the preceding trend, the level, the completed close, the required follow-through and the invalidation. Use the dedicated Gravestone Doji guide for a specific example. Do not describe a doji or engulfing candle as a guaranteed reversal.
Continuation Group: Inside Bar and Marubozu
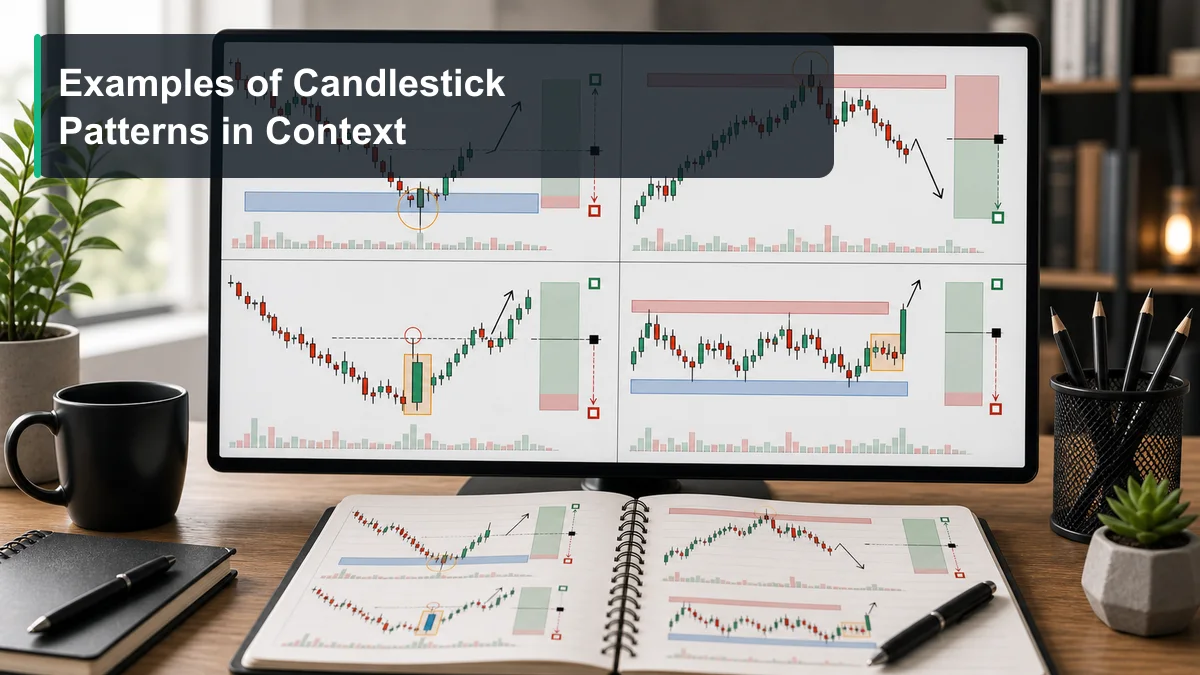
An inside bar contracts within a mother bar; a break can fail and return to that range. A Marubozu has a large body with little wick, showing control of the close during one period but not a promise for the next. A range breakout needs a close, a retest or acceptance rule.
Compare spread with nearby candles, identify the level and write the failure condition before reviewing the result. The site’s price-action guide keeps these patterns within a broader structure and risk workflow.
Confirmation and Invalidation

Confirmation might be a close beyond a pattern high or low, a retest that holds, or follow-through within a defined number of bars. Invalidation might be a decisive close through the level or a return inside a mother bar. A wick that briefly crosses a boundary is not the same as sustained acceptance.
Waiting for confirmation trades earlier price for more evidence; acting before the close trades less delay for more uncertainty. Neither choice has a universal win rate. Document your rule, session, spread and maximum risk instead of presenting one entry style as “safe.”
A Context-to-Journal Candlestick Workflow
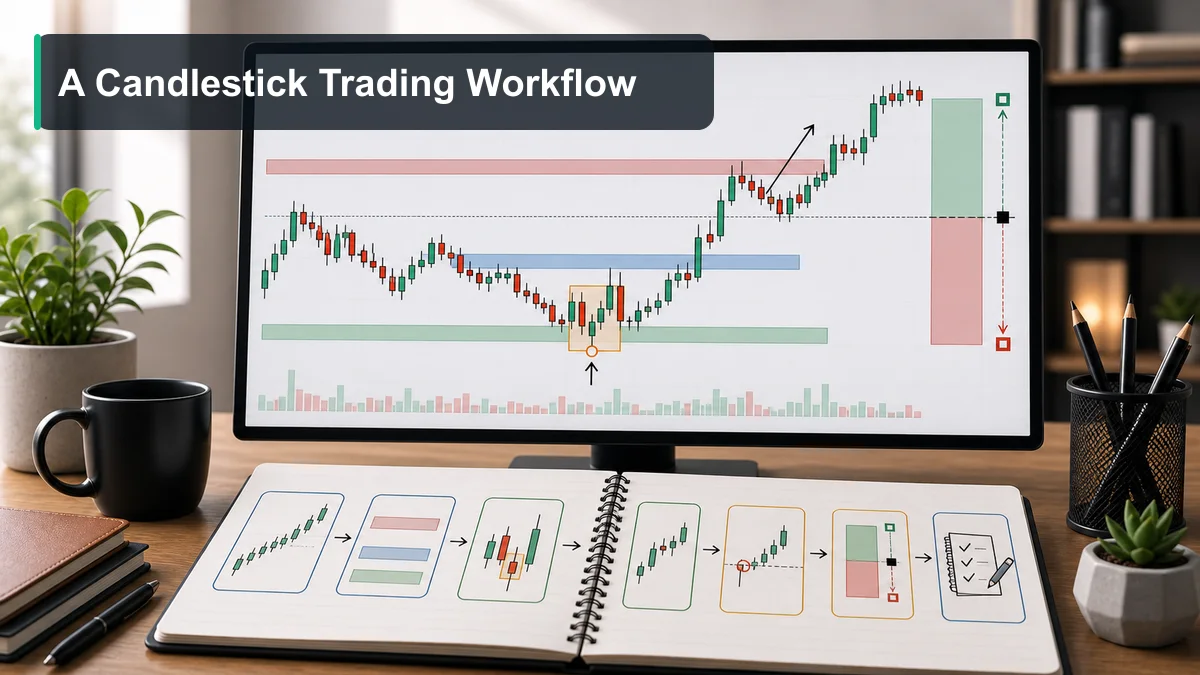
- Context: define trend or range, timeframe and session.
- Level: mark support, resistance, swing or range boundary.
- Pattern: describe OHLC and use a name only when its geometry fits.
- Confirmation: specify the close, retest or follow-through required.
- Invalidation: write the price behaviour that cancels the hypothesis.
- Risk and review: calculate size separately, save the chart and record the outcome.
The workflow can end with “no evidence yet.” A useful hub should not force every candle into an execution decision.
Illustrative Example: Engulfing at Support
Label: this is an illustrative teaching scenario, not historical performance data or a backtest. Suppose hypothetical EUR/USD H4 price declines from 1.0900 to a 1.0820–1.0830 support area. A bearish candle has an 18-pip body, followed by a bullish candle with a 25-pip body that covers the prior body and closes at 1.0850.
Observation: a bullish engulfing shape appears at a marked area. Confirmation needed: the next one or two bars hold above 1.0830 without a close through the zone. Invalidation: a clear close below 1.0820 followed by acceptance underneath makes the support hypothesis fail.
No entry, target or win-rate conclusion follows from those illustrative numbers. A real chart should include timestamp, feed, timeframe, date range and a verifiable source.
Failure Cases When Reading Candlesticks
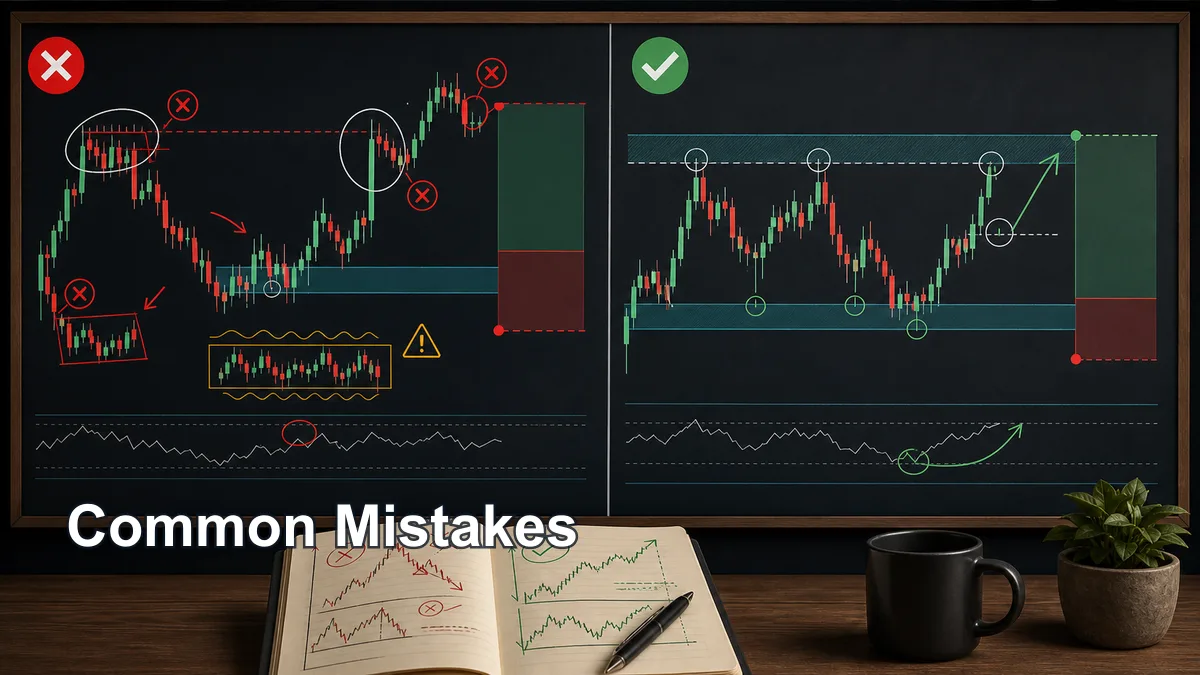
- Hindsight: remembering the pattern only after price moved. Save charts at observation time.
- Middle-of-range signals: ignoring location and liquidity reduces information.
- Entering before the close: an unfinished candle can change shape completely.
- Chasing a Marubozu: wide spreads and news can make risk unacceptable.
- Calling a wick acceptance: separate a temporary sweep from a sustained close-through.
- Ignoring costs: spread, slippage and session conditions can erase a theoretical edge.
If two explanations remain plausible, write “unconfirmed.” That is a higher-quality record than forcing a pattern name.
Volume and Structure as Context

Relative volume can help compare activity during a breakout or rejection, but spot Forex commonly provides broker-specific tick volume rather than a consolidated exchange series. The site’s technical-indicators guide and the VSA discussion explain why a volume bar should remain contextual.
Market structure identifies which swing the candle is interacting with and whether a break is meaningful or just noise. Keep the MSNR confirmation guide as a specialised supporting page rather than treating every candle as the same intent.
A Checklist Before Naming a Pattern
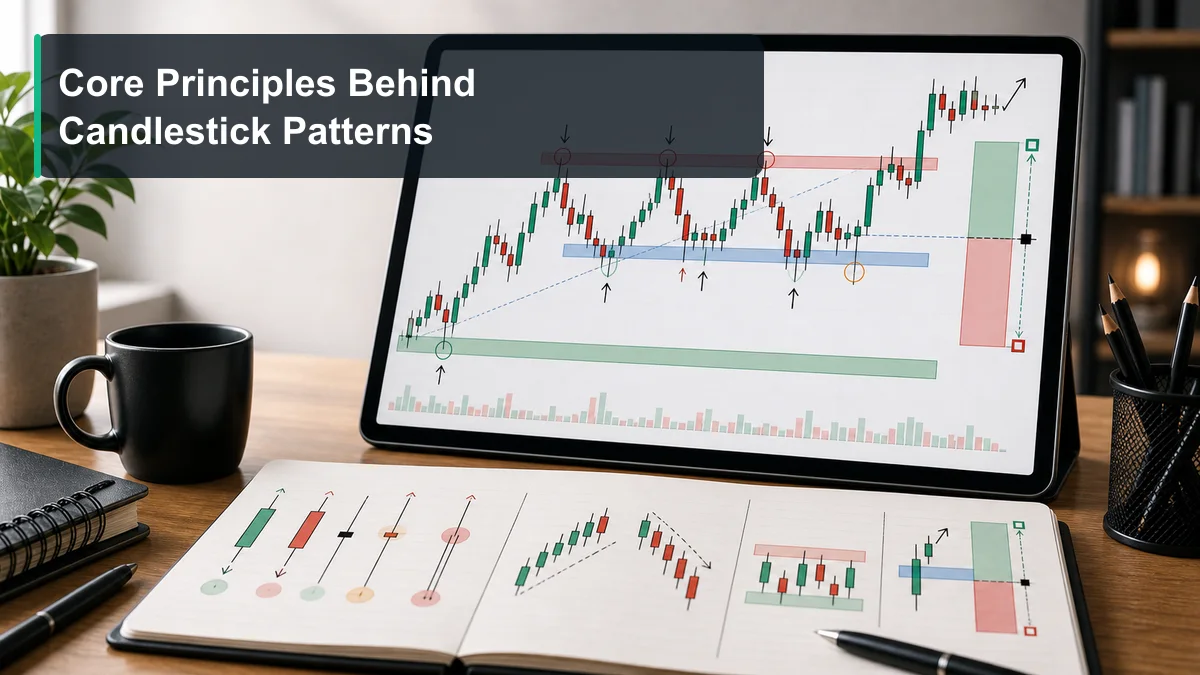
- Has the candle closed, and which timeframe is being analysed?
- Which range edge, swing or support/resistance level contains the pattern?
- Are body and wick sizes unusual relative to a local baseline?
- What exact confirmation is required: a close, retest or follow-through?
- What behaviour invalidates the hypothesis, and what is the maximum risk?
If one answer is missing, use a neutral description rather than forcing a pattern name. This keeps the hub educational instead of turning it into a signal catalogue.
Frequently Asked Candlestick Questions
Can one candle confirm a reversal? No. It records one period; location and later behaviour are still unknown.
Does high volume confirm a pattern? Not independently. Spot-FX volume may be broker-specific tick volume and must be compared within one feed.
Should a beginner memorise every pattern? No. Start with a small set, study failures, and expand only when a real question requires it.
Selective Hub Route
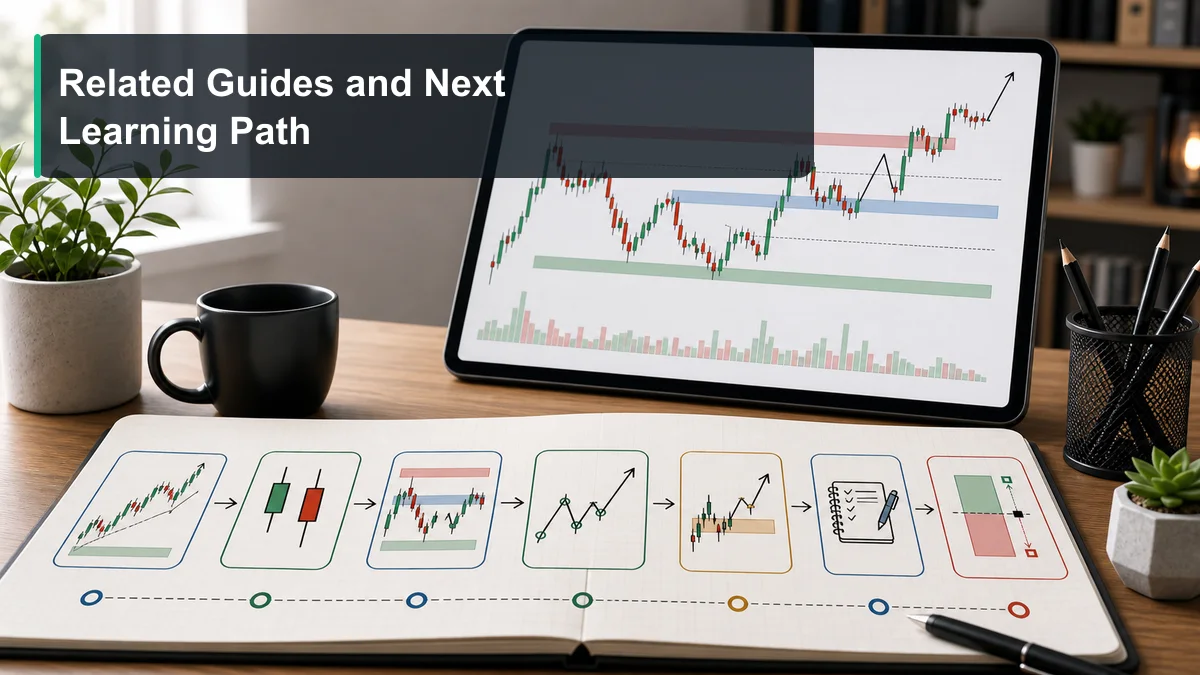
- Learn OHLC, bodies, wicks and closing location.
- Place the candle in trend, range and support/resistance context.
- Study reversal examples through the bullish and bearish pattern guides.
- Study continuation through inside-bar and breakout context.
- Review confirmation, invalidation and failed examples.
- Connect the pattern to position sizing and a journal.
Future pages about candlestick confirmation, Pin Bar, Inside Bar and Three White Soldiers/Black Crows should join this hub only after publication and canonical checks. The live hub intentionally does not link to scheduled URLs.
Key Takeaways, References and Risk Notice
- Candles encode OHLC; their shape does not guarantee the next direction.
- Location in a trend or range matters more than a memorable name.
- Reversal and continuation candidates need a completed close, confirmation and invalidation.
- Doji, engulfing, pin bar, inside bar and Marubozu have distinct definitions.
- Volume, structure and session are context, not independent triggers.
- Label charts as historical or illustrative and record source, timeframe and date range.
For leverage and loss context, read the CFTC Customer Advisory on Forex. Candlestick terminology is educational and does not guarantee outcomes.
Risk notice: This article is educational information, not investment advice or a solicitation to trade. Candlestick patterns can fail, and trading can result in losses, especially with leverage. Verify data, account for spread and slippage, and risk only capital you can afford to lose.
Selected pattern guides: Once the candle-reading workflow is clear, compare bullish candlestick patterns and bearish candlestick patterns in context; neither list is a standalone entry signal.