


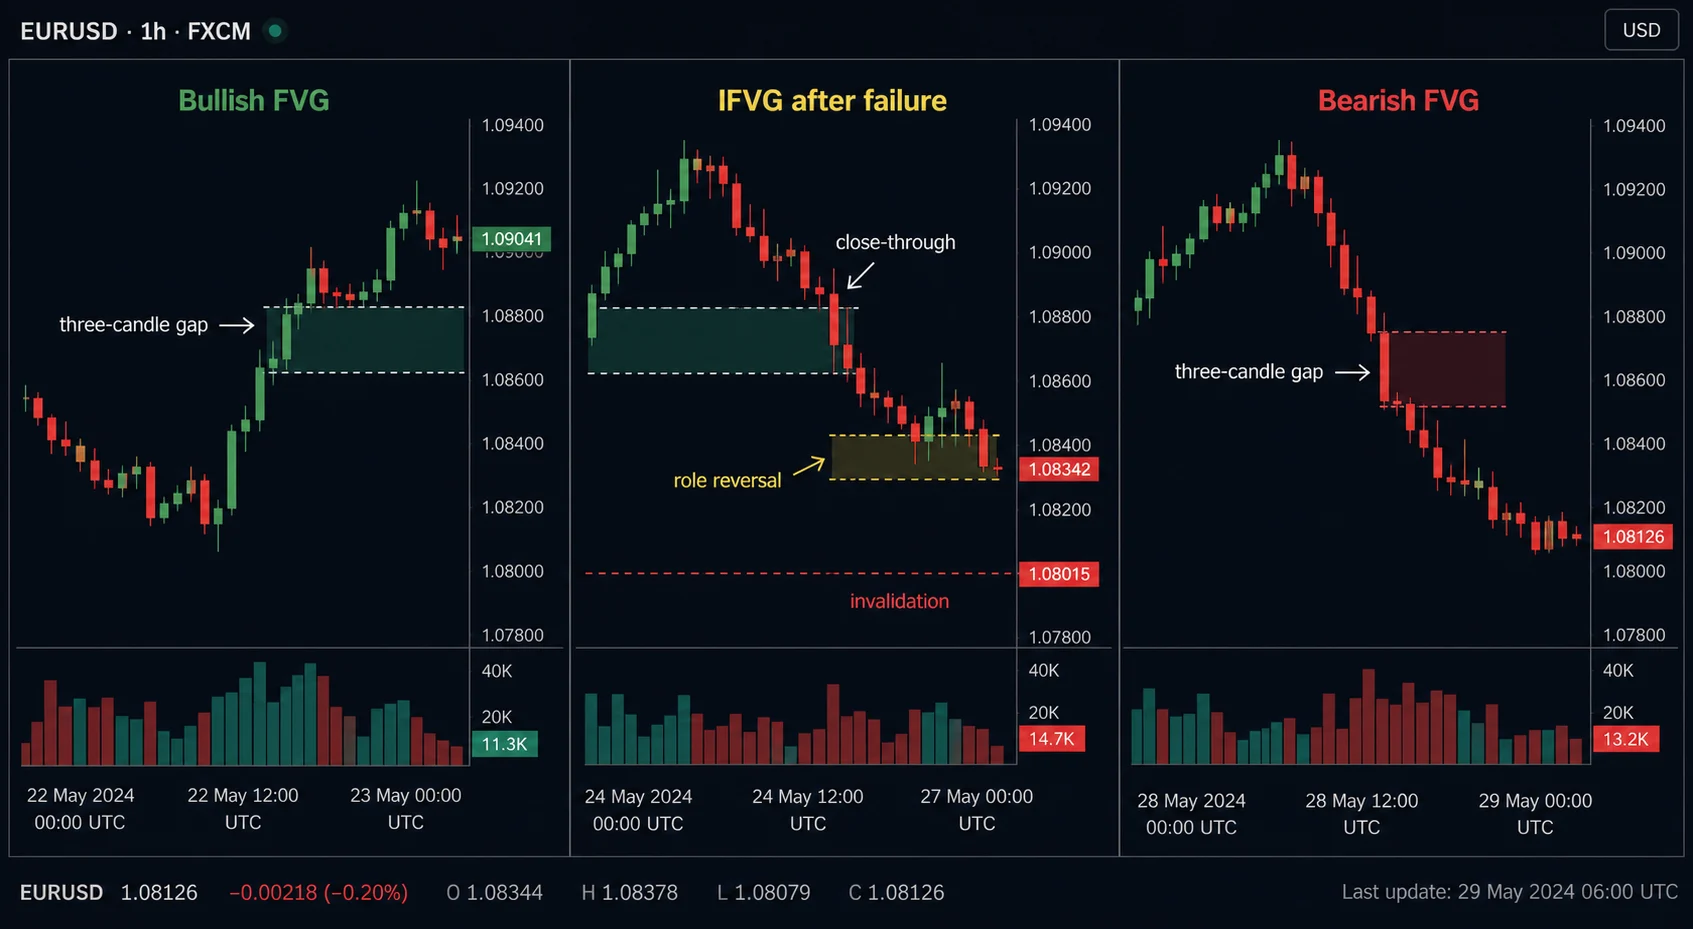
FVG and IFVG both describe imbalance, but they are not two names for the same state. An FVG is a three-candle gap created in the direction of displacement; an IFVG appears after that area is closed through and flips its role. This guide focuses on formation, retest and failure conditions as a complement to a basic FVG explainer.
How an FVG forms inside displacement
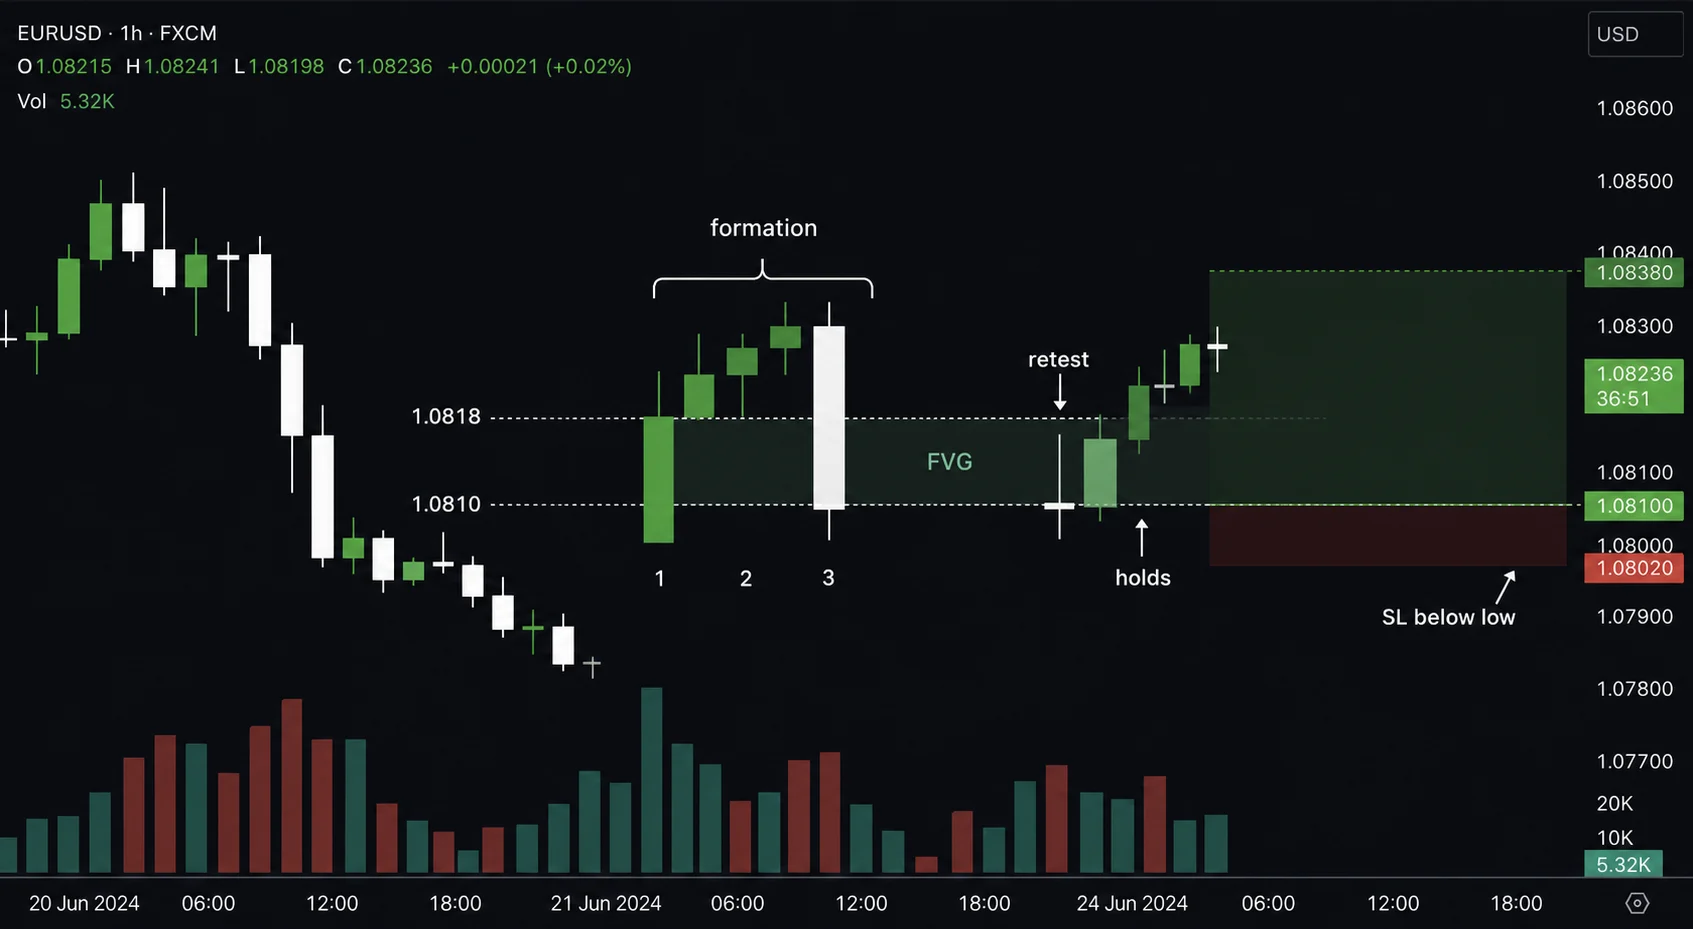
For a bullish FVG, compare candle 1 high with candle 3 low: when candle 3 low is above candle 1 high, the difference is the imbalance zone. A tiny gap is not automatically tradable; check context, the broken swing and the cleanliness of the zone. A bearish FVG is the inverse.
FVG vs IFVG: condition table
| State | Formation | Valid retest | Failure/invalidation | Role |
|---|---|---|---|---|
| Bullish FVG | Candle 3 low above candle 1 high | Price taps the zone and closes back above | Full close through the zone or protected swing | Potential support |
| IFVG after failure | The old FVG is closed through | Retest from below is rejected | Close back through the opposite side | Potential resistance |
| Bearish FVG | Candle 3 high below candle 1 low | Retest from below holds | Close above the full zone | Potential resistance |
A retest and failure example
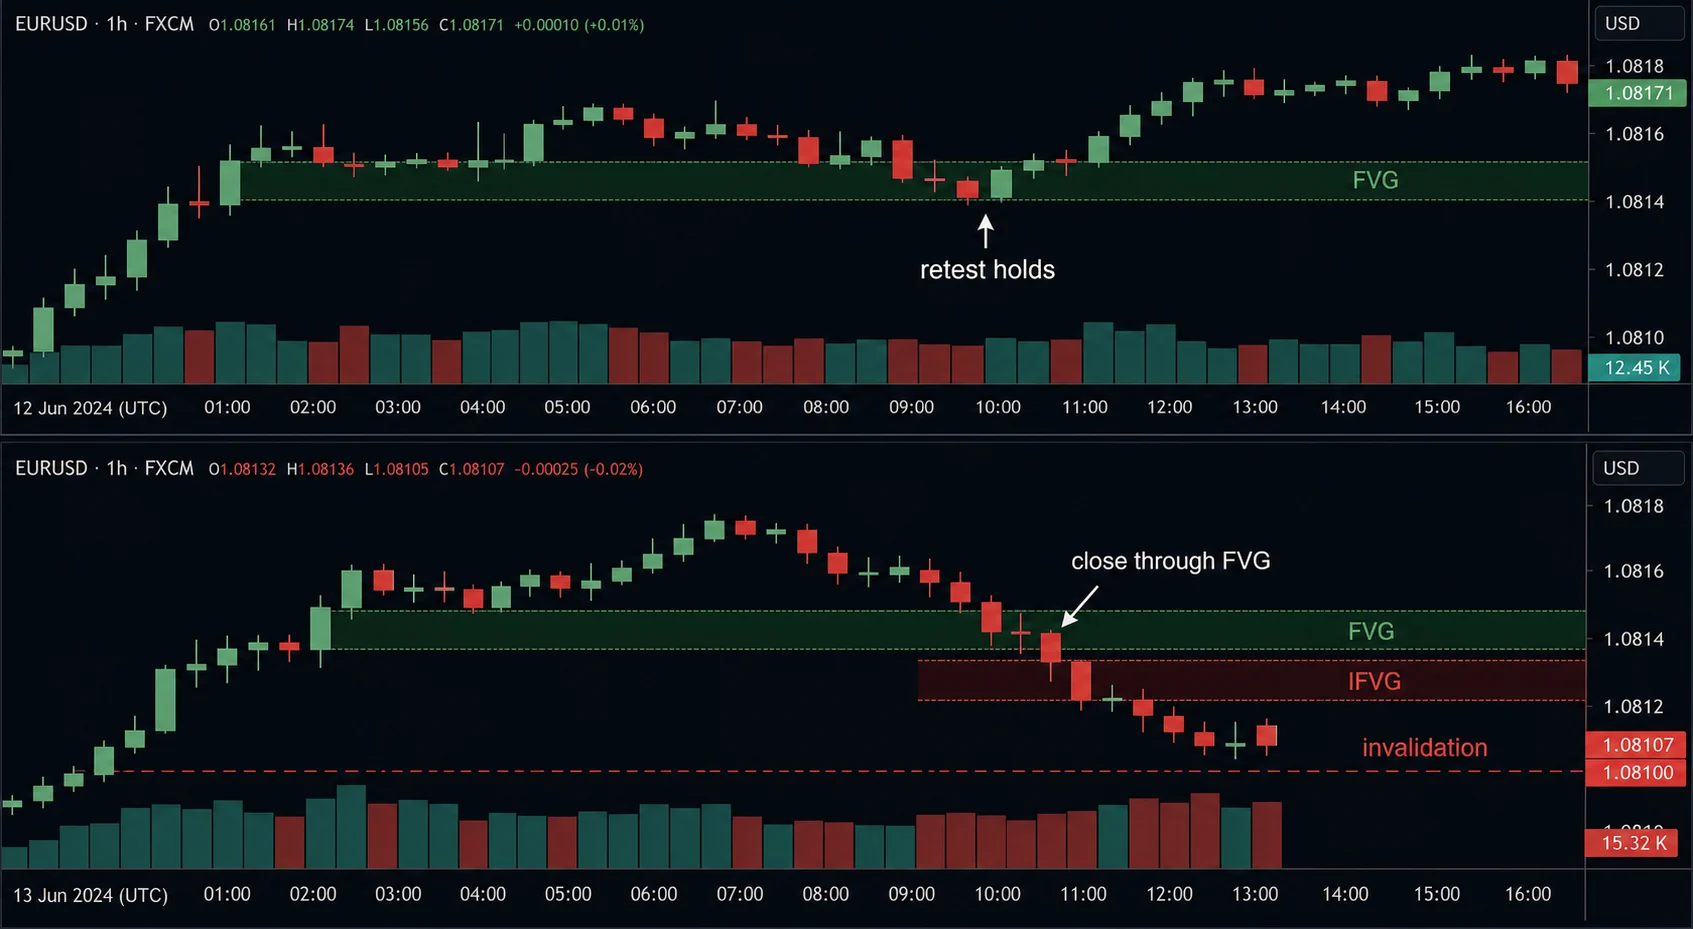
Assume a bullish FVG sits between 1.0810 and 1.0818. The 10:00 UTC retest taps 1.0812 and closes at 1.0820: the zone holds. If a later H1 candle closes fully below 1.0810, the bullish FVG is invalidated. When price rallies back from below and rejects around 1.0814, it becomes an IFVG resistance candidate; define invalidation above the zone instead of assuming it must hold.
A checklist that adds detail without repeating a basic FVG guide
- Record which displacement and swing created the FVG.
- Measure the zone in pips rather than drawing an arbitrary box.
- Wait for a retest and evaluate the close, not the first touch.
- Place invalidation outside the zone according to structure, not a fixed distance.
- After a close-through, relabel the zone IFVG and test the role reversal.
Read MSS in SMC and Displacement in SMC to connect FVG behavior with break quality.
Frequently asked questions
Does a wick through an FVG create an IFVG?
Not necessarily. Use a clear close-through rule; a single wick may only be a liquidity sweep.
Must every FVG be filled?
No. “Filling the gap” describes behavior, not a guaranteed target. Manage the thesis with defined invalidation and tested data.
Editorial note: Học Làm Trader Editorial Team. Educational content only, not investment advice; no win-rate promises.
Worked example and limits
Direct answer: FVG versus IFVG is a comparison of how an imbalance is formed, revisited and interpreted after price trades through it. Neither label guarantees a fill, reversal or continuation.
| Observation | Possible interpretation | Failure |
|---|---|---|
| Three-candle displacement leaves a gap | Possible FVG | Gap is defined inconsistently |
| Price trades through the original area | Possible inversion/IFVG hypothesis | Acceptance continues through the area |
Failure cases include naming a gap only after the outcome, ignoring age and timeframe, treating a thin-feed candle as market-wide evidence, or moving invalidation after the retest. No trade is valid when context conflicts, spread/news changes execution or the zone is too wide for the risk budget. Continue with the FVG guide, market structure, position sizing, risk–reward and risk management. Checked 16 September 2026.
Source and checked date: FVG/IFVG terminology is treated here as a practitioner chart model rather than proof of market intent. The technical-analysis framing was checked against CME Group technical-analysis education and the site’s FVG pillar on 16 September 2026.
Pingback: Liquidity Sweeps: Identification, Confirmation And Failure