


Backtest sample size is the number of independent, eligible trades used to evaluate a rule set. A larger count can reduce uncertainty, but it cannot repair biased data, duplicated signals, look-ahead errors or unrealistic costs. The useful question is not “how many trades guarantees a result?” but “what sample and uncertainty are appropriate for this strategy and dataset?”
Why sample size changes the confidence of a backtest
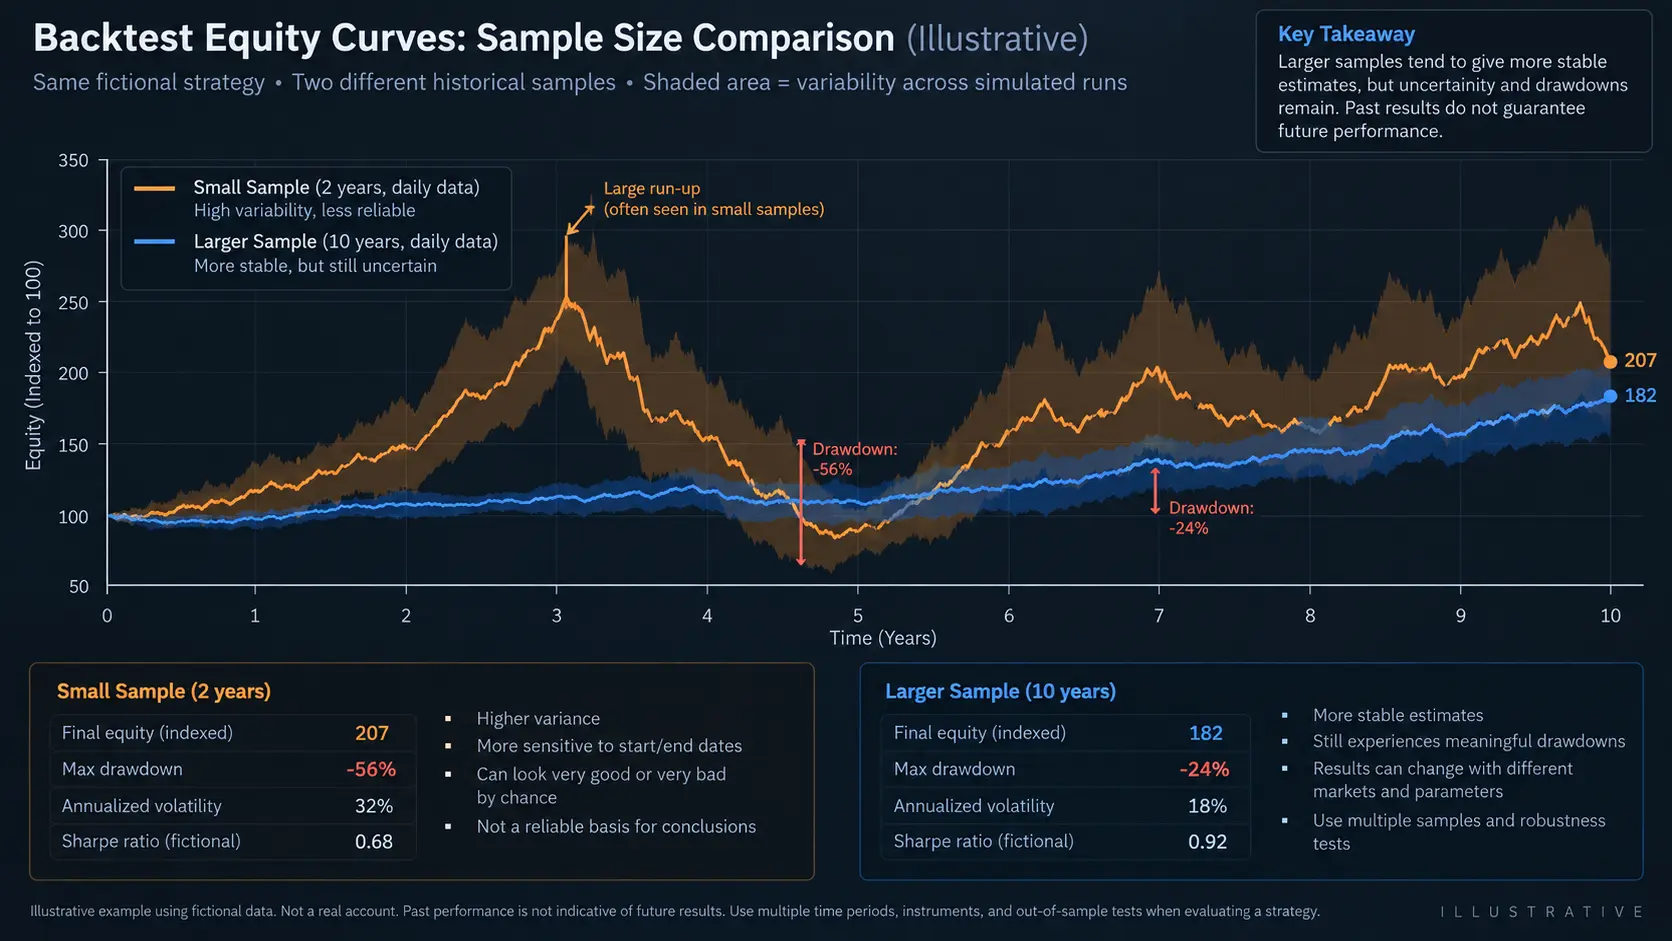
Every trade adds information only when it represents the same rule, market definition and execution assumptions. Independent trades across several regimes are more informative than many overlapping entries from one short episode. Record the symbol, timeframe, date range, signal frequency and whether trades overlap.
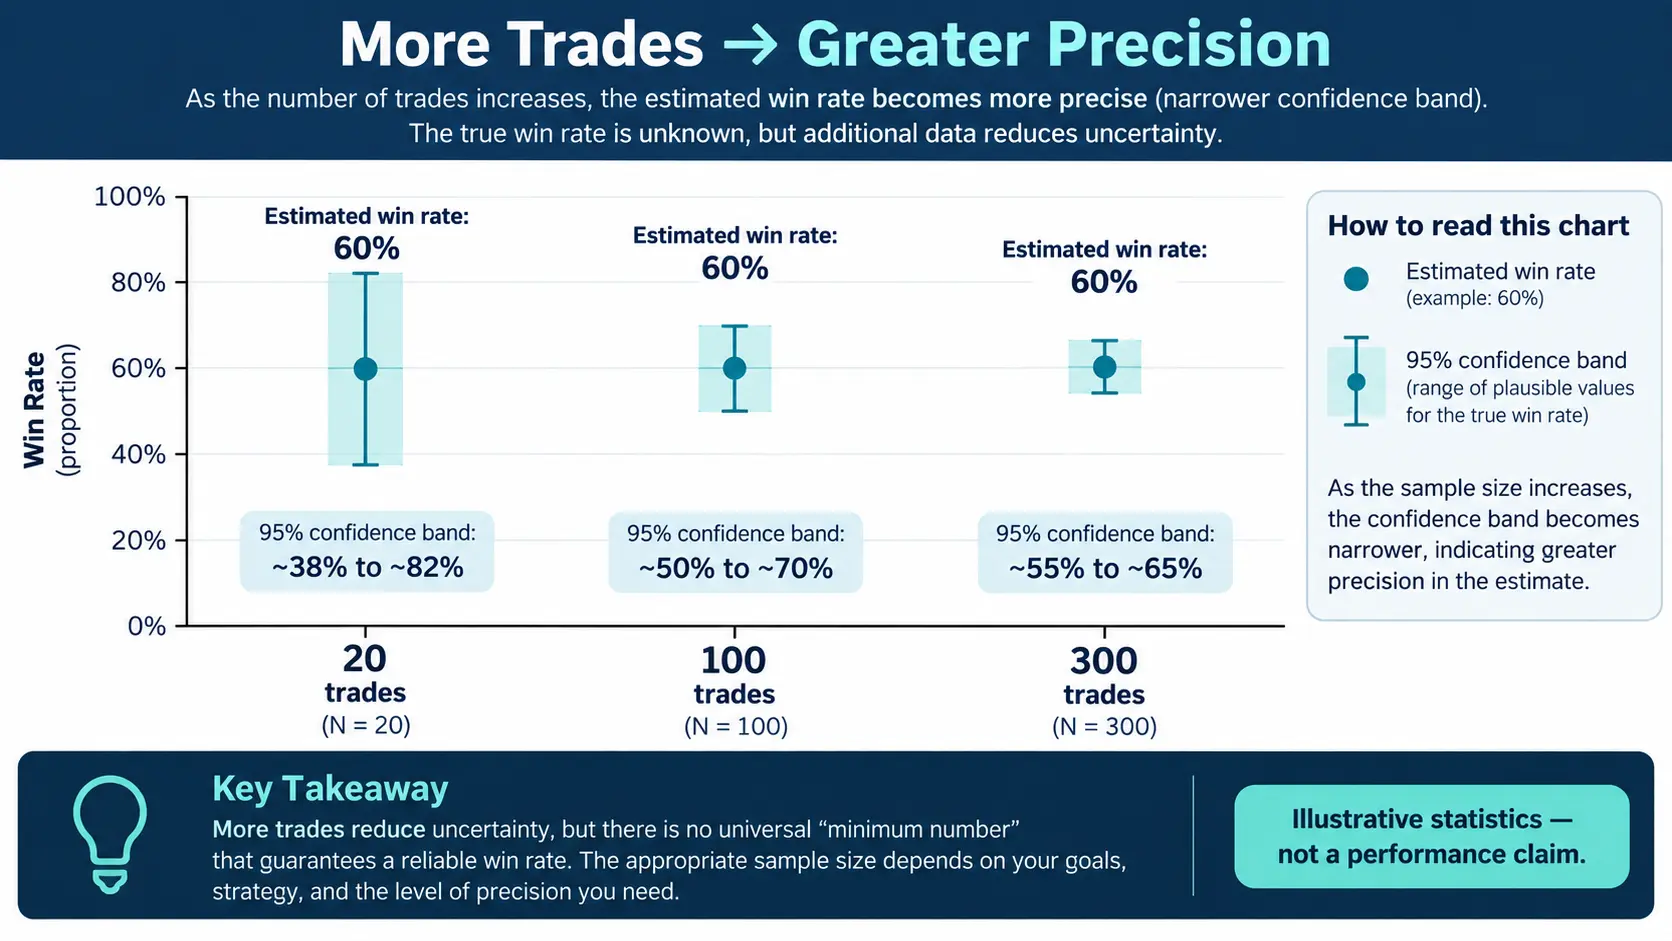
Uncertainty is more important than a magic threshold
| Question | Evidence to record | Why it matters |
|---|---|---|
| How variable are outcomes? | Distribution of R results and outliers | High variance needs more information |
| Are trades independent? | Overlap, pyramiding and signal clustering | Duplicate exposure inflates the count |
| Does the regime change? | Date and market-regime labels | One regime may not generalize |
| Are costs realistic? | Spread, commission, swap and slippage | Net results can differ from gross |
Use risk–reward definitions and position sizing to keep the outcome unit consistent. Sample size is a research design choice, not a promise of statistical certainty.
A practical sample-size design workflow
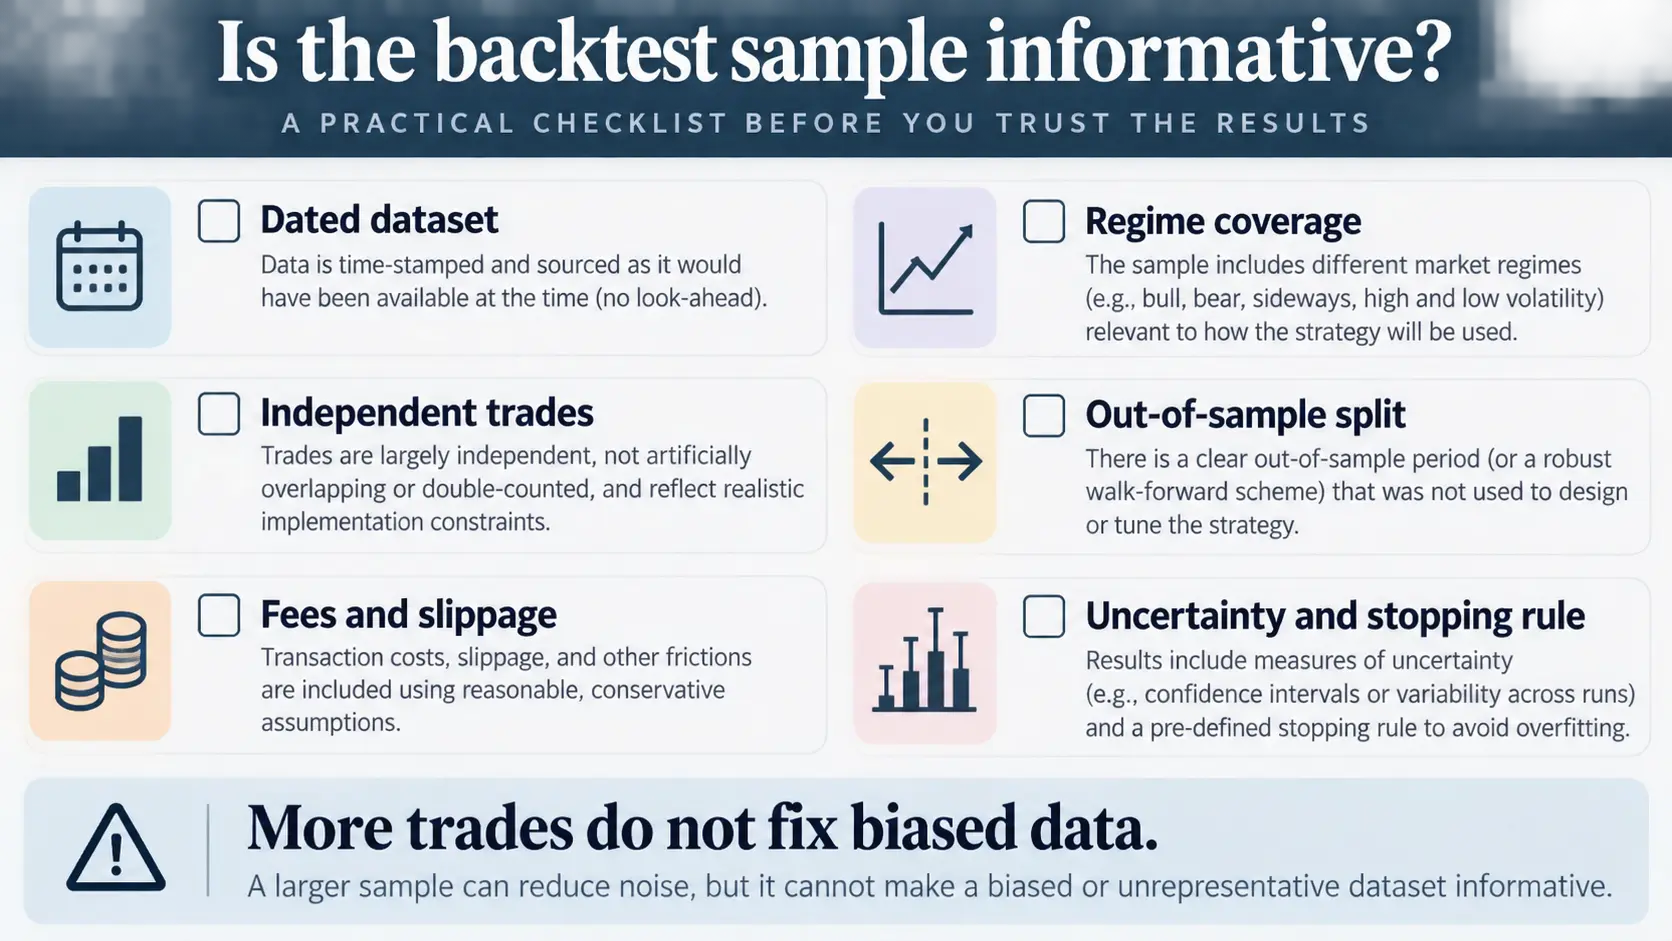
- define the hypothesis and eligible signal before selecting dates;
- choose a dataset that covers the intended market and timeframes;
- freeze rules, costs and exclusion criteria before counting trades;
- split development and validation periods and keep the validation sample untouched;
- report trade count, overlap, missing data, outliers and uncertainty alongside summary metrics.
Checklist before calling a sample informative
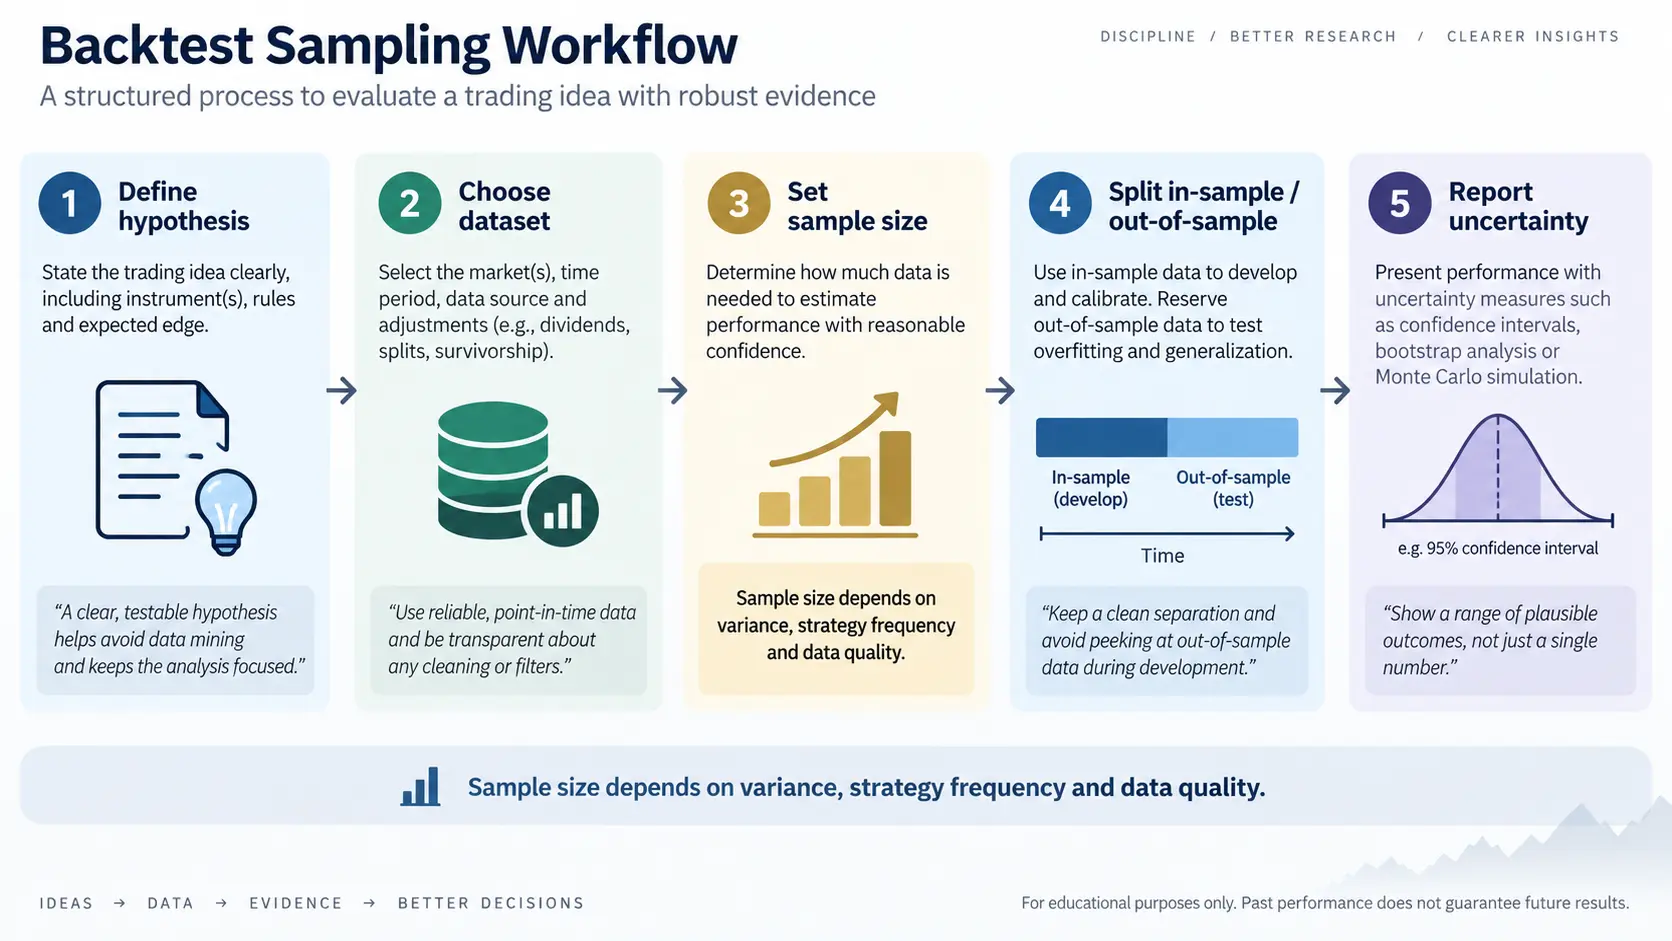
- do not count every bar if one position generates many dependent observations;
- avoid stopping the test when a favorable streak appears;
- compare results with and without plausible slippage assumptions;
- retain a dated holdout or forward test for a separate check;
- document the stopping rule before seeing the final curve.
Common mistakes
Calling 20 trades “proof”, treating 1,000 overlapping bars as 1,000 independent trades, or picking a sample after seeing the result are common errors. Formal confidence intervals can be useful, but their assumptions must match the data; use them as a description of uncertainty, not a guarantee.
An illustrative sample-size calculation
Imagine a fictional system with 60 eligible trades across three clearly dated market regimes. The first 20 trades show a wide range of outcomes; adding 40 more trades narrows the descriptive uncertainty, but it does not make the observations independent or representative automatically. If 30 trades overlap the same position, the effective information is lower than the headline count.
Report the count by symbol, regime and setup, then show how results change when plausible fees and slippage are included. Keep a holdout period untouched until the rules are frozen. If the sample is too small for a useful estimate, state that limitation and collect more observations instead of inventing a threshold.
What to include beside the trade count
A defensible appendix lists the data vendor, timestamp convention, missing bars, duplicate signals, overlapping positions, excluded trades, cost assumptions and the reason the period was chosen. These details often matter more than a round number such as 100 or 1,000 trades.
Risk note: This is educational content, not investment advice. Backtests are hypothetical and leveraged trading can cause losses. Validate data, costs and risk before relying on any result.