


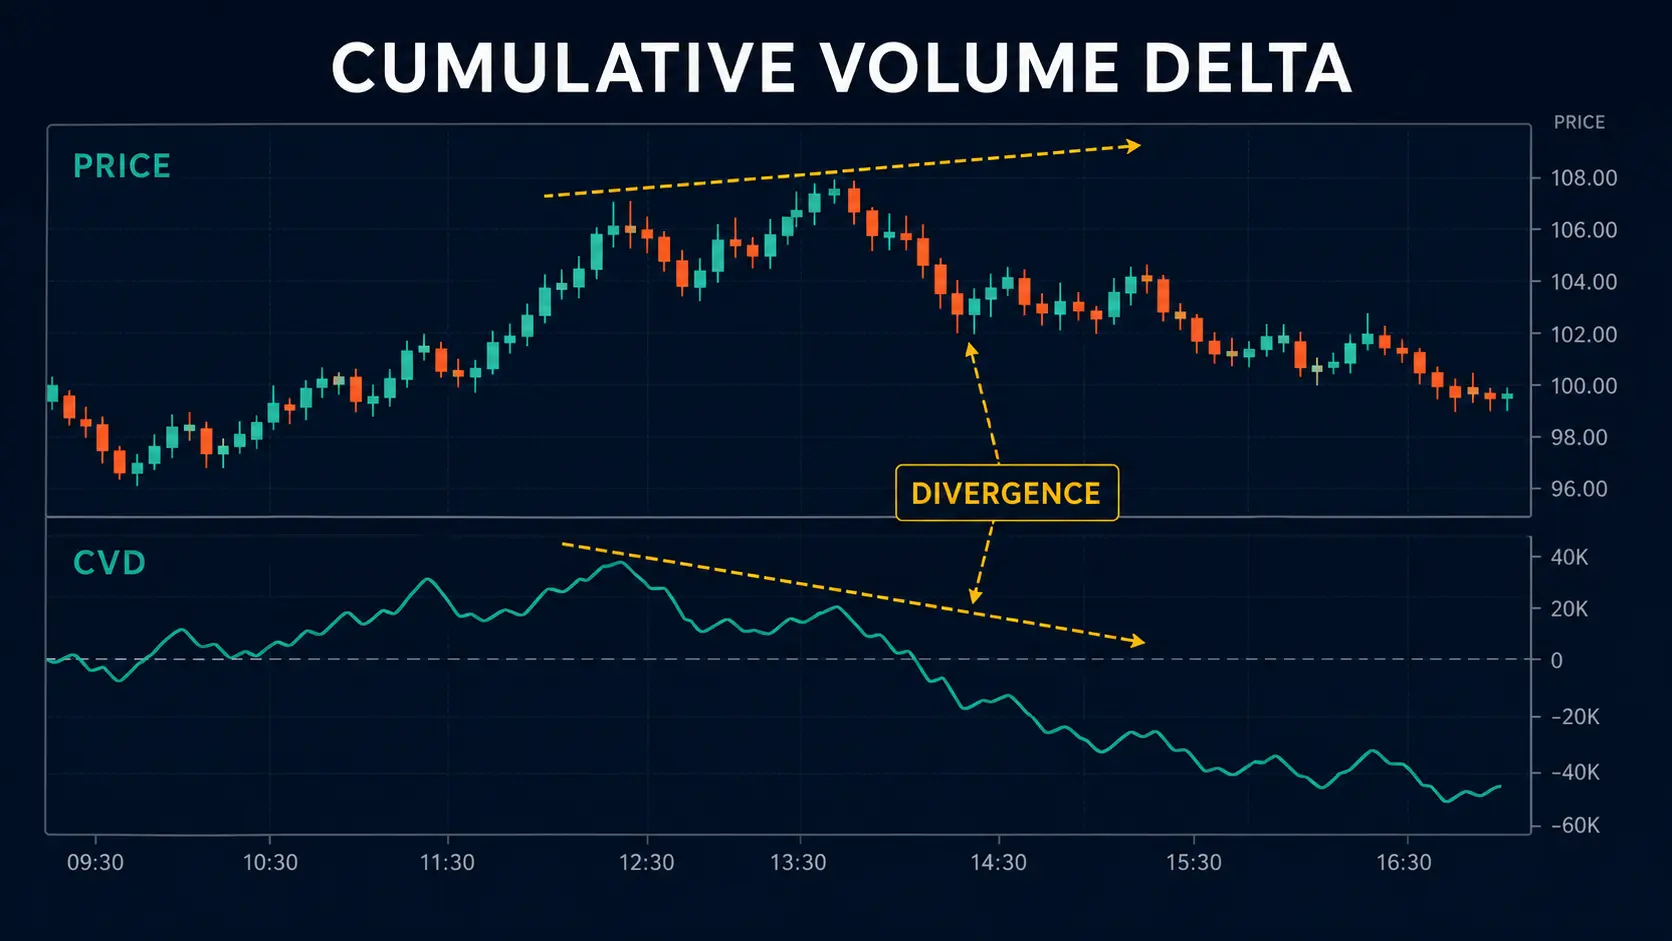
Cumulative Volume Delta (CVD) is a running total of signed volume, typically built by adding each period’s ask volume minus bid volume. Traders compare CVD with price to study reported aggressive buying or selling pressure and possible divergences. The result depends on the data feed, trade-classification method, session reset and market structure, so CVD should never be treated as a standalone signal.
Key takeaways
- CVD accumulates delta; a common delta convention is ask volume minus bid volume.
- The line can rise while price falls, or fall while price rises, but a divergence alone does not forecast reversal.
- Session reset, aggregation, instrument and feed all affect the line.
- CVD is most interpretable on data with clear reported trade volume and classification rules.
- Use price structure, location and risk controls to evaluate a hypothesis rather than trading the line mechanically.
What is Cumulative Volume Delta?
Each bar, time interval or trade sequence has a signed delta based on reported aggressive activity. CVD adds those deltas over the selected window. If the running total rises, the chosen data contains more ask-classified than bid-classified volume over that window; if it falls, the opposite is true. It is an aggregated observation, not a measure of every participant’s true position.
Bid/ask classification is the underlying concept behind footprint and delta-based tools. For broader foundations, use the site’s technical analysis foundations.
How is CVD calculated?
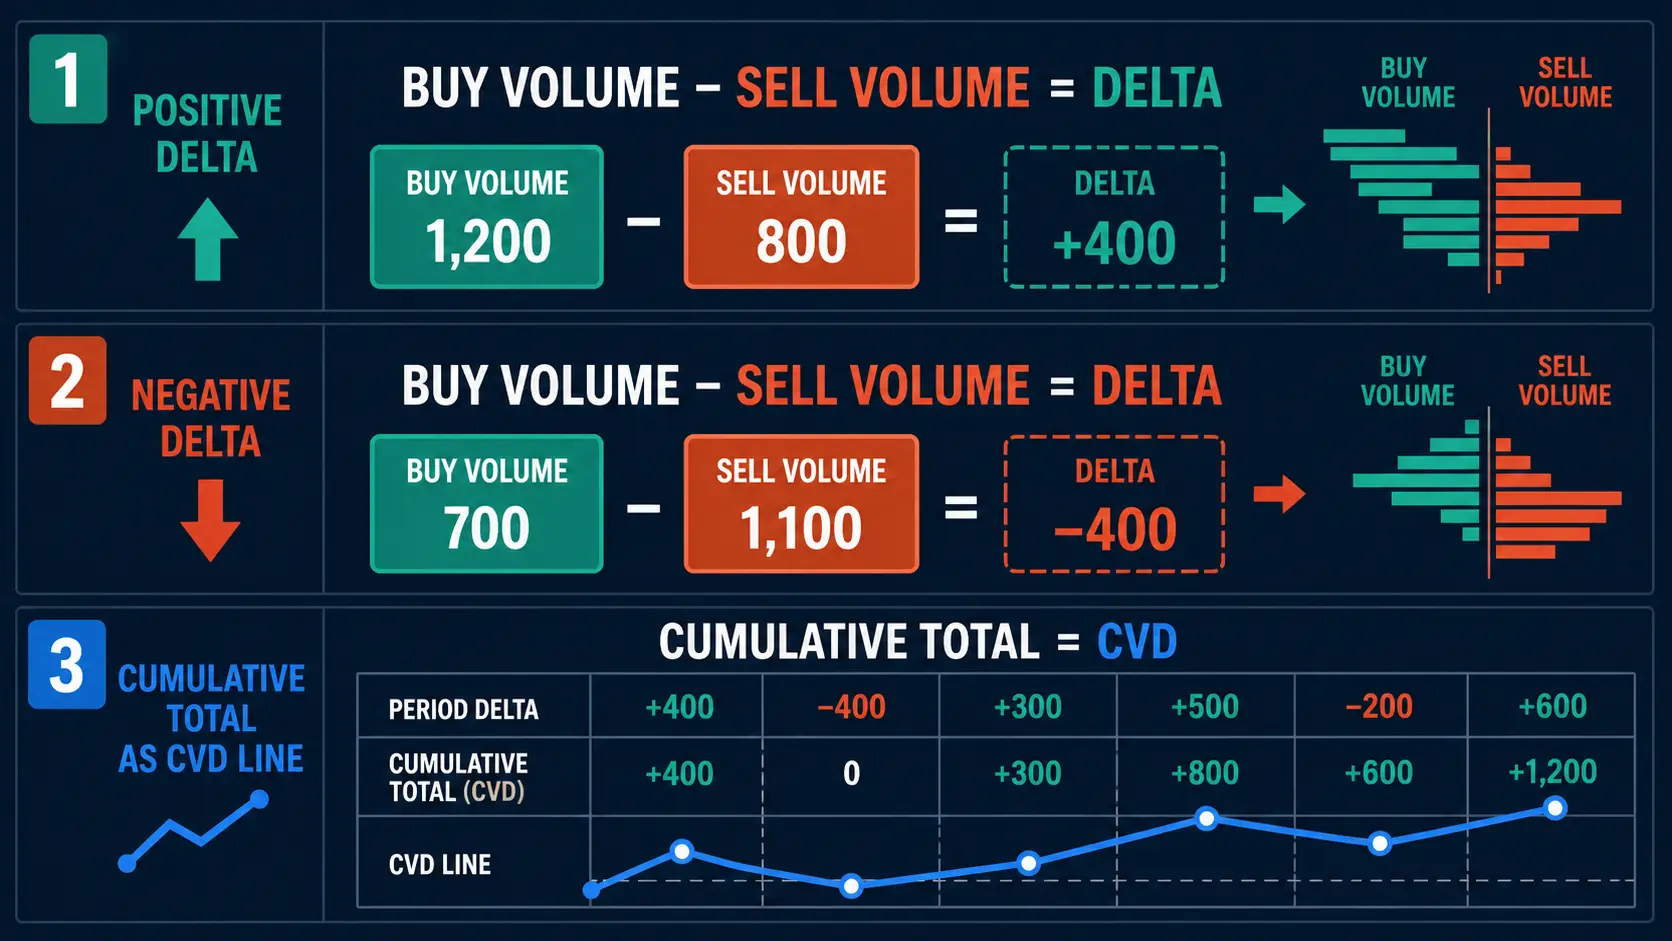
A simplified formula is: delta = ask volume − bid volume, then CVD(t) = CVD(t−1) + delta(t). Platforms may calculate or label the inputs differently, and a line can reset at the session, day, contract or custom anchor. These implementation choices must be part of any interpretation.
How to read CVD divergence
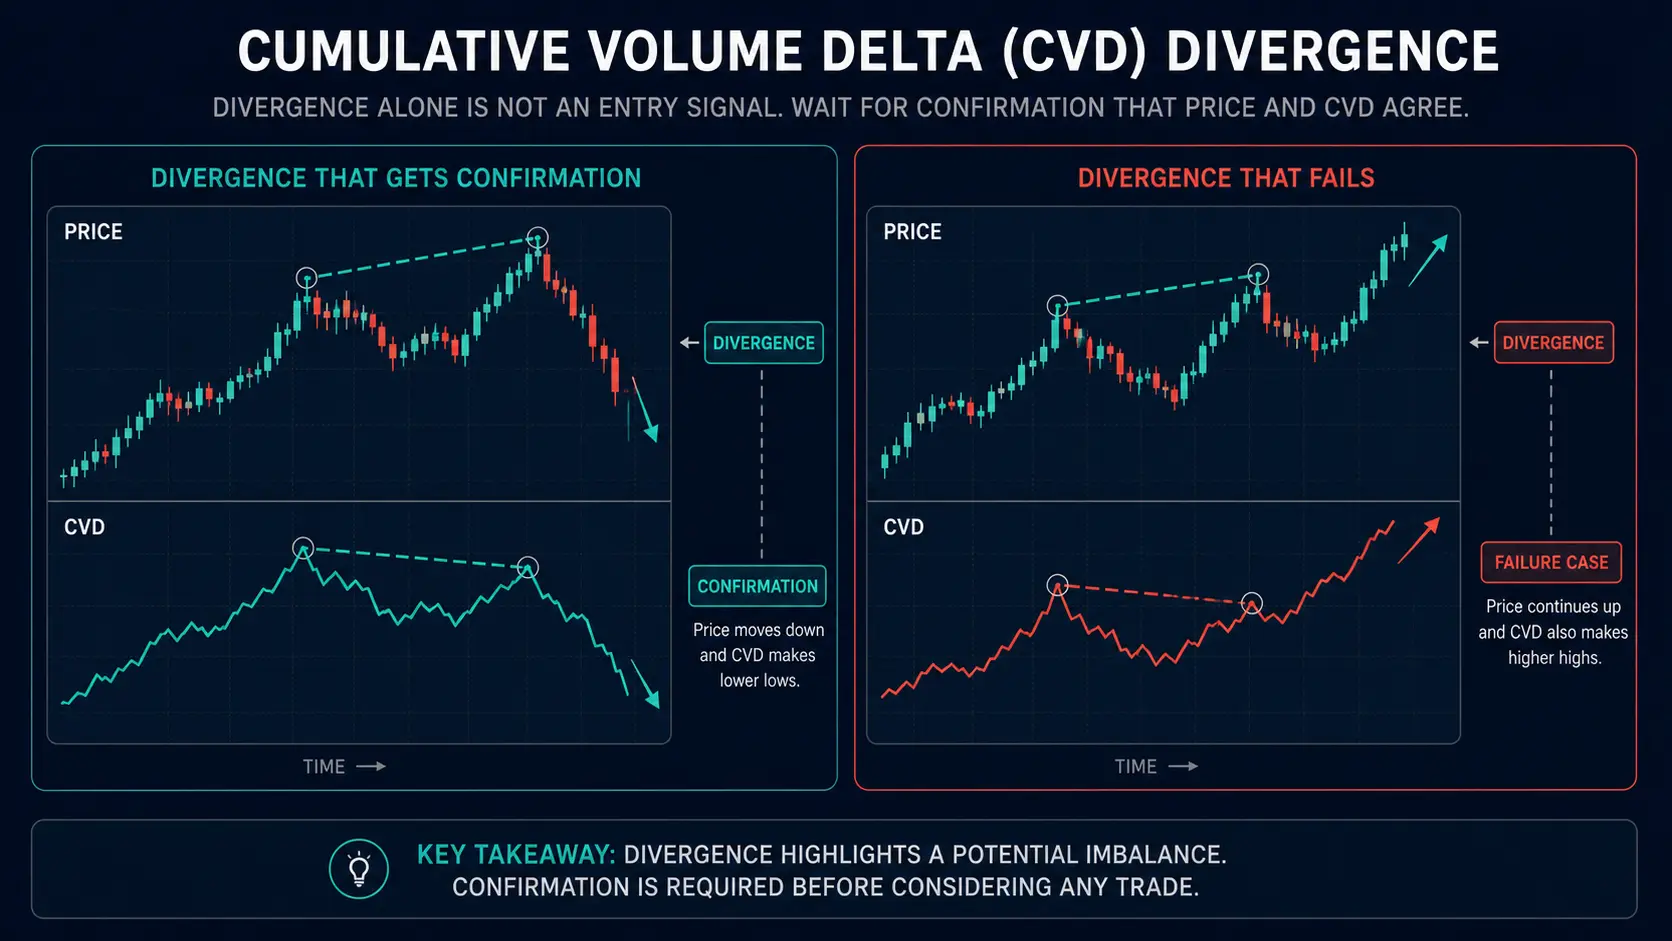
A bearish divergence is often described when price makes a higher high while CVD fails to make a corresponding higher high. A bullish divergence is the reverse. These are hypotheses about participation and price response—not instructions to trade against a trend. A divergence can persist, disappear after a session reset, or fail when the auction continues.
| Observation | Useful follow-up question | Unsafe conclusion |
|---|---|---|
| Price rises while CVD weakens | Does price reject a meaningful level or keep accepting higher prices? | Price must reverse now |
| Price falls while CVD improves | Is there evidence of failed downside continuation? | Buy immediately |
| CVD expands with price | Is the move occurring in liquid, relevant session conditions? | The trend is guaranteed |
Failure cases and confirmation
Before attaching meaning to a divergence, check the market location, price structure, news risk, session liquidity and the reaction after the level is tested. Confirmation may mean a defined structure change, a reclaim/failure at a level, or simply no valid setup. “No trade” is a valid outcome when the data does not support a clear scenario.
Data limitations: futures versus spot FX
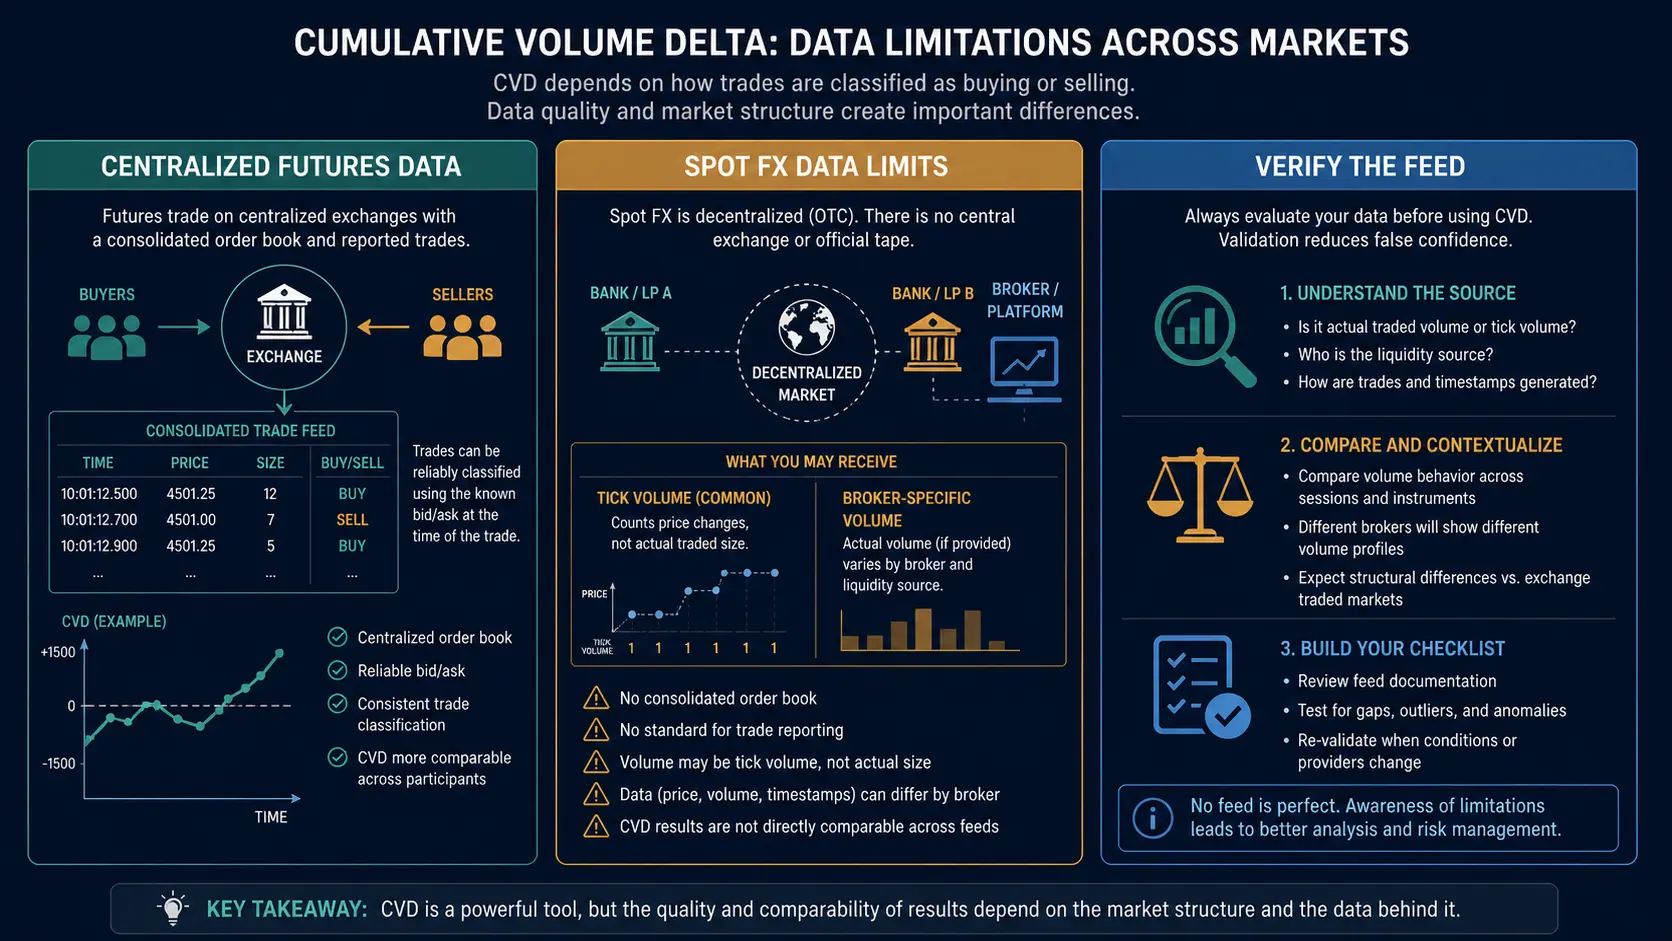
On centralized futures, the CVD represents the exchange/feed data used by the platform; it still depends on classification and aggregation. Spot FX has no single consolidated tape. A broker’s tick volume or internal liquidity data can be useful for that feed, but it is not the same as total global spot FX volume. State the instrument and feed whenever documenting a CVD observation.
Common mistakes
- Comparing a CVD line from one feed with price from a different market without noting the basis.
- Ignoring the session reset and then comparing lines that start at different points.
- Using divergence as a counter-trend entry signal without price confirmation.
- Assuming CVD shows passive/resting liquidity; it primarily describes classified executed flow.
- Overfitting a threshold or smoothing setting to a small historical sample.
FAQ
Is CVD the same as volume?
No. Total volume measures reported quantity; CVD is a signed running total based on how that volume is classified at bid and ask.
Does CVD work on crypto?
It can be calculated from an exchange or aggregated feed, but its meaning depends on venue coverage, perpetual/futures versus spot market, and the provider’s classification. Verify the feed before drawing conclusions.
Choose a consistent CVD reset and document it
A CVD line is not meaningful without its starting point. A session-reset CVD is designed to study activity within that session; a multi-day or anchored CVD answers a different question. Changing the reset only after seeing a divergence can manufacture a visually attractive result. Record the reset rule in your journal and keep it consistent across the examples being compared.
Price–CVD disagreement: a hypothesis, not a verdict
When price makes a new extreme while CVD does not, the observation may suggest that reported aggressive participation has not expanded in the same way. It can also reflect a different session, an incomplete feed, changing liquidity, a platform’s aggregation choices, or simply a trend that continues. A trader should therefore look for a clearly defined price response rather than attempting to call the turning point from CVD alone.
Use ordinary structure to make this check concrete. A lower high or lower low is visible on price itself; the guide to lower highs and lower lows helps separate a structural observation from an order-flow overlay.
A basic CVD journal template
| Field | Why it matters |
|---|---|
| Instrument and feed | Defines what volume the line actually represents |
| Session/reset rule | Makes CVD observations comparable |
| Location and market structure | Prevents isolated divergence reading |
| Price response after observation | Captures confirmation and failure cases |
| Execution conditions | Records spread, slippage and practical risk |
Combining CVD with volume and liquidity context
CVD can be one layer in a review that also considers total volume, the current session and nearby liquidity. It should not be used to claim that “smart money” is doing a specific thing. The liquidity in trading guide provides context on pools, sweeps and execution risk without making that leap.
Checklist for divergence examples
- Use the same feed, reset rule and aggregation for all examples.
- Mark the price level and structure independently of CVD.
- Write down what would count as confirmation and what would count as failure.
- Include fees, spread and plausible slippage in any performance review.
- Do not generalize a few attractive divergences into a repeatable edge without testing.
Sources and further reading
- VolSys — volume, bid/ask and delta documentation
- Bookmap — CVD and order-book tools overview
- CFTC — retail FX information
Risk disclosure: This article is educational information, not investment advice or a solicitation to trade. Order-flow tools, historical examples and chart patterns have limitations and do not guarantee future results. Trading can result in loss of capital. Assess your own risk tolerance and verify the quality and scope of the data before acting.