


Gann box trading is a technical analysis method that uses a price-time grid to study how a market moves after a meaningful swing. Instead of looking only at horizontal support and resistance, the Gann Box also asks whether price is moving in rhythm with time, reacting near geometric divisions, and respecting angles that describe trend speed.
Quick answer: Gann box trading means placing a rectangular grid over a major swing high and swing low, then using its horizontal levels, vertical time divisions, diagonal angles, and midpoint areas to plan context, confirmation, invalidation, and targets. The tool is most useful when it is anchored to a clean swing and supported by price action confirmation.
This article is part of the THEORIES hub and the Gann Theory category. If you want the broader framework first, read the Trading Theories complete guide, then use this page as a focused cluster article on the Gann Box.
Nothing here is financial advice. Gann tools can help organize market behavior, but they do not predict the future by themselves. A grid is only useful when it improves your decision process and keeps risk visible.
For beginners, the safest way to learn the tool is to treat it like a planning overlay. First learn what the market is doing without the box. Then add the box and ask whether it clarifies the same story. If the tool adds context, keep studying it. If it only adds lines without improving the plan, remove it and return to structure.
Definition
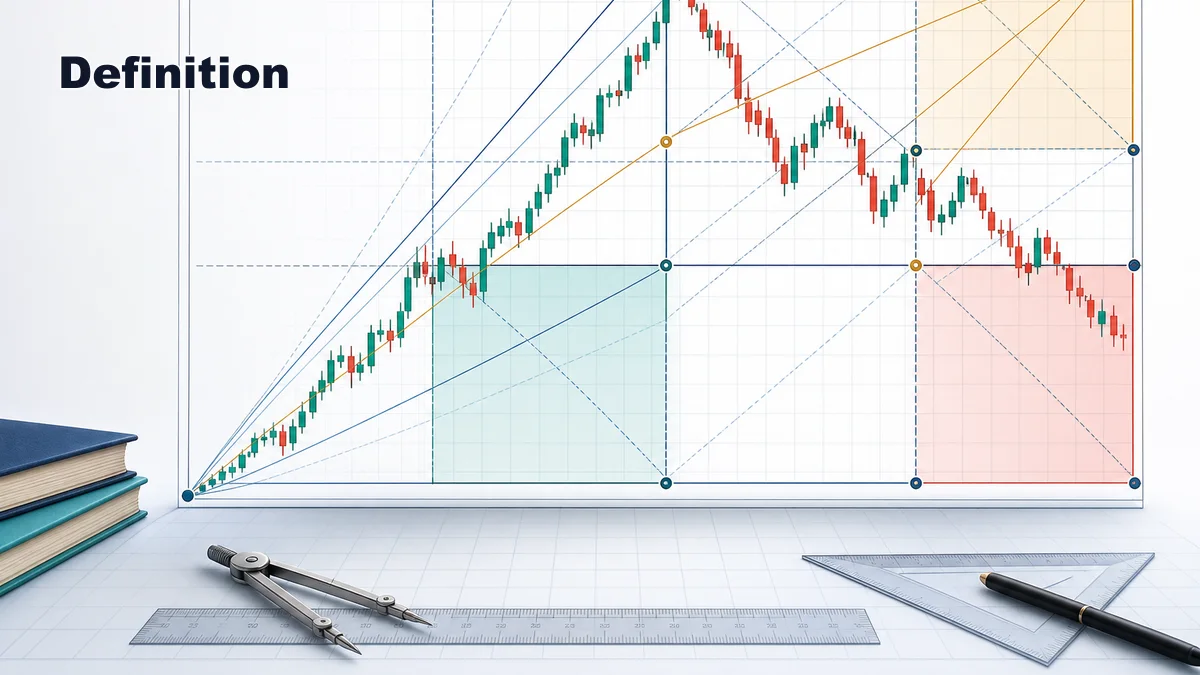
The Gann Box is a charting tool that divides a selected price swing into proportional price and time sections. Traders usually draw it from an important low to an important high in an up move, or from an important high to an important low in a down move. Once placed, the box creates horizontal price levels, vertical time intervals, and diagonal lines that can act as reference areas.
The main idea is simple: price does not move only through levels; it also moves through time. A support level that appears at the same time as a key vertical division and a diagonal angle may carry more planning value than a level that appears alone. The Gann Box gives traders a structured way to look for that kind of confluence.
A Gann Box is not a signal. It is a map. The box can show where price may react, where a pullback may pause, where a trend may accelerate, and where a trade idea may become invalid. The trader still needs market structure, candle behavior, volume if available, and a clear risk plan before taking action.
The word “box” is important because the tool is bounded. You are not drawing endless lines across the whole chart. You are studying one selected campaign: the move from one meaningful extreme to another. This keeps the analysis connected to a real swing instead of turning the chart into a collection of unrelated angles.
Some traders use the Gann Box for retracement planning after a strong impulse. Others use it to compare trend speed as price moves from one section of the grid to another. A conservative trader can use it simply as a way to mark decision zones and avoid chasing candles in the middle of nowhere.
How to Identify
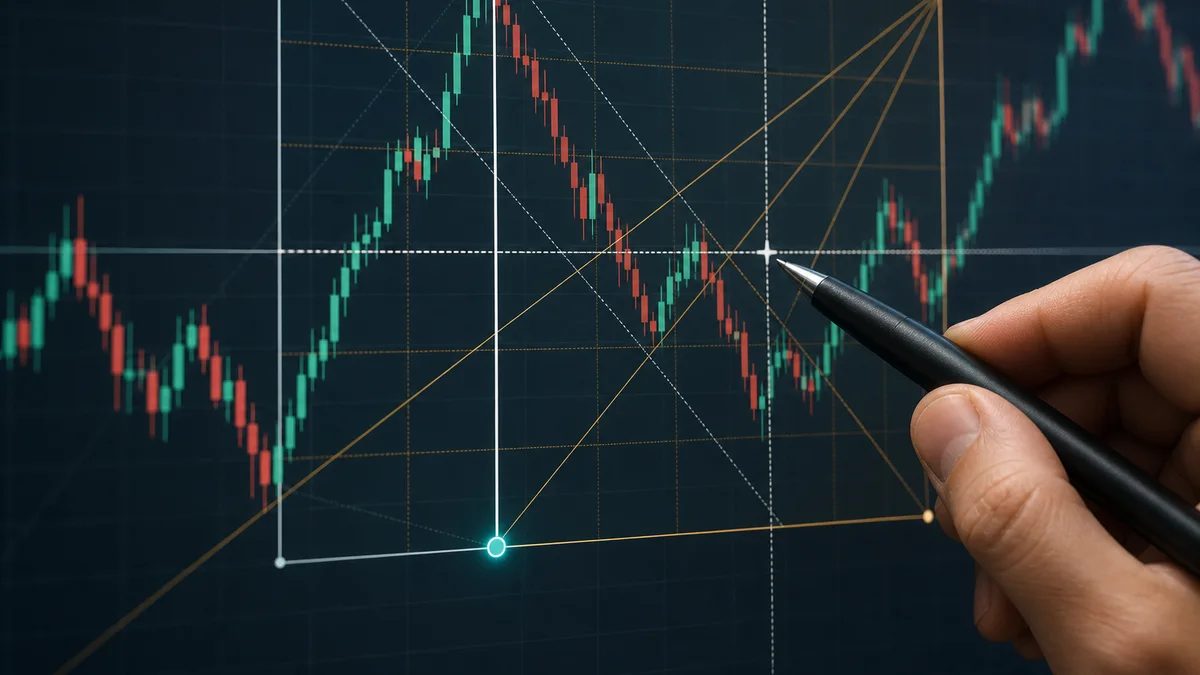
The most important part of Gann box trading is choosing the anchor swing. A strong anchor should be obvious when you zoom out. If you have to debate whether a candle is important, it is probably not the best anchor. Look for a major impulse leg, a clean trend swing, a clear high-to-low move, or a range breakout that created a new directional phase.
In an uptrend, many traders draw the box from the swing low to the swing high of the dominant move. In a downtrend, they draw it from the swing high to the swing low. The box should cover the actual move you want to study, not the move you wish the market had made. Bad anchors create attractive but misleading geometry.
After the box is placed, study whether price respects the grid. Does price pause near the 50% area? Does a pullback react near a horizontal division? Does the trend accelerate or slow near a diagonal angle? Does a reaction appear around a vertical time division? These observations matter more than the drawing itself.
If price ignores the entire box, do not force it. The market may be in a different rhythm, the swing may be poorly selected, or the tool may not fit current conditions. Gann tools reward selectivity. They become dangerous when every chart is forced to look geometric.
Timeframe also matters. A box drawn on the daily chart should not be judged by every tiny five-minute candle. The higher timeframe box gives context, while the lower timeframe can provide entry timing. Mixing those roles is a common reason traders think the tool has failed when they are actually using the wrong level of detail.
Why It Works
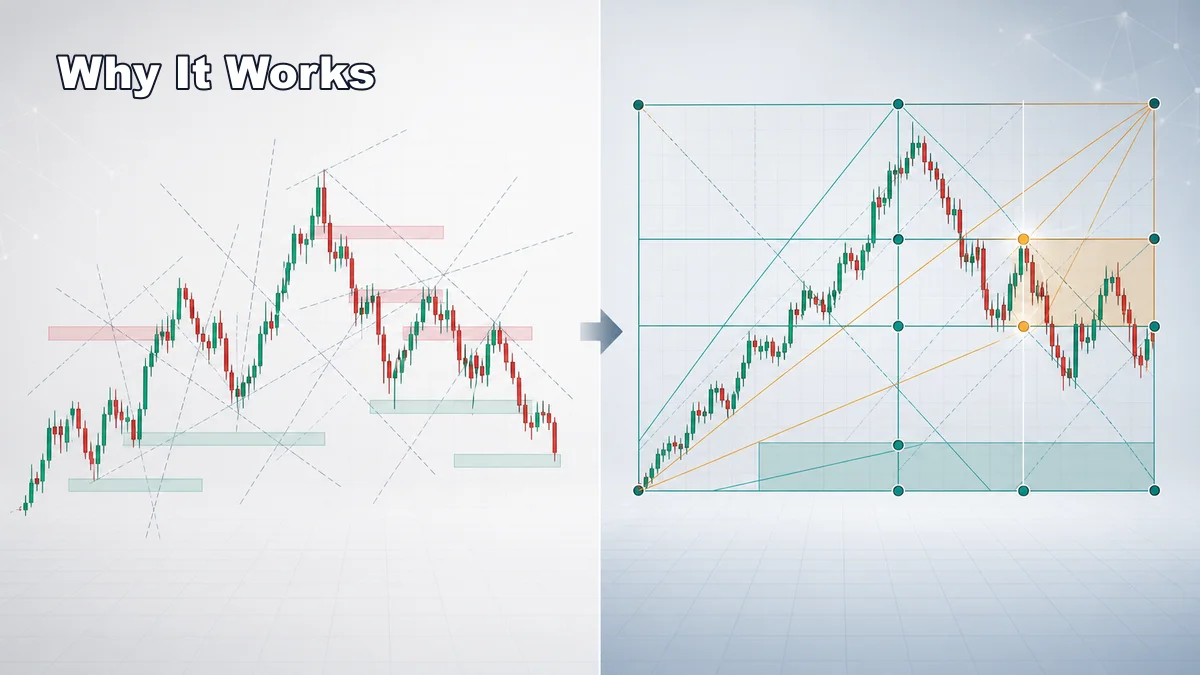
Gann box trading works best as an organizing framework. Markets often move in waves: impulse, pause, pullback, continuation, exhaustion, and transition. The Gann Box helps divide a wave into measurable sections so the trader can compare current behavior with the original swing.
It also encourages confluence. A horizontal level by itself may not be enough. A diagonal angle by itself may not be enough. But if price returns to a key grid level, reaches an angle, aligns with prior structure, and prints a clear rejection or breakout, the trader has a more organized decision area.
The tool can also improve risk management. Instead of entering because price touches a random line, a trader can ask whether the reaction confirms the thesis and where the idea fails. If price breaks through the expected reaction zone and cannot reclaim it, the box gives a clear reason to step back.
Another reason the tool is useful is that it slows the trader down. A trader who sees only a fast candle may react emotionally. A trader using a box can compare that candle with the broader swing, the next level, the angle of movement, and the remaining room to target. That pause often improves decision quality.
Still, the Gann Box should not be treated as a secret formula. Its strength is not prediction; its strength is structure. It gives the trader a repeatable way to ask the same questions each time price reaches a meaningful area.
Step-by-Step Usage
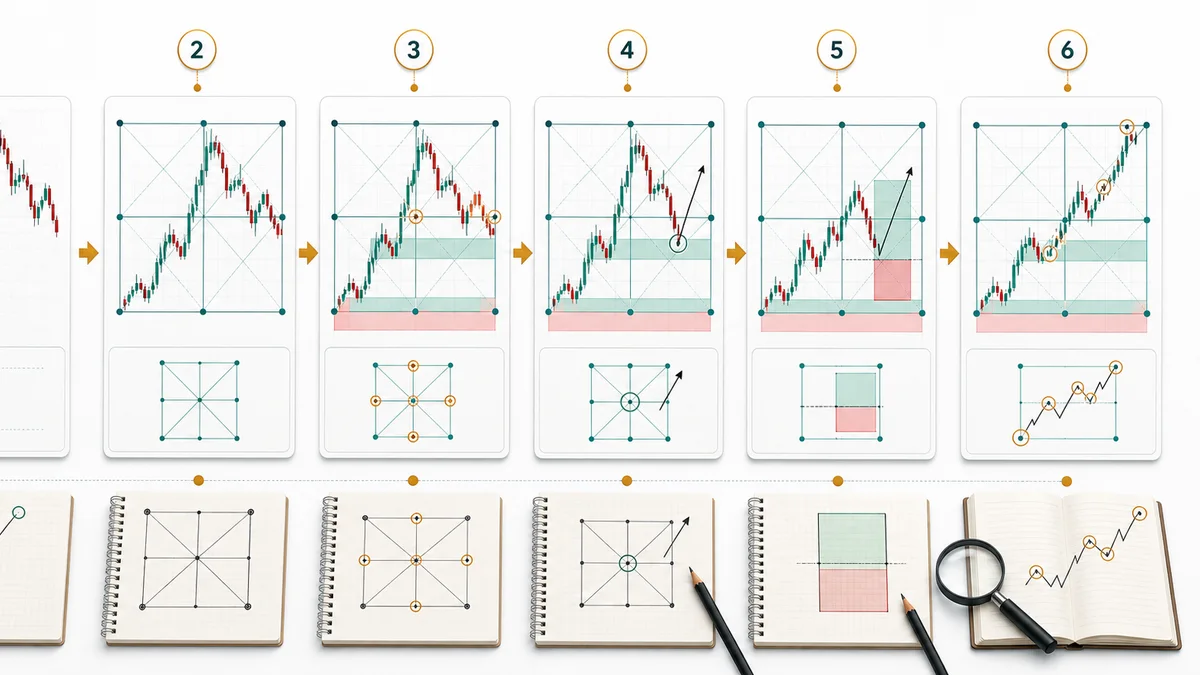
- Start with market context. Decide whether the market is trending, ranging, reversing, or expanding from compression. A Gann Box placed inside random chop usually creates more confusion than clarity.
- Select one dominant swing. Use a visible high and low that define the move you want to study. Avoid tiny intraday anchors unless you are specifically trading that timeframe.
- Draw the box cleanly. Anchor the tool to the swing extremes and make sure the box covers the move without stretching it to fit a bias.
- Mark the important divisions. Focus first on the midpoint, major quarter levels, diagonal angles, and areas where grid lines overlap with previous support or resistance.
- Wait for price interaction. Do not trade the box immediately. Let price approach a meaningful area and show whether buyers or sellers are defending it.
- Add confirmation. Use structure breaks, rejection candles, retests, volume behavior, or a lower-timeframe trigger to confirm the reaction.
- Define invalidation. Know where the setup is wrong before entering. A Gann Box should make the stop clearer, not wider and more emotional.
- Review the result. Save screenshots of clean reactions, failed reactions, and ignored boxes. Over time, this shows whether the tool fits your market and timeframe.
The best practical use is usually not to trade every line. It is to identify a small number of decision zones where geometry, structure, and risk align.
A useful routine is to create two screenshots before taking any trade. The first screenshot shows the clean chart with only major swings and levels. The second screenshot adds the Gann Box. If the second screenshot does not make the trade idea clearer, the setup may be too weak or the anchor may be wrong.
For swing traders, the box can be reviewed once per candle close on the chosen timeframe. For intraday traders, the same principle applies, but the anchor must match the session or impulse being traded. Do not draw a high-timeframe box and then use every small internal grid line as a scalping reason.
Confirmation Rules
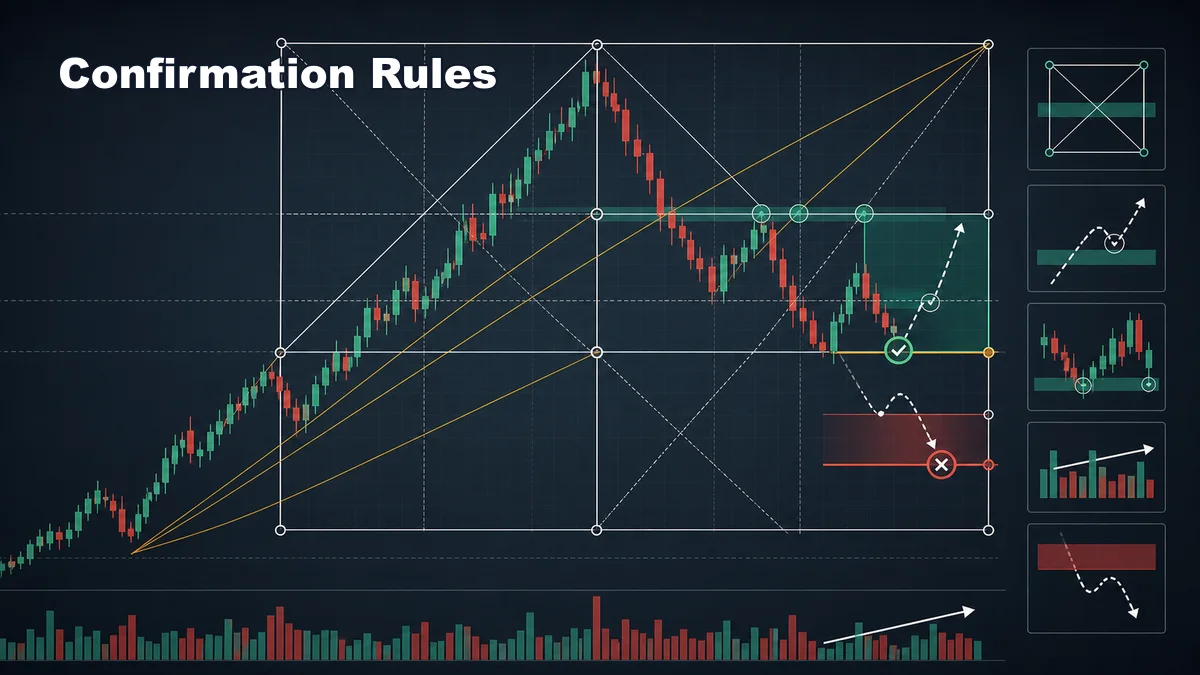
Confirmation is essential because a Gann Box can produce many possible levels. Without rules, a trader may find a reason to enter almost anywhere. A useful confirmation process should be simple enough to repeat.
- Anchor quality: the box should be drawn from a major swing that is obvious on the chosen timeframe.
- Level confluence: the reaction area should overlap with structure, prior support or resistance, a midpoint, a diagonal angle, or a clean retracement.
- Price reaction: wait for rejection, acceptance, breakout, retest, or failed continuation instead of trading the first touch.
- Structure support: bullish ideas are stronger when price holds higher lows; bearish ideas are stronger when price makes lower highs or fails to reclaim a level.
- Invalidation: every setup needs a level where the Gann Box read is wrong.
- Room to target: the next grid level or prior structure should offer enough room for the risk taken.
A clean rule set protects you from mystical chart reading. The box should support a trade plan, not replace the plan.
One practical filter is to require at least three pieces of evidence before acting: a meaningful grid area, a structural reason for the trade, and a visible trigger. For example, a midpoint pullback near old resistance is not enough by itself. If price also forms a higher low and breaks a minor pullback structure, the plan becomes more objective.
Examples
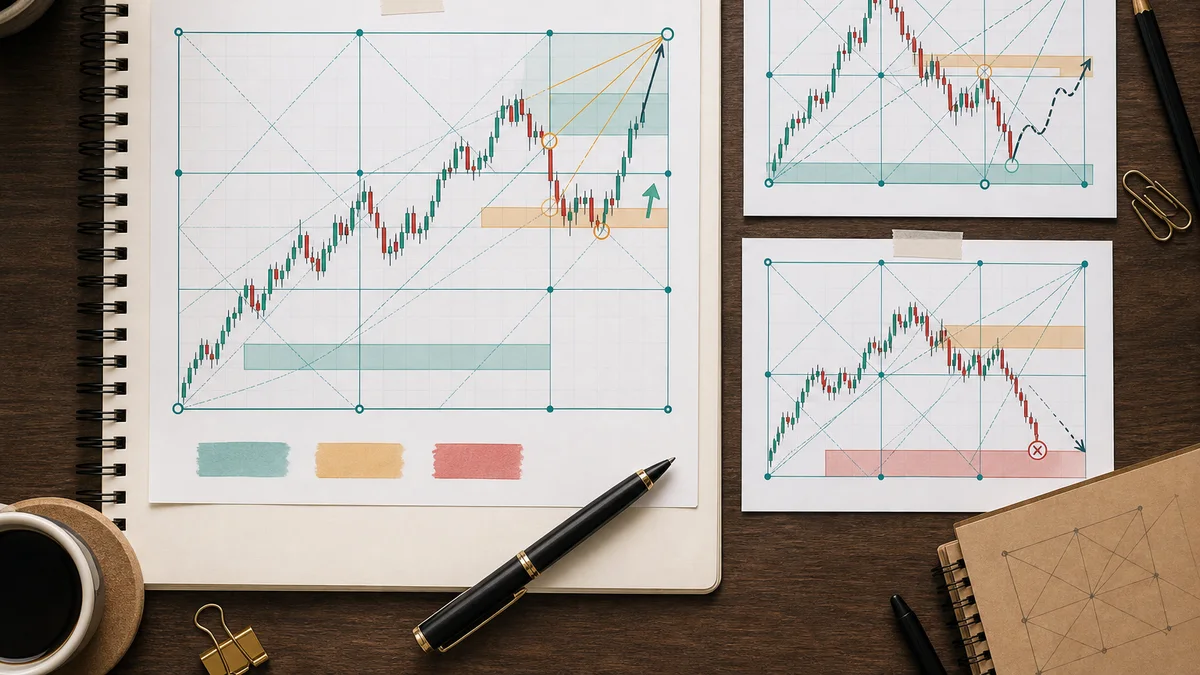
Imagine a market rallies strongly from a clear swing low to a clear swing high. You draw the Gann Box over that impulse. Price then pulls back toward the midpoint and a prior breakout area. If the pullback slows, prints a higher low, and breaks a minor bearish structure, the midpoint becomes part of a continuation plan.
In another example, price reaches a diagonal angle and a horizontal grid level at the same time. Instead of entering immediately, the trader waits. If price rejects the area and then retests it from below, the setup may become a bearish continuation idea with invalidation above the failed reclaim.
A failed example is just as important. Suppose price touches a Gann level, bounces weakly, then breaks through and accepts below it. That is not a hidden buy signal. It is evidence that the level did not hold. The correct action may be to skip, wait for a new anchor, or study whether the broken level becomes resistance.
Good examples share one feature: the Gann Box does not act alone. It works with trend context, structure, reaction behavior, and risk.
You can also use examples for post-trade review. Mark whether the box helped you wait, helped you avoid a poor entry, or gave you a cleaner target. If the box only made the chart look impressive after the fact, it did not add real value. Good tools should improve your next decision, not only decorate your last screenshot.
Common Mistakes
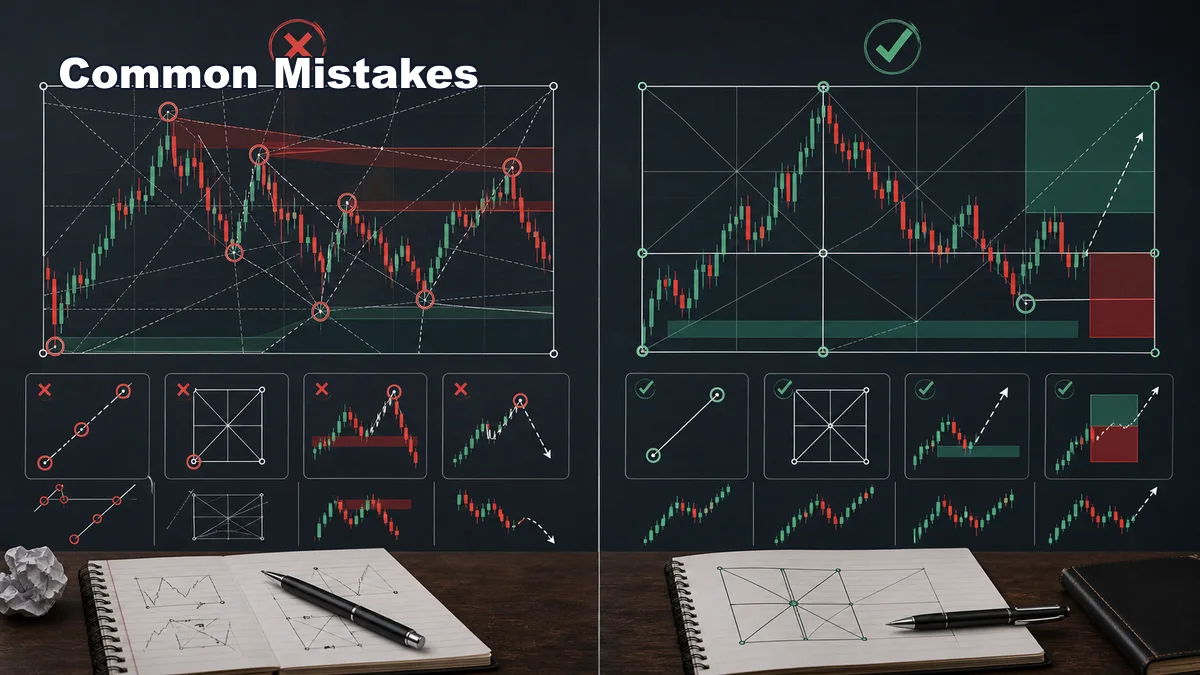
- Using weak anchors: a box drawn from minor candles often creates levels that look precise but have little market meaning.
- Forcing the tool onto every chart: not every market phase respects Gann geometry. Sometimes price action is too noisy.
- Trading every line: more grid lines do not mean more trades. Focus on the zones with context and confirmation.
- Ignoring trend structure: a bullish Gann reaction is weaker if the market is still making lower highs and lower lows.
- Moving the box after the fact: constantly adjusting anchors to fit price destroys the value of the analysis.
- No invalidation: if the box cannot tell you where the idea is wrong, the trade is not ready.
- Expecting magic timing: time divisions can be useful, but they are not guaranteed reversal dates.
Gann box trading is most valuable when it makes your analysis more disciplined. Use it after you understand basic trend, support and resistance, and market structure. Then connect it back to the THEORIES hub, the Gann Theory category, and the Trading Theories complete guide so it fits inside a broader learning path.
The best Gann Box traders are not the ones who draw the most lines. They are the ones who choose clean swings, wait for confirmation, define risk, and ignore the tool when the market is not respecting it.
Sources and limits
General market-risk and technical-analysis references:
Strategy labels and chart examples are interpretive; they are not standardized signals and do not guarantee outcomes.