


multi-timeframe analysis Multi-timeframe analysis assigns different jobs to higher and lower charts, usually context, setup and execution. The method does not require every timeframe to agree; it requires a written rule for what to do when trend, location and trigger conflict. The method should be treated as a testable chart-reading framework rather than a forecast. Before using it, define the market condition, confirmation event, invalidation price, transaction costs and maximum risk. This guide explains the rules, a repeatable workflow, common failure modes and the most relevant supporting concepts.
Definition: What Is Multi-Timeframe Analysis?

Multi-timeframe analysis, often shortened to MTF analysis, is the process of analyzing a market on multiple chart timeframes before making a trading decision. Instead of looking only at one chart, the trader studies how price behaves on a higher timeframe, a planning timeframe, and an execution timeframe.
The higher timeframe gives context. It answers questions like: What is the larger trend? Where are the major support and resistance zones? Is price near a weekly or daily decision area? Is the market trending, ranging, or transitioning?
The middle timeframe helps locate the trade idea. It may show a pullback, range boundary, breakout retest, liquidity sweep, or market structure shift. This timeframe often bridges the gap between the big picture and the actual entry.
The lower timeframe helps refine execution. It can show a candlestick trigger, minor structure break, smaller pullback, or more precise invalidation point. Lower timeframes are useful, but they are also noisy. That is why they should be used after the higher-timeframe context is clear.
For example, a swing trader may use the daily chart for bias, the four-hour chart for setup, and the one-hour chart for entry. A day trader may use the four-hour chart for context, the one-hour chart for setup, and the fifteen-minute chart for execution. A scalper may use the one-hour chart for context, the fifteen-minute chart for setup, and the five-minute chart for entry.
The exact combination depends on the trader, market, and strategy. The principle is the same: do not make a decision from one chart alone if a broader chart can change the meaning of the setup.
A useful way to think about MTF analysis is to separate role from timeframe. The highest chart is not always for entry. The lowest chart is not always for decision-making. Each chart has a job. One chart defines the environment, one chart identifies the trade area, and one chart helps time the execution. When traders mix these roles, they often become confused. They may see a lower-timeframe candle pattern and forget that the higher timeframe is still pushing in the opposite direction.
Multi-timeframe analysis is especially useful for price action traders because price action depends heavily on context. A support zone on a daily chart is not the same as a support zone on a five-minute chart. A bullish engulfing candle on a lower timeframe has more value if it appears at a higher-timeframe demand area. A breakout has more meaning if it breaks a level that is visible beyond the execution chart.
Core Principles of Multi-Timeframe Analysis
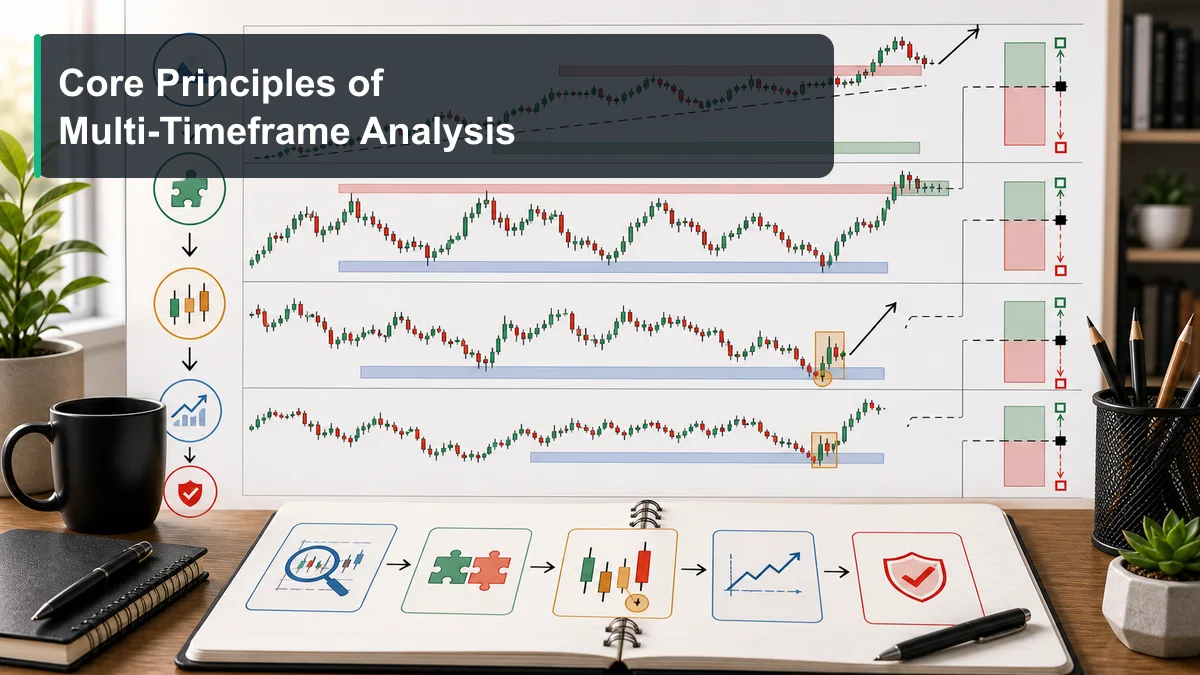
The best multi-timeframe analysis is simple. Beginners often make it difficult by opening too many charts and trying to make every timeframe agree perfectly. In reality, you only need a few core principles.
Higher Timeframe Controls Context
The higher timeframe usually matters more than the lower timeframe. If the daily chart is in a strong uptrend, a bearish five-minute pattern may only be a small pullback. If the weekly chart is at major resistance, a bullish intraday breakout may have limited room. Higher timeframes do not always win, but they shape the environment.
Lower Timeframe Refines Timing
Lower timeframes are useful for entry timing and stop placement. They can show the exact reaction around a higher-timeframe zone. However, a lower-timeframe signal should not override a strong higher-timeframe warning. The lower chart is a microscope, not the full map.
Alignment Improves Quality
Timeframe alignment happens when multiple charts support the same idea. For example, the daily chart may show an uptrend, the four-hour chart may show a pullback into support, and the one-hour chart may show bullish rejection. That does not guarantee a winning trade, but it creates a cleaner setup than a signal that fights the larger structure.
Conflict Means Caution
Timeframes do not always agree. The higher timeframe may be bullish while the lower timeframe is bearish. The market may be in a daily range but a strong one-hour trend. When timeframes conflict, beginners should reduce risk, wait for clarity, or skip the trade. Not every conflict needs to be solved immediately.
Do Not Use Too Many Timeframes
Two or three timeframes are usually enough. Too many charts create analysis paralysis. A trader who checks weekly, daily, four-hour, one-hour, fifteen-minute, five-minute, and one-minute charts may always find a reason to enter and a reason not to enter. Keep the stack simple.
Risk Must Match the Setup
A higher-timeframe setup may need a wider stop and more patience. A lower-timeframe setup may need a tighter stop but can be noisier. The timeframe you trade should match your account size, schedule, emotional tolerance, and risk plan.
Another principle is consistency. If you change your timeframe stack every time the market moves, your analysis becomes unstable. A trader who starts with daily, four-hour, and one-hour charts should not suddenly use a one-minute chart just to justify an entry. Consistency lets you collect comparable examples in your journal. Over time, you can see which timeframe combinations actually fit your strategy.
Finally, remember that alignment does not mean every candle must agree. A higher-timeframe uptrend can include lower-timeframe bearish candles during a pullback. A daily range can contain strong intraday trends. The skill is learning which timeframe controls the trade idea and which timeframe is only showing temporary noise.
Key Multi-Timeframe Patterns and Models
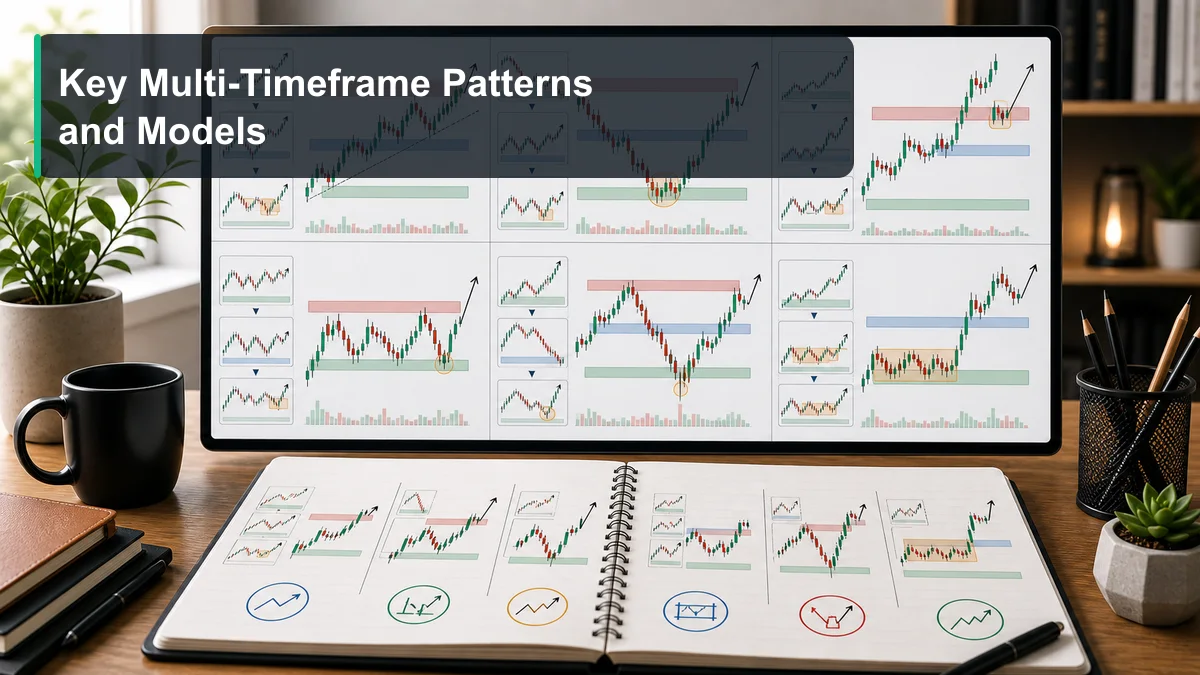
Multi-timeframe analysis is not one single setup. It is a way to organize several common trading models. These are the models beginners should learn first.
Trend Alignment Model
This model looks for the higher timeframe and lower timeframe to point in the same direction. For example, the daily chart is in an uptrend, the four-hour chart pulls back, and the one-hour chart starts turning bullish again. The trader is not trying to call a reversal. They are trying to join the larger trend after a smaller correction.
Pullback Into Higher-Timeframe Level
In this model, price pulls back into a higher-timeframe support or resistance zone. The trader then waits for lower-timeframe confirmation. A daily support zone may become the area of interest, while the one-hour chart provides the entry signal. This model is useful because it combines location and timing.
Breakout and Retest Model
A higher timeframe may show price breaking a major level. The lower timeframe can then show the retest. Instead of chasing the breakout candle, the trader waits for price to return to the broken level and react. This often creates clearer invalidation and better reward-to-risk.
Range Edge Reaction Model
If the higher timeframe is ranging, the trader may watch the range high and range low. Lower timeframes can show rejection, failed breakout, or reversal patterns near those edges. The key is not to trade signals in the middle of the range where direction is unclear.
Liquidity Sweep Across Timeframes
Some traders watch for price to sweep a higher-timeframe high or low, then look for lower-timeframe structure shift. This can connect multi-timeframe analysis with Smart Money Concepts. The sweep alone is not enough. The lower timeframe should show a meaningful reaction before the trade idea is considered.
Continuation After Consolidation
A higher timeframe may show a strong trend, while the lower timeframe shows consolidation. If the consolidation breaks in the direction of the higher-timeframe trend, traders may use that as a continuation setup. This model works best when the consolidation forms after a healthy pause, not after an exhausted move.
Higher-Timeframe Obstacle Model
This model is less about entering and more about avoiding weak trades. A lower-timeframe setup may look clean, but if price is directly under a higher-timeframe resistance zone, the upside may be limited. A bearish setup may look strong, but if price is already at weekly support, the trade may be late. Good MTF traders use higher-timeframe obstacles as filters.
Timeframe Compression Model
Sometimes several timeframes show price compressing near the same area. For example, the daily chart may be sitting under resistance, the four-hour chart may be forming tighter highs and lows, and the one-hour chart may show a narrow range. This compression can prepare the market for expansion. Traders may wait for a clean breakout and retest rather than guessing the direction too early.
How to Identify Multi-Timeframe Alignment on a Chart
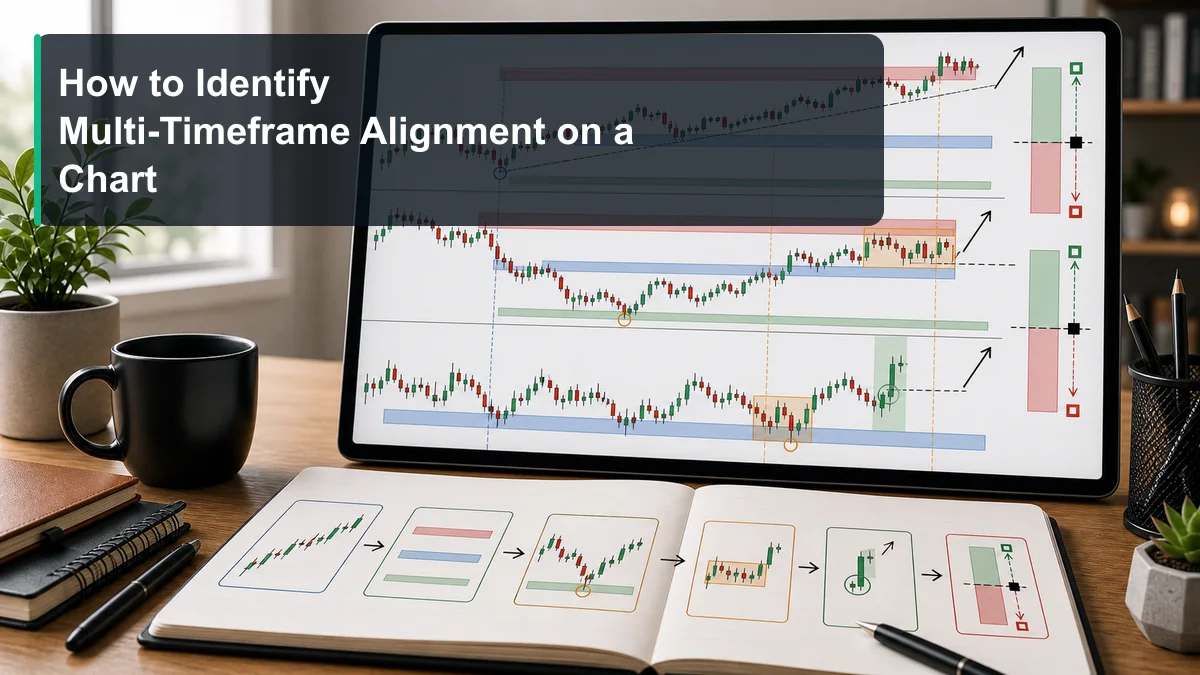
Identifying multi-timeframe alignment is less complicated than it sounds. Use a simple checklist.
First, define the higher-timeframe bias. Is the market trending up, trending down, or moving sideways? Do not force a bias when the chart is unclear. If the higher timeframe is choppy, the best decision may be to wait.
Second, mark the key higher-timeframe areas. These may include support, resistance, previous swing highs, previous swing lows, range boundaries, or major supply and demand areas. These zones tell you where lower-timeframe signals may matter.
Third, move to the planning timeframe. Ask whether price is approaching one of the higher-timeframe areas. If price is in the middle of nowhere, there may be no trade. The planning timeframe should help you locate the setup, not create random entries.
Fourth, use the execution timeframe to read the reaction. Does price reject the level? Does it break short-term structure? Does a candlestick pattern form? Does momentum shift? A lower-timeframe trigger is stronger when it appears at a higher-timeframe decision area.
Fifth, define invalidation. If you are trading a bullish reaction from higher-timeframe support, where is the idea wrong? If you are trading a bearish reaction from resistance, what level invalidates the setup? Multi-timeframe analysis should make risk clearer, not more confusing.
Finally, check whether the target has room. A lower-timeframe entry may look good, but if the next higher-timeframe resistance is too close, the trade may not be worth taking. Alignment should include direction and space.
A practical trick is to mark higher-timeframe levels first and then hide the lower-timeframe noise until price reaches those levels. This prevents you from reacting to every small candle. When price finally reaches a major level, you can zoom in and study the reaction with a clear purpose. The lower timeframe becomes a tool for confirmation instead of a source of random signals.
You should also check candle closes, not just intrabar movement. A lower-timeframe wick through a level may look dramatic, but the higher timeframe may still close cleanly above support or below resistance. Closing behavior helps separate temporary noise from meaningful structure.
A Multi-Timeframe Trading Workflow
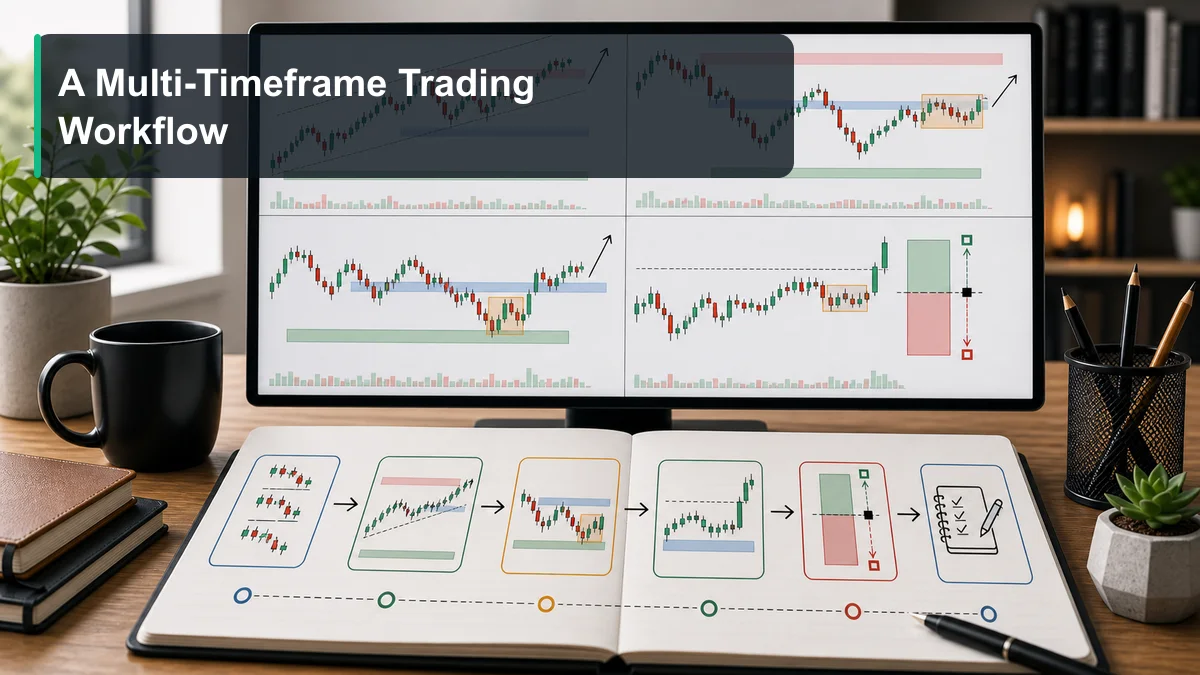
A repeatable workflow helps traders avoid jumping between charts randomly. Here is a beginner-friendly process.
Step 1: Choose Your Timeframe Stack
Pick three timeframes that fit your trading style. A swing trader might use weekly, daily, and four-hour charts. A day trader might use daily, one-hour, and fifteen-minute charts. A short-term intraday trader might use four-hour, fifteen-minute, and five-minute charts. Once you choose the stack, use it consistently.
Step 2: Start With Context
Open the highest timeframe first. Identify trend, range, major levels, and current location. Do not look for entries yet. Your only job is to understand the environment. This step protects you from taking a small signal against a major obstacle.
Step 3: Build the Setup on the Middle Timeframe
The middle timeframe should show the actual trading idea. This may be a pullback into support, a retest of resistance, a range edge reaction, or a breakout structure. If the middle timeframe does not show a clean setup, do not force one from the lower chart.
Step 4: Use the Lower Timeframe for Trigger and Risk
The execution timeframe can show the trigger: a candlestick pattern, break of minor structure, failed breakout, or small pullback. It can also help refine the stop. Keep in mind that lower timeframes are noisier, so confirmation matters.
Step 5: Plan the Trade Before Entry
Define entry, stop, target, and position size before clicking the button. If the higher timeframe requires patience, do not manage the trade from every small lower-timeframe candle. Your management style should match the setup timeframe.
Step 6: Review Across All Timeframes
After the trade, save screenshots from each timeframe. Review whether the higher-timeframe bias was correct, whether the setup formed at a meaningful area, whether the trigger was valid, and whether your risk was reasonable. This review builds real MTF skill.
This workflow also helps with emotional control. If you know which timeframe created the trade idea, you know which timeframe should manage it. A swing trade based on a daily support zone should not be closed only because a five-minute candle looks bearish. A short-term scalp should not be held for days just because the daily chart looks bullish. The management timeframe should match the original plan.
Beginners should write the timeframe stack directly in their journal. For example: “Daily bias, four-hour setup, one-hour trigger.” This simple note makes review much easier. If a trade fails, you can identify whether the problem came from context, setup, trigger, or risk.
Examples of Multi-Timeframe Analysis
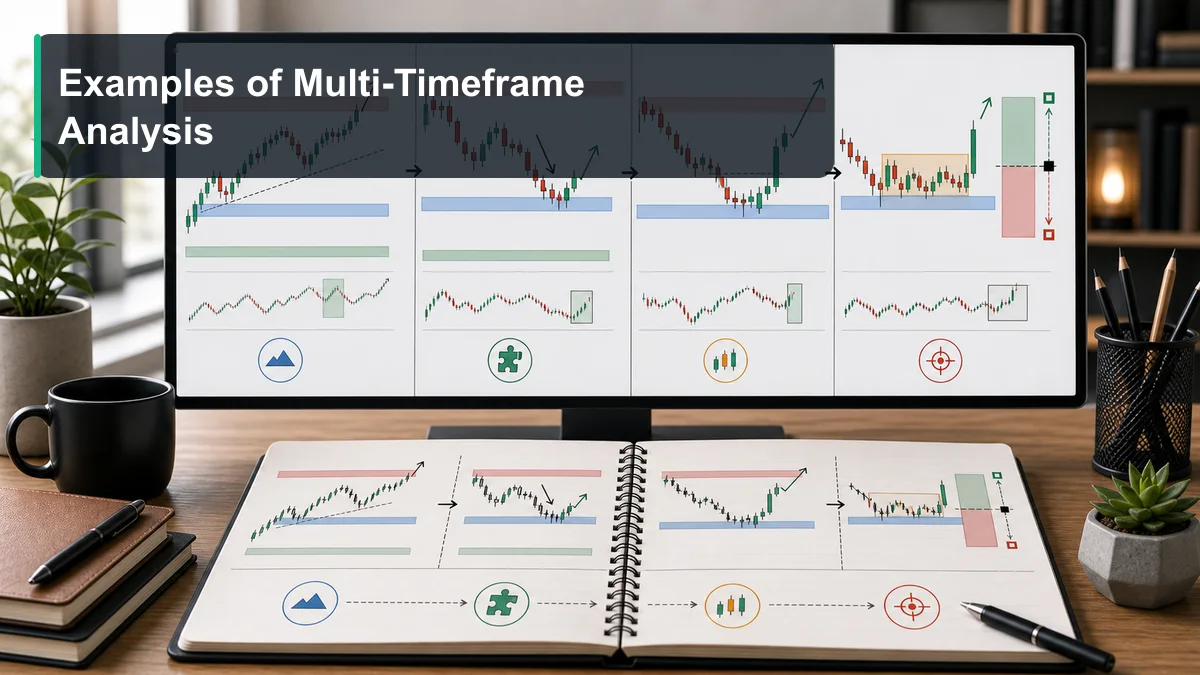
Example one: the daily chart is in an uptrend and price pulls back into a previous resistance zone that may now act as support. On the four-hour chart, the pullback slows and candles begin rejecting the zone. On the one-hour chart, price breaks a minor lower high. A trader may plan a long idea with invalidation below the support zone and a target near the next daily resistance.
Example two: the weekly chart shows price near major resistance. The daily chart is still bullish, but the rally is extended. On the one-hour chart, price sweeps above a previous high and then closes back below resistance. On the fifteen-minute chart, price breaks short-term structure downward. This may become a short-term bearish setup, but the trader should understand that it is counter to part of the broader trend and manage risk carefully.
Example three: the daily chart is ranging. The four-hour chart shows price moving into the range low. The one-hour chart forms a bullish rejection candle, but the middle of the range is nearby. The trader may decide that the setup has limited reward and skip it. This is still good analysis. Multi-timeframe analysis is not only for finding trades; it is also for avoiding weak ones.
Example four: the four-hour chart breaks resistance after a long consolidation. Instead of buying immediately, the trader waits. The one-hour chart pulls back to retest the broken level. The fifteen-minute chart shows a small bullish structure shift. This creates a breakout retest setup with clearer invalidation than a chase entry.
Across all examples, the same logic appears: higher timeframe gives context, middle timeframe gives the setup, lower timeframe gives timing, and risk defines whether the idea is tradable.
Example five: the daily chart shows a downtrend, but the one-hour chart forms a strong bullish rally. A beginner may want to buy because the lower timeframe looks powerful. MTF analysis adds caution. If the rally is moving into a daily lower high area, it may be a pullback inside the larger downtrend. The trader can wait for bearish confirmation instead of buying into higher-timeframe resistance.
Example six: the weekly chart is sideways, but the daily chart breaks above a range high and closes strongly. The four-hour chart later retests that breakout area and holds. The one-hour chart forms a bullish rejection. This is a cleaner multi-timeframe continuation idea because the breakout, retest, and entry trigger all connect.
Related Guides and Next Learning Path

Multi-timeframe analysis works best when it is connected to broader price action skills. Start with the Price Action hub and the Price Action Trading complete beginner guide. These guides explain market structure, support and resistance, trend behavior, and basic trade planning.
After that, study candlestick patterns. Lower-timeframe entries often depend on candle behavior, rejection, engulfing candles, doji candles, or inside bars. The Candlestick Patterns complete guide can help connect candle signals with context.
Next, learn support and resistance across timeframes. A level on the daily chart does not have the same weight as a level on the five-minute chart. Beginners should practice ranking levels by timeframe and clarity.
Then study market structure. Multi-timeframe analysis becomes much easier when you can identify higher highs, higher lows, lower highs, lower lows, ranges, breakouts, and failed breakouts on each chart. Structure helps you decide whether timeframes are aligned or in conflict.
After that, build a simple MTF model. For example: daily bias, four-hour pullback, one-hour trigger, stop beyond the higher-timeframe level, target at the next major zone. Practice that model repeatedly before adding more complexity.
Future cluster guides in this category should cover timeframe combinations, higher-timeframe bias, lower-timeframe entries, MTF support and resistance, MTF candlestick confirmation, and MTF trading mistakes. Each cluster should link back to this pillar so the Multi-Timeframe category has a strong internal structure.
Key takeaways
- Multi-timeframe analysis assigns different jobs to higher and lower charts, usually context, setup and execution.
- The method does not require every timeframe to agree; it requires a written rule for what to do when trend, location and trigger conflict.
- Use a fixed timeframe stack and move from broad structure to precise invalidation without repeatedly changing the chart hierarchy.
- A valid plan separates location, trigger, invalidation, position size and exit logic.
A validation workflow you can reproduce
- Define the sample: choose the market, timeframe, session and date range before reviewing outcomes.
- Write the rule: Use a fixed timeframe stack and move from broad structure to precise invalidation without repeatedly changing the chart hierarchy.
- Record invalidation: identify the observable price event that disproves the setup.
- Include execution costs: account for spread, commission and slippage where relevant.
- Validate separately: test the finished rule on data that was not used to create it.
When this concept is unreliable
The process becomes unreliable when traders keep adding timeframes until one confirms a preferred trade. Keep failed and skipped examples in the journal so the review is not limited to attractive winners.
Use this concept within a complete analysis
This method should remain connected to its parent framework and adjacent decision steps. Use New York Session Liquidity Sweep Strategy, Best Timeframes for Forex Trading, Trading Sessions: Complete Guide for Forex Traders, Asian Session Trading Strategy, Market Structure: Complete Guide for Traders and Trading Theories: Complete Guide to Technical Analysis Frameworks to compare definitions, establish context and avoid treating one signal as a complete trading system.
References and methodology
Practise before considering real capital
Use historical charts or a demo account to test the written rules before considering live execution. Review the Exness account and demo information. Availability, protections and trading conditions depend on jurisdiction, so review the applicable legal documents yourself.
Affiliate disclosure: Học Làm Trader may receive a commission if you open an account through this link, at no additional cost to you. This relationship does not determine the educational conclusions.
Risk warning: This article is for education and general information only. It is not investment advice, a trade signal or an invitation to trade. Trading can result in loss of capital, and past examples do not guarantee future results. Assess your own circumstances and risk tolerance.