


technical indicator mistakes Technical-indicator mistakes usually come from asking a calculation to answer a question it was not designed to answer. Indicators summarize historical data; stacking several momentum tools does not create independent confirmation or remove lag. The method should be treated as a testable chart-reading framework rather than a forecast. Before using it, define the market condition, confirmation event, invalidation price, transaction costs and maximum risk. This guide explains the rules, a repeatable workflow, common failure modes and the most relevant supporting concepts.
Mistake List: Common Indicator Mistakes Traders Make
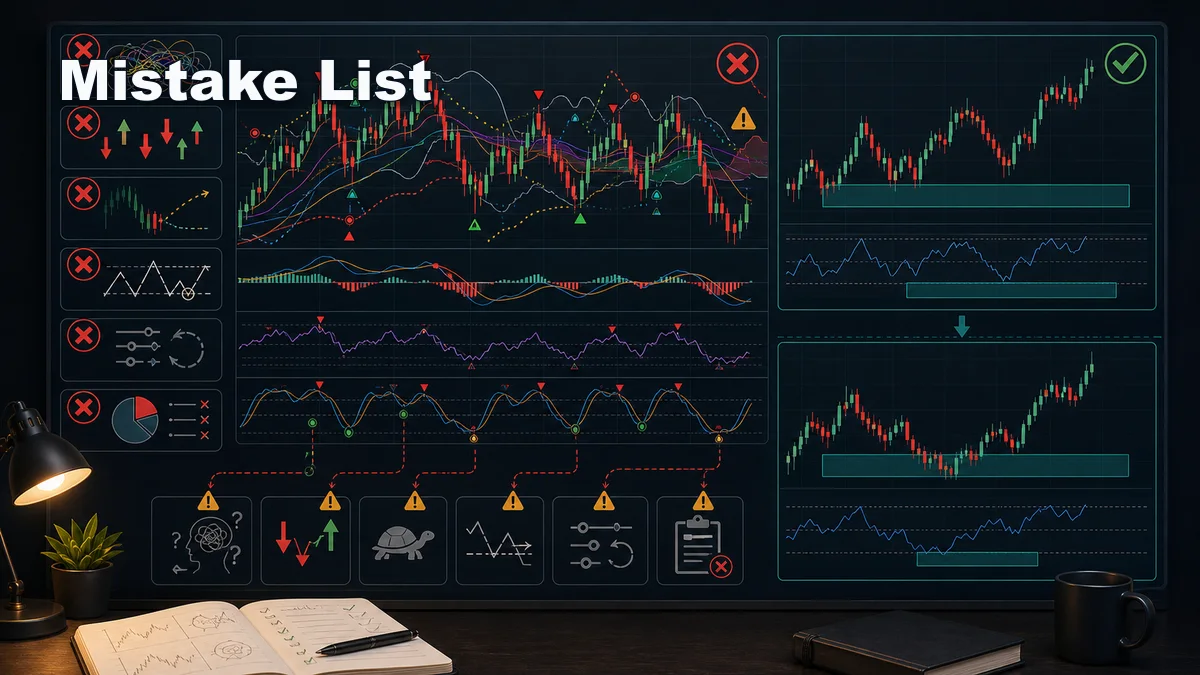
The first mistake is indicator overload. A trader adds moving averages, RSI, MACD, Bollinger Bands, volume tools, stochastic, ADX, Fibonacci levels, and several custom signals on one chart. Each tool may have value, but together they compete for attention. The trader spends more time interpreting the tools than reading price.
The second mistake is using several indicators that measure the same thing. RSI, stochastic, and MACD can all give momentum-related information. If a trader stacks them without understanding the overlap, they may think they have confluence when they only have repeated versions of the same clue.
The third mistake is treating indicators as entry buttons. A crossover, oversold reading, band touch, or histogram flip does not automatically mean enter. Indicators describe conditions. They do not replace market structure, support and resistance, volatility, liquidity, or risk planning.
The fourth mistake is ignoring trend context. A bearish RSI divergence inside a powerful uptrend can fail repeatedly. A moving average crossover inside a sideways range can create whipsaw after whipsaw. The same signal can be useful in one environment and weak in another.
The fifth mistake is changing settings after every loss. A trader loses with RSI 14, changes to RSI 10, loses again, adds a moving average filter, then changes the time frame. This creates a moving target. The trader never builds enough data to know whether the method works.
The sixth mistake is forgetting risk. Even a good indicator signal can fail. If there is no invalidation point, position size, stop logic, or target plan, the trade is incomplete. The indicator may trigger the idea, but risk management decides whether the idea is tradable.
The seventh mistake is mixing indicator roles. One tool should not be used as trend filter, entry trigger, exit signal, and confidence booster at the same time. A moving average may help define trend. RSI may help judge momentum. ATR may help estimate volatility. When every indicator is forced to do every job, the rules become unclear and the trader can justify almost any decision.
Why Each Indicator Mistake Happens
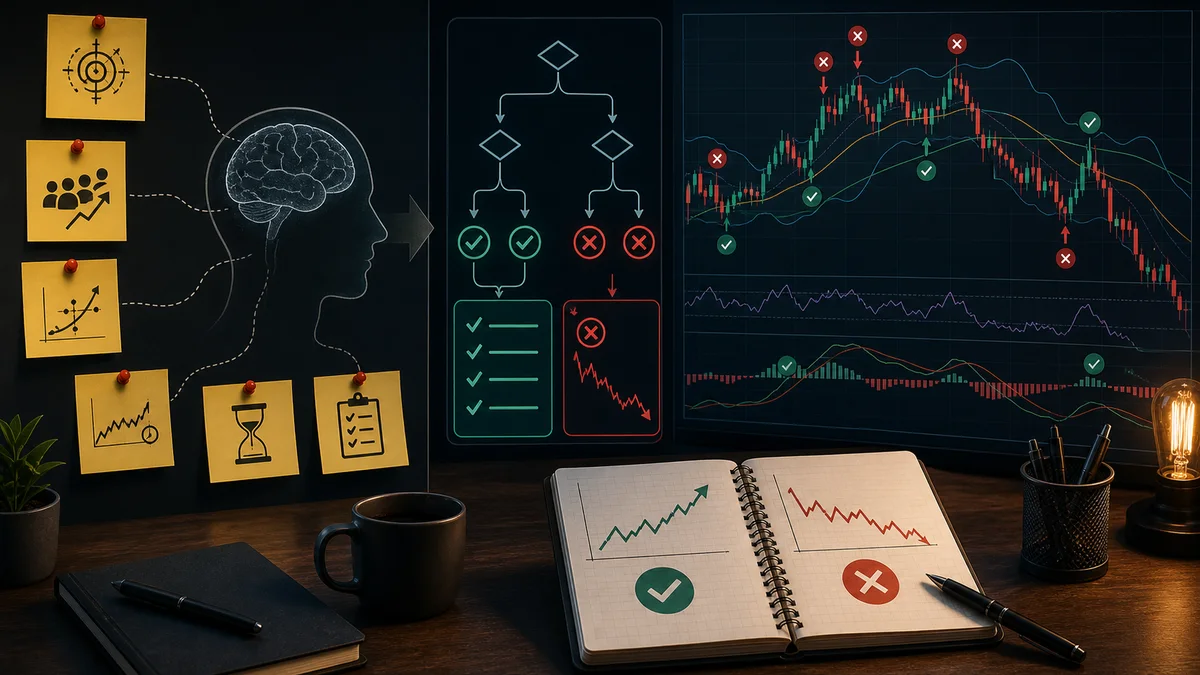
Indicator overload usually happens because traders want certainty. The market is uncertain, so adding another tool feels like adding protection. In reality, too many tools often create hesitation. More signals do not always mean more clarity. They can simply create more ways to justify a trade you already wanted to take.
Overlapping indicators happen because beginners learn tools one by one without learning categories. Trend indicators, momentum indicators, volatility indicators, and volume indicators answer different questions. If a trader does not know the question each tool answers, the chart becomes a collection instead of a system.
Entry-button behavior happens because indicators are visually simple. A line crosses another line. A candle touches a band. A histogram changes color. These events feel objective, which is attractive. But a signal is only meaningful when it appears in the right market environment. A clean signal in a bad location is still a poor trade.
Ignoring trend context often comes from studying screenshots instead of full sequences. A screenshot can make an indicator look perfect because it shows the final outcome. Real trading happens before the outcome is known. You must decide whether the signal fits the trend, range, volatility, and nearby levels in real time.
Setting changes happen because losses feel personal. Instead of reviewing a sample of trades, the trader tries to remove the pain by adjusting the tool. This is overfitting. A setting that looks better on the last five examples may perform worse in the next twenty. Stable rules are easier to test than constantly changing rules.
Risk mistakes happen because indicators can make traders feel protected. A trader may think, “RSI is oversold, so price should bounce.” But oversold can become more oversold. A trend can continue longer than expected. Regulators such as the CFTC warn traders to be careful with systems that imply easy or guaranteed profits. Indicators should never create that false confidence.
How to Fix Indicator Mistakes
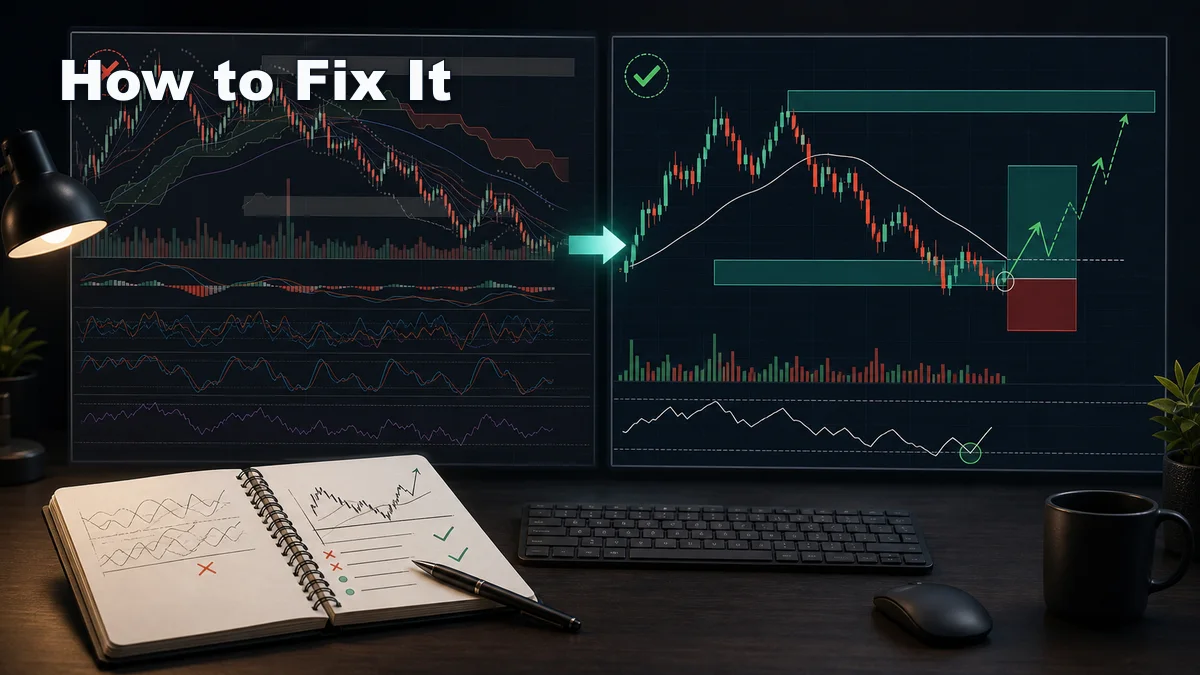
Start by reducing the chart. Choose one primary indicator and one supporting indicator at most. For example, a trader might use a moving average for trend direction and RSI for momentum condition. Another trader might use Bollinger Bands for volatility and price action for confirmation. The exact tools matter less than the purpose behind them.
Define the question each indicator answers. A moving average may answer, “Is price generally above or below trend?” RSI may answer, “Is momentum stretched or weakening?” ADX may answer, “Is the trend strong enough to trade a breakout?” Bollinger Bands may answer, “Is volatility expanding or contracting?” If you cannot explain the question, remove the tool.
Put price context first. Before checking indicators, mark the trend, range, support, resistance, market structure, and nearby liquidity. The Price Action Trading guide is useful here because indicators work better when they support the chart instead of replacing it.
Write entry rules in plain language. Avoid vague rules like “enter when indicators agree.” A cleaner rule is: trade only in the direction of the higher-timeframe trend, wait for price to pull back into a defined area, require momentum to turn back in the trend direction, then place invalidation beyond the structure point. That rule can be reviewed and tested.
Keep settings stable long enough to gather evidence. You can adjust settings after review, but do it after a meaningful sample, not after one emotional loss. Save screenshots. Track market environment, signal type, entry, stop, target, and result. A trading journal turns indicator use into research instead of guessing.
Separate each indicator into one of three roles: filter, trigger, or confirmation. A filter decides whether the market is suitable. A trigger tells you when a setup is active. A confirmation supports the idea after price has already provided context. For example, a trader may use a higher-timeframe moving average as the filter, a pullback into support as the price setup, and an RSI momentum turn as confirmation. That is cleaner than waiting for every indicator to agree at the same time.
Also define what you will ignore. If your system is trend-following, you may ignore oversold signals that appear in a strong downtrend. If your system is mean-reversion, you may ignore breakout signals during low-volume chop. A good indicator plan includes both action rules and no-trade rules. The no-trade rules often protect traders more than the entries.
Practice Drill: Clean Indicator Review
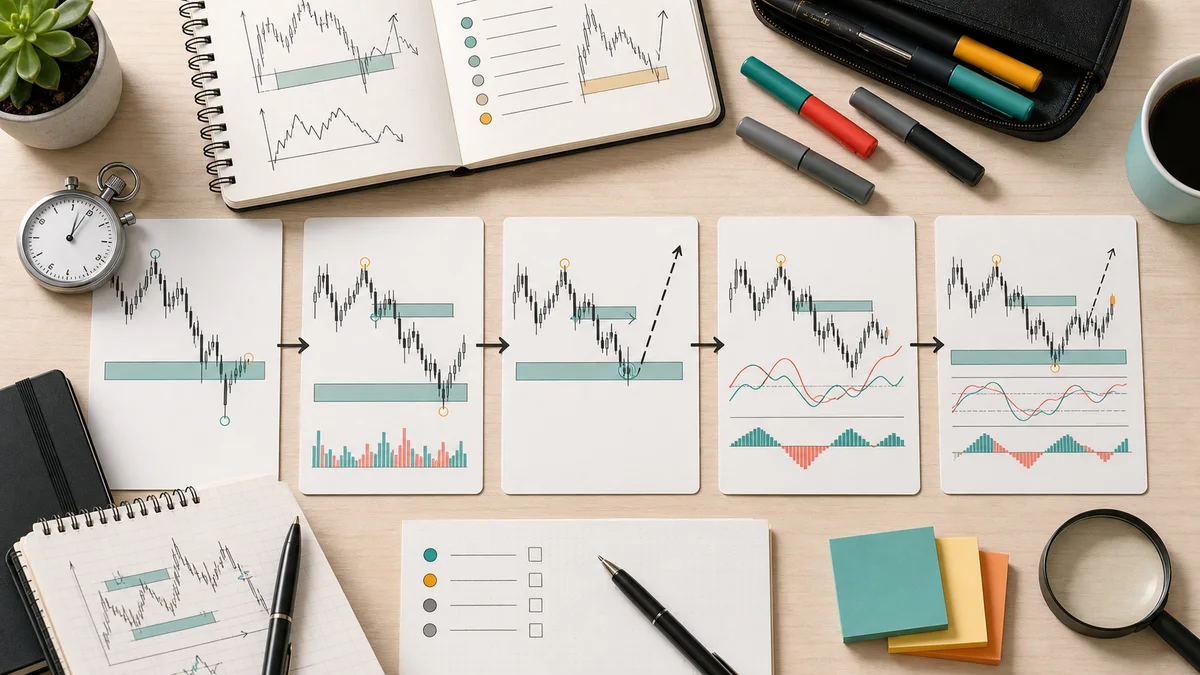
Use this drill on one market and one timeframe for at least twenty chart examples. First, hide every indicator. Look only at price. Mark the trend, range, swing highs, swing lows, support, resistance, and any obvious breakout or rejection areas. Write one sentence describing the market environment.
Second, add only one indicator. Ask whether it adds useful information that price alone did not make obvious. If the indicator confirms what you already saw, note it. If it conflicts with price, do not force the trade. Write down what the conflict means. Sometimes the best indicator lesson is “stand aside.”
Third, add the supporting indicator if you use one. Again, ask what new question it answers. If it only repeats the first indicator, remove it. If it helps define volatility, trend strength, or momentum quality, keep it in the review.
Fourth, plan the trade without entering. Define entry trigger, invalidation, target, and reason to skip. Then scroll forward or review the next candles. Do not judge only by win or loss. Judge whether the indicator helped you follow your rules. This is how you train process quality.
Fifth, summarize the sample. After twenty examples, count how many signals appeared in trend, range, breakout, and reversal conditions. You may discover that your indicator works well in trends but poorly in ranges, or that it gives early warnings but bad entries. That information is more valuable than another setting change.
Final Checklist for Indicator-Based Trading
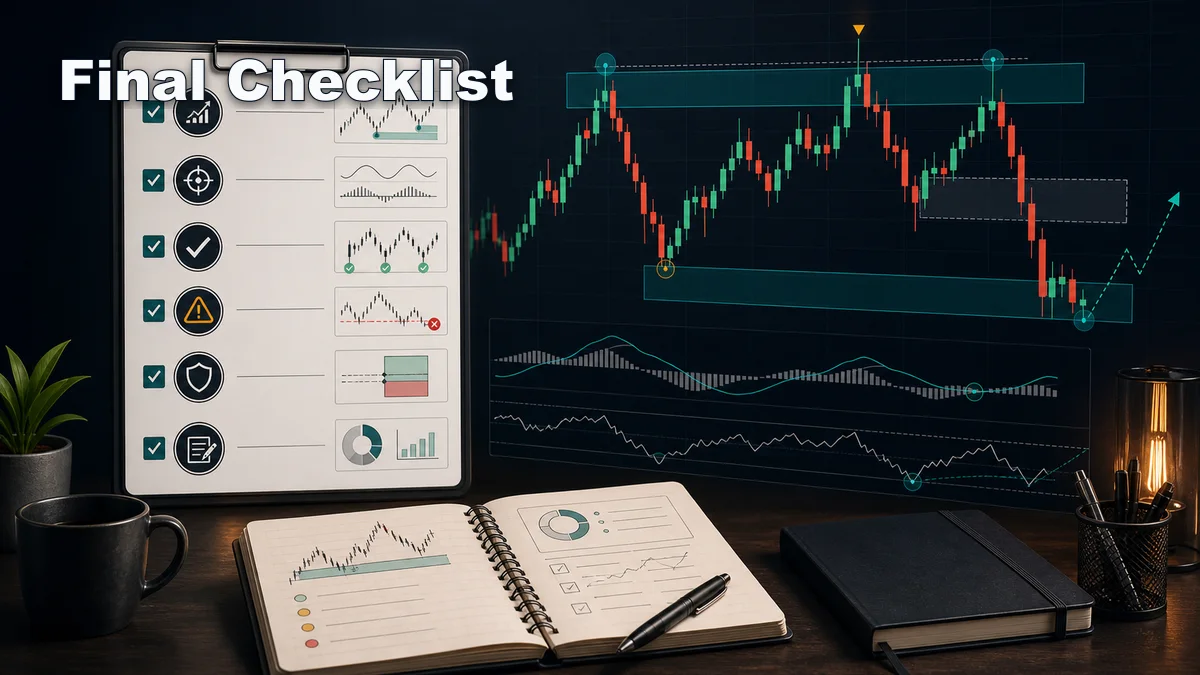
Before using an indicator signal, run through this checklist. First, what is the market environment: trend, range, breakout, reversal, or transition? Second, what question does the indicator answer? Third, does the signal align with price structure, or is it fighting the chart?
Fourth, where is the trade idea invalidated? A signal without invalidation is only an opinion. Fifth, is the potential target realistic, or is price moving directly into a nearby obstacle? Sixth, are spread, session, volatility, and news conditions reasonable enough to execute?
Seventh, is the indicator being used consistently with your rules? If you only obey the signal when it matches your bias, the tool is not helping. It is becoming decoration. Eighth, will this trade be useful for your journal even if it loses? A planned losing trade can teach you. An impulsive trade only adds noise.
Ninth, have you checked whether the indicator is lagging the move you want to trade? Trend indicators often confirm after price has already moved. That can be useful for avoiding weak trends, but it can also create late entries if the target is too close. Tenth, does the signal appear near a meaningful chart area? A momentum turn near support or resistance usually gives more context than the same signal in the middle of nowhere.
Indicators are best used as filters, confirmations, and review tools. They should not replace structure, context, or risk. A simple chart with one useful indicator and a clear plan is usually stronger than a crowded chart with many signals and no decision process.
As the Indicators category grows, this article should link forward to focused guides on RSI mistakes, MACD mistakes, moving average mistakes, Bollinger Band mistakes, and ADX mistakes. Those cluster articles should also link back here and to the main technical indicators pillar. The goal is to build a learning path where traders understand not only how indicators work, but also how they fail when used carelessly.
Key takeaways
- Technical-indicator mistakes usually come from asking a calculation to answer a question it was not designed to answer.
- Indicators summarize historical data; stacking several momentum tools does not create independent confirmation or remove lag.
- Give each indicator one decision role and test the rule across trends, ranges and out-of-sample data.
- A valid plan separates location, trigger, invalidation, position size and exit logic.
A validation workflow you can reproduce
- Define the sample: choose the market, timeframe, session and date range before reviewing outcomes.
- Write the rule: Give each indicator one decision role and test the rule across trends, ranges and out-of-sample data.
- Record invalidation: identify the observable price event that disproves the setup.
- Include execution costs: account for spread, commission and slippage where relevant.
- Validate separately: test the finished rule on data that was not used to create it.
When this concept is unreliable
An indicator setup is unreliable when parameters are changed repeatedly to fit past winners or losing periods are excluded. Keep failed and skipped examples in the journal so the review is not limited to attractive winners.
Use this concept within a complete analysis
This method should remain connected to its parent framework and adjacent decision steps. Use ADX Indicator: Trend Strength, DMI Signals and Filters, RSI Indicator: Settings, Divergence and Signal Limits, MACD Strategy: Crossovers, Histogram and Confirmation, Moving Averages: SMA vs EMA, Crossovers and Limits, Bollinger Bands: Squeeze, Breakout and Mean Reversion and Ichimoku Cloud: Components, Signals and Strategy Limits to compare definitions, establish context and avoid treating one signal as a complete trading system.
References and methodology
Practise before considering real capital
Use historical charts or a demo account to test the written rules before considering live execution. Review the Exness account and demo information. Availability, protections and trading conditions depend on jurisdiction, so review the applicable legal documents yourself.
Affiliate disclosure: Học Làm Trader may receive a commission if you open an account through this link, at no additional cost to you. This relationship does not determine the educational conclusions.
Risk warning: This article is for education and general information only. It is not investment advice, a trade signal or an invitation to trade. Trading can result in loss of capital, and past examples do not guarantee future results. Assess your own circumstances and risk tolerance.
For a worked example of VWAP variants and their limits, see the dedicated guide. VWAP session, anchored and bands.