


The Average Directional Index (ADX) estimates trend strength but does not show trend direction. A rising ADX means directional movement is strengthening under its calculation; price may be rising or falling. The accompanying +DI and −DI lines provide directional information, while price structure determines whether a setup is actually valid. Thresholds such as 20 or 25 are common conventions, not universal boundaries, and their usefulness varies by market and timeframe. This guide explains the ADX/DMI calculation, trend and range interpretations, breakout filters, common whipsaws and a process for testing whether ADX improves a trading rule.
What the Average Directional Index (ADX) Measures
Developed by J. Welles Wilder, the average directional index is a lagging indicator that evaluates the strength of a price trend over a specific period. Unlike moving averages or momentum oscillators that focus on the direction of the price, the primary ADX line is strictly non-directional.
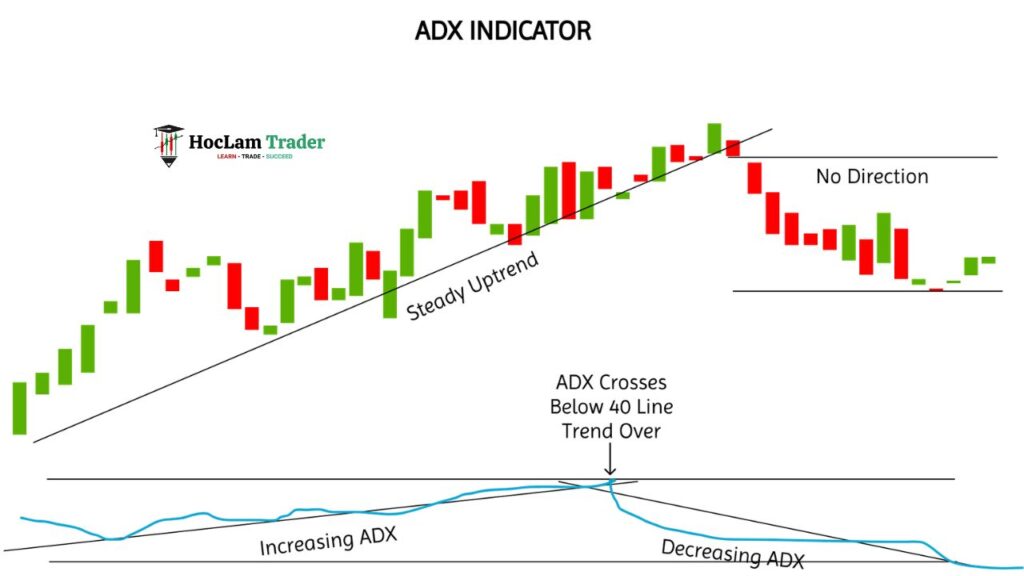
When the ADX line is rising, it simply means the current trend is gaining strength. This could manifest as a powerful uptrend or a vicious downtrend. Conversely, a falling ADX line indicates that the current trend is losing momentum and the market is likely entering a phase of consolidation. Understanding this non-directional nature is the first step to mastering the indicator.
Traders use the average directional index to investigate one question: Is the market trending strongly enough to justify a trend-following trade? If the answer is no, the trader knows to either step aside or switch to a mean-reversion strategy.
Understanding ADX values and trend strength
ADX is scaled from 0 to 100. Traders commonly use readings below 20 to describe weak directional movement and readings above 25 to describe stronger directional movement. These are conventions, not hard boundaries. A reading of 24 and 26 should not be treated as two completely different market states.
| ADX observation | What it describes | What it does not establish |
|---|---|---|
| Low and flat | Limited directional movement under the calculation | That a range trade will succeed |
| Rising through a chosen threshold | Directional movement is strengthening | Whether direction is bullish or bearish |
| High and falling | Measured trend strength is declining | That price must reverse immediately |
Read +DI, −DI and price structure for direction. A threshold should be chosen before testing and kept fixed through the evaluation sample.
How ADX Identifies Ranging vs Trending Markets
The core of trend vs range market trading lies in identifying the exact transition points between these two states. Markets spend the majority of their time ranging and a minority of their time trending. The ADX provides a clear visual and mathematical distinction between the two.
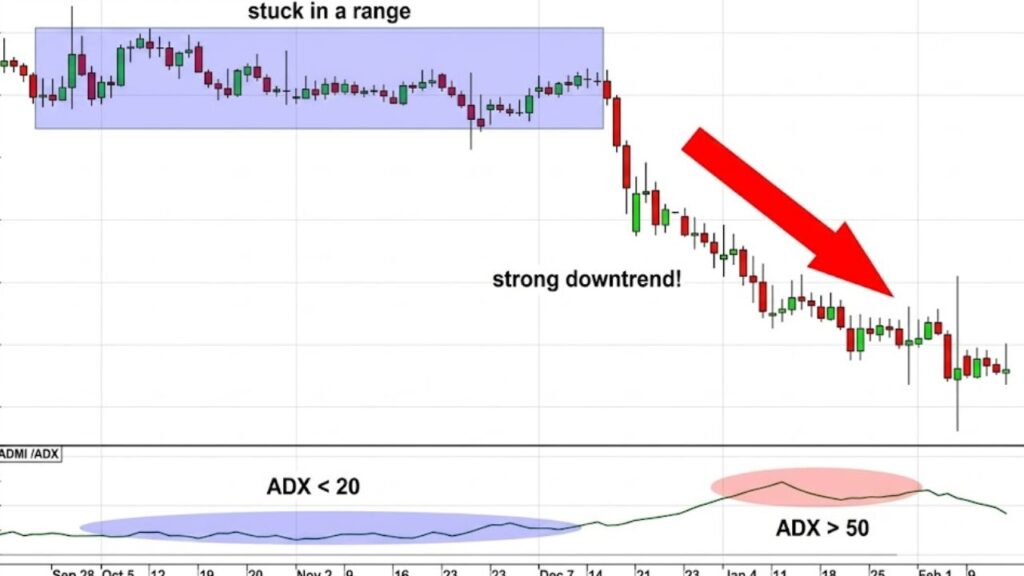
Characteristics of a Ranging Market (ADX < 20):
- Price Action: Oscillates horizontally between established support and resistance levels without making sustained higher highs or lower lows.
- Moving Averages: Flat, frequently crossing over each other with no clear separation.
- ADX Behavior: The ADX line slopes downward and remains stubbornly below the 20 threshold.
- Trading Implication: High risk of whipsaws; trend traders should halt execution.
Characteristics of a Trending Market (ADX > 25):
- Price Action: Consistently breaches support or resistance, establishing clear sequences of higher highs (uptrend) or lower lows (downtrend).
- Moving Averages: Sloping upwards or downwards with a clear, widening separation between fast and slow periods.
- ADX Behavior: The ADX line hooks upward, crosses 20, and sustains levels above 25.
- Trading Implication: Directional movement is strong under the selected calculation; continuation still requires price confirmation.
By monitoring these distinct characteristics, traders possess an objective representation of the market’s current state, removing emotional guesswork from chart analysis.
Using ADX as a Trade Filter
Implementing an ADX trading filter is one of the most effective ways to protect capital. A trade filter is simply a ruleset that permits or denies a trade execution based on specific technical criteria.
To use ADX effectively as a filter, you must align it with the strategy you are deploying. If you are trading a trend-continuation system, your strict rule should be only to take trades when the ADX is above 20 or 25 and pointing upward. If the ADX is below 20, you must void all trend trade signals, no matter how promising the candlestick formations look.
Conversely, if you are trading a range-bound strategy—buying at support and selling at resistance—you want the ADX to remain flat and below 20. If you are holding a mean-reversion trade and the ADX suddenly spikes above 25 with expanding volume, it is a clear warning that the range is breaking, and you should manage your risk immediately.
DI+ and DI- Directional Signals
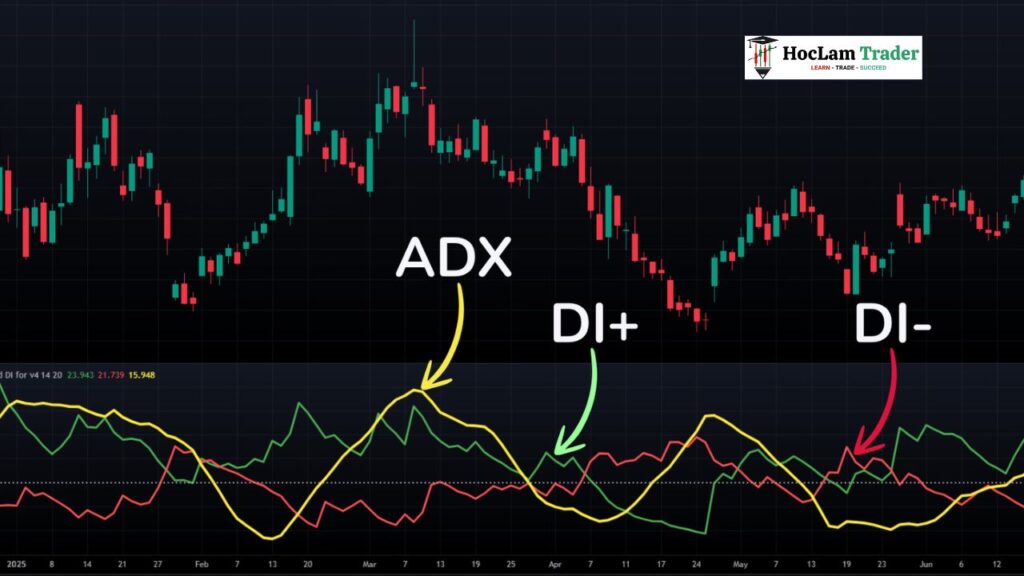
While the main ADX line measures trend strength, Wilder also introduced two supplementary lines to measure trend direction: the Positive Directional Indicator (+DI) and the Negative Directional Indicator (-DI). Together, these three lines form the complete directional movement system.
The +DI line measures the strength of upward price movement, while the -DI line measures the strength of downward price movement. The interaction between the DI lines and ADX can be written as a filter, but price still supplies the entry and invalidation.
The Buy Signal
A valid buy signal occurs when the +DI line crosses above the -DI line. However, taking every crossover leads to failure in choppy conditions. To filter this, the crossover must be confirmed by the ADX line rising above 25.
For example, on a 1-Hour (H1) chart of EUR/USD, if the +DI sharply crosses the -DI, you must look at the primary ADX line. If the ADX is rising from 22 to 26 at the same time, this combination confirms that bullish momentum has overtaken bearish momentum and that the overall trend strength is robust enough to sustain the upward move.
The Sell Signal
A sell signal is generated when the -DI line crosses above the +DI line. Just as with the buy signal, this bearish crossover must be validated by the ADX rising above 25. This indicates that negative directional movement exceeds positive directional movement while measured trend strength is rising; it does not identify the participants.
ADX Breakout Confirmation Strategy
Breakouts from chart patterns such as triangles, rectangles, or head and shoulders formations—are popular trading setups. Yet, false breakouts trap countless retail traders every single session. Using an ADX indicator strategy specifically for breakout confirmation dramatically reduces exposure to these traps.
Consider trading Bitcoin during a multi-week accumulation phase. Price compresses into a tight range, and eventually, a large bullish candle breaches the upper resistance. When the price approaches this major resistance level, monitor the ADX. If Bitcoin breaches resistance while ADX remains low and flat, the filter has not confirmed expanding directional movement. This does not prove who is participating. This is a low-probability trade that is destined to revert to the range.
One testable breakout rule can require ADX to slope upward with the price breach. Ideally, the ADX will cross from below 20 to above 25 exactly as the price clears the resistance zone. This synchronization indicates that fresh liquidity is entering the market, driving the price upward at an increasing velocity.
Avoiding Range Whipsaws With ADX
Whipsaws occur when a trader enters a position on a perceived trend, only for the price to sharply reverse, hit their stop-loss, and then often reverse again. This specific, erratic price action systematically destroys trading accounts. Avoiding these environments is exactly what the ADX was built to do.
To systematically avoid whipsaws, traders must recognize and respect the dead zone. The dead zone is defined as any period during which the ADX remains below 20. During this time, moving averages will frequently cross back and forth, and standard trendlines will be broken without any follow-through.
Practical filters to apply include:
- Identify the dead zone: Mark a horizontal line at 20 on your ADX window. When the indicator falls below this line, halt all trend trading.
- Avoid breakout systems during low ADX: Do not anticipate breakouts. Wait for the mathematical confirmation of the ADX sloping upward before committing capital.
- Wait for the ADX to rise before entering: Even if the price breaks a critical level, wait for the ADX line to slope upward, confirming expanding volatility.
- Require directional signals to persist: When using the DI+ DI- indicator crossovers, ensure the crossover persists for at least 2- 3 closed candles before entering, allowing the ADX time to catch up and confirm the underlying strength.
Best ADX Settings for Different Timeframes
The standard setting for the ADX is 14 periods. Wilder designed this for daily charts, representing roughly half a trading month. However, traders operating on different timeframes must adjust the period setting to balance sensitivity and reliability.
Swing Trading
For swing traders holding positions for days to weeks, the default 14-period setting remains highly effective. It filters out daily market noise while accurately capturing the primary directional moves that define swing trading success.
Day Trading
Day traders using 5-minute or 15-minute charts often find the 14-period setting too slow, leading them to miss early intraday trends. Lowering the ADX setting to a 7-period or 10-period parameter increases sensitivity. This allows the indicator to react more quickly to sudden intraday volatility spikes, though it requires stricter risk management due to an increased risk of false signals.
Position Trading
Position traders and macro investors looking at weekly or monthly charts should consider increasing the setting to a 20-period or 28-period ADX. This higher setting significantly smooths the indicator data, ignoring temporary multi-week pullbacks and keeping the trader focused strictly on macro-level trend strength.
Combining ADX With Other Indicators
No technical tool should be used in isolation. The ADX is exceptional at measuring trend strength, but it cannot pinpoint exact entry prices or determine micro-level overextended conditions. Combining it with another measurement creates a more complex rule that must be validated out of sample.
Pairing ADX with moving averages is a classic approach. For example, a trader might require the price to be above a 50-period Exponential Moving Average (EMA) to define an uptrend. They then use the ADX to measure the strength of that uptrend. If price is above the 50 EMA and the ADX is pushing above 25, the conditions are perfect for buying pullbacks to the shorter-term 20 EMA.
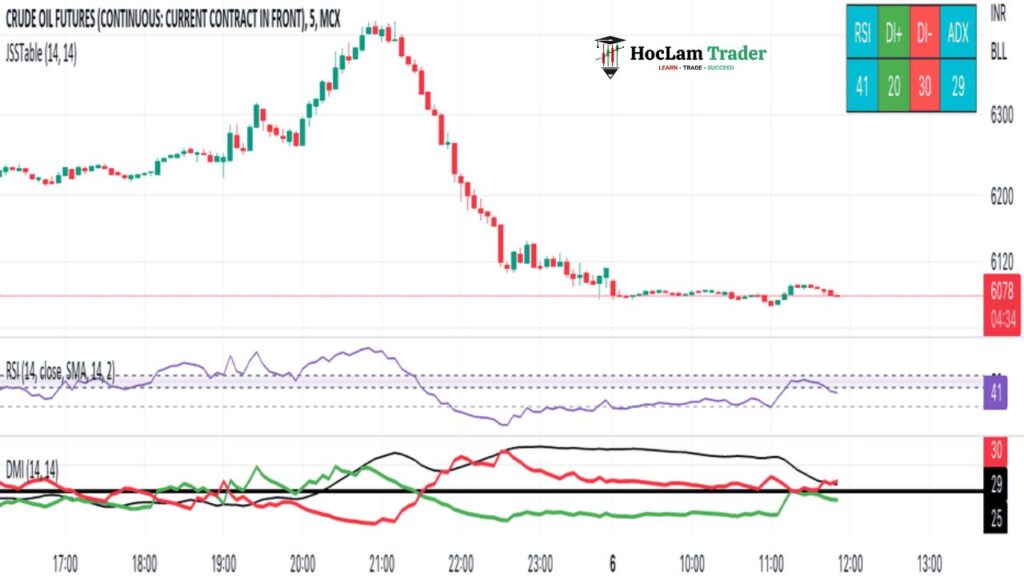
Momentum oscillators like the Relative Strength Index (RSI) pair flawlessly with the ADX. While the ADX confirms the macro trend is strong, the RSI can identify short-term oversold conditions within that strong uptrend, providing highly precise, low-risk entry points.
Volume indicators add the final layer of confirmation. A rising ADX and expanding volume can describe stronger directional activity, but neither proves that a trend will persist or identifies institutional participation.
Practical ADX Trend Trading Checklist
To successfully integrate the ADX into your daily routine, follow this practical checklist before executing any trend-based trade:
- Filter the dead zone: Is the ADX below 20? If yes, cancel all trend-following orders immediately.
- Identify the current ADX value: Is it actively crossing or holding above 25?
- Check the ADX slope: Is the main ADX line pointing upward, confirming increasing momentum?
- Analyze the DI lines: Does the DI+ and DI- crossover match your intended trade direction?
- Confirm with price action: Has price broken a clear, observable level of support or resistance?
- Check for extremes: Is the ADX above 50, warning of a potential trend exhaustion or deep pullback?
Conclusion
Mastering the ADX trend strength indicator provides a distinct analytical advantage. By objectively measuring the velocity of price movement, traders can reduce some signals during choppy phases while maintaining the same predefined risk limits. Integrating the average directional index alongside the DI+ DI- indicator transforms a guessing game into a structured, rules-based approach.
Whether you are trading forex, crypto, or global indices, a trend-strength filter is one optional rule whose effect should be tested. Keep a close watch on the critical 20 and 25 thresholds, respect the dead zone, and let a written risk policy—not one indicator—determine market exposure.
For a complete decision process, use Market Structure: Trends, Swings, BOS and CHoCH and Price Action Trading: Structure, Setups and Risk to connect the signal with structure, context and invalidation rather than reading the indicator or pattern alone.
How to validate an ADX filter
- Write the base strategy without ADX and record its entry, exit and invalidation rules.
- Add one ADX condition, such as rising ADX or a preselected threshold.
- Test trending and ranging periods with fees, spread and slippage included.
- Separate in-sample selection from out-of-sample evaluation.
- Compare expectancy, drawdown, trade count and missed opportunities—not win rate alone.
- Keep the filter only if the improvement is stable across relevant samples.
ADX can be combined with moving averages or Bollinger Bands, but the indicators still derive from price. A structure break and a price-based invalidation remain necessary when the strategy requires them.
Sources and methodology
- Fidelity Learning Center — Technical Indicator Guide
- CME Group — MACD, RSI and Stochastics
- CFTC — Foreign Currency Trading Advisory
Practise the rules before using real capital
If you decide to practise these chart rules, start in a demo environment and record each setup before considering a live account. Open the XM account information page. Products, availability and trading conditions vary by jurisdiction; review the applicable terms and regulatory information yourself.
Affiliate disclosure: Học Làm Trader may receive a commission if you open an account through this link, at no additional cost to you. The relationship does not change the educational analysis or remove trading risk.
Risk warning: This article is for education and general information only. It is not investment advice, a trade signal, or an invitation to trade. Technical-analysis tools are based on historical market data and can fail. Trading can result in loss of capital; test rules, define invalidation, and size risk before using real money.
Related guides in this topic
- Technical Indicators Trading: A Practical Guide to Reading Markets With Clarity
- Fibonacci Trading Guide: How to Use Retracements, Extensions & Confluence for Smarter Entries
- Moving Averages in Trading: SMA vs EMA, Crossovers, and Dynamic Support/Resistance
Related reading: Indicator Mistakes: Overfitting, Duplication and Lag