


Lower highs and lower lows are a core price action pattern for reading bearish market structure. When price keeps breaking below previous swing lows and each bounce fails below the previous swing high, sellers are controlling the sequence. This does not guarantee that every short trade will work, but it gives traders a practical way to describe direction, pullbacks, confirmation, and invalidation.
Quick answer: lower highs and lower lows mean sellers are repeatedly pushing price into new lows while buyers fail to recover previous highs. Traders use the pattern to identify a downtrend, avoid buying weak bounces, and plan risk around the most recent lower high.
This guide explains the concept step by step: definition, how to identify it, why it works, how to use it in a trading plan, confirmation rules, examples, and common mistakes. For the wider foundation, review the Price Action hub, the Structure category, and the previous related article, Higher Highs and Higher Lows Explained.
Nothing here is financial advice. Bearish structure can fail, especially around higher-timeframe support, news events, session shifts, and liquidity sweeps. Use the pattern as a chart-reading tool, then combine it with risk management and a tested plan.
Definition: What Are Lower Highs and Lower Lows?
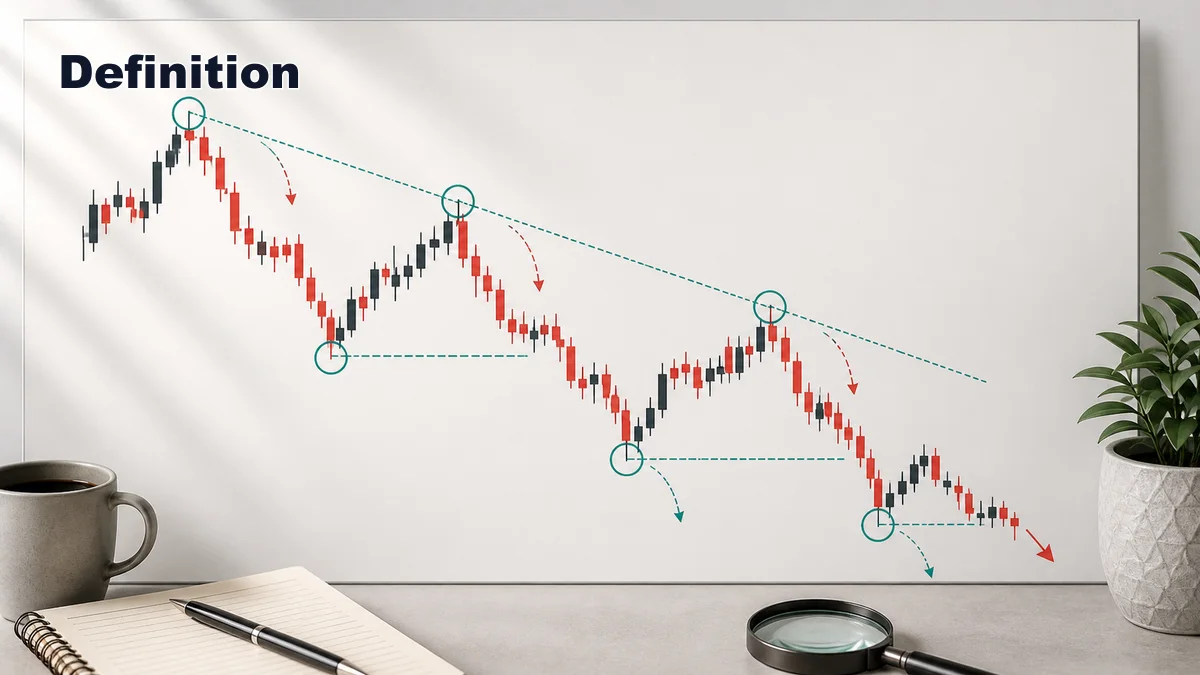
A lower low forms when price falls below a previous swing low. A lower high forms when price bounces but fails to break above the previous swing high. Together, they create the basic rhythm of a downtrend: drop, pullback, drop, pullback, continuation. The lows show that sellers can push price into new territory. The highs show that buyers cannot recover enough control to break the previous high.
A swing high is a visible point where price rises, pauses, and turns down. A swing low is a visible point where price falls, pauses, and turns up. The word “visible” matters because beginners often mark every tiny candle wiggle. A useful swing should be clear enough that it explains the market even after you zoom out slightly.
In a clean bearish sequence, price makes a lower low, then bounces into a pullback. If the bounce fails below the previous swing high and price later turns downward, that bounce becomes a lower high. If price then breaks the latest low, the sequence continues.
The pattern tells a simple story. Sellers are willing to sell at lower prices, buyers are failing to reclaim previous decision points, and each new breakdown confirms that the market is accepting lower levels. The trader does not need to predict every candle. The structure gives a framework for deciding whether bearish continuation still makes sense.
How to Identify Lower Highs and Lower Lows

Start by zooming out until the main movement is easy to see. If every candle looks important, you are probably too close to the chart. Lower highs and lower lows should describe the main swing rhythm, not every small fluctuation inside a pullback.
Next, mark the clearest swing lows and swing highs. A swing low should show a meaningful drop and reaction. A swing high should show a meaningful bounce and failure point. If you need to argue with yourself about whether a point matters, it is probably not the first swing you should mark.
After the swings are marked, compare them in sequence. Did the latest low break below the previous low? Did the latest bounce high stay below the previous high? Did price continue downward after failing at the bounce? If the answer is yes, the market is likely forming lower highs and lower lows.
It also helps to separate major structure from minor structure. The daily chart may show a strong downtrend, while the fifteen-minute chart shows a temporary bullish pullback. That does not automatically end the larger bearish structure. Decide which timeframe controls your trade idea before labeling the chart.
A lower high is stronger when it forms at a logical area, such as previous support turned resistance, a supply zone, a moving average area, or a higher-timeframe resistance level. A random rejection in the middle of a chart may still become a lower high, but it usually needs more confirmation.
Why Lower Highs and Lower Lows Work
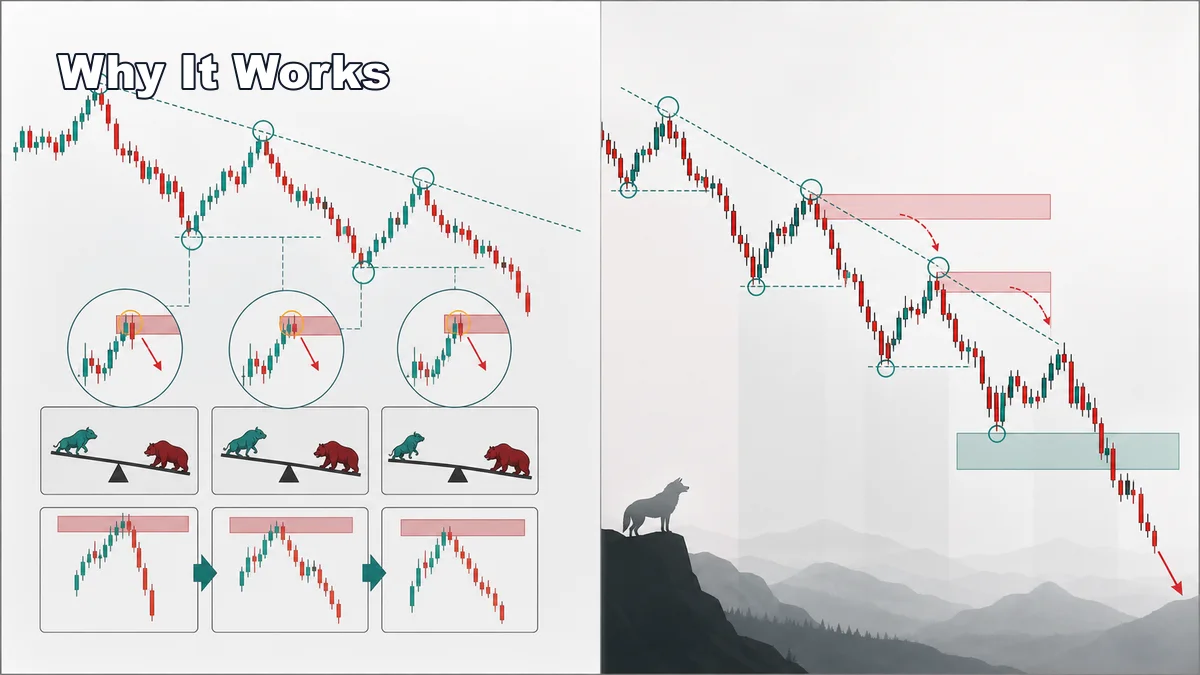
The pattern works because it organizes selling and buying pressure into a readable sequence. A lower low shows expansion to the downside. Price has moved below a prior decision point, which means sellers had enough strength to overcome buyers at that area. A lower high shows defense. Buyers tried to push price upward, but they could not break the previous high.
This repeated failure can create confidence for trend-following traders. Traders who missed the first drop may wait for the next pullback. Buyers who entered late may exit when price breaks below a previous low. Breakout traders may enter when price confirms another downside expansion. These reactions can help bearish continuation develop.
Lower highs are often more important than lower lows. A new low can happen through a brief spike or liquidity sweep. A lower high shows whether the market can hold bearish structure after the bounce. If price makes a new low but then rallies above the previous high, the bearish story weakens. If price bounces calmly and fails below the previous high, the downtrend remains healthier.
The pattern also helps with risk because it gives the trader a visible invalidation point. If a short idea depends on a lower high holding, then a clean break above that lower high may invalidate the idea. This does not make the trade safe, but it makes the risk more logical than entering without a structure point.
Step-by-Step Usage in a Trading Plan
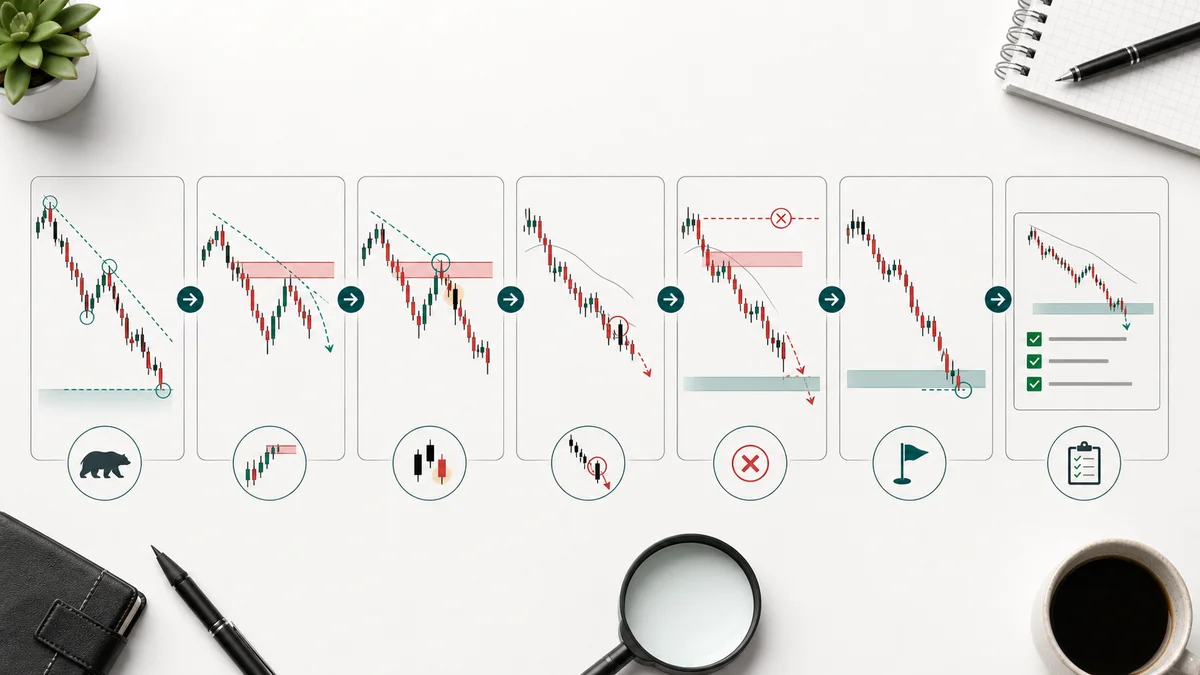
- Define the market state. Is price already making lower highs and lower lows, or are you trying to guess the first reversal before structure confirms it?
- Mark the active swing low and swing high. The low is the continuation level. The high is the structure point that should hold if the bearish idea remains valid.
- Wait for the pullback. Do not chase every lower low. A cleaner setup often appears when price bounces into a logical resistance area.
- Look for confirmation. This can be a rejection candle, a lower-timeframe break downward, a failed retest, or a close back below a minor structure point.
- Plan invalidation first. If the setup depends on a lower high, a clean break above that lower high changes the idea.
- Define the target. Common targets include the prior low, a projected new low, or the next higher-timeframe support area.
For example, price may break below support and form a lower low. Instead of selling the breakdown late, a trader waits for price to retest the broken support from below. If the retest fails and a lower high forms, the trader can plan a short idea with invalidation above the lower high.
The same logic can apply across timeframes. A four-hour downtrend may create the bearish context, while a fifteen-minute lower high provides entry timing. The key is that the lower timeframe should support the higher-timeframe idea, not create a separate reason to trade.
Confirmation Rules for Lower Highs and Lower Lows
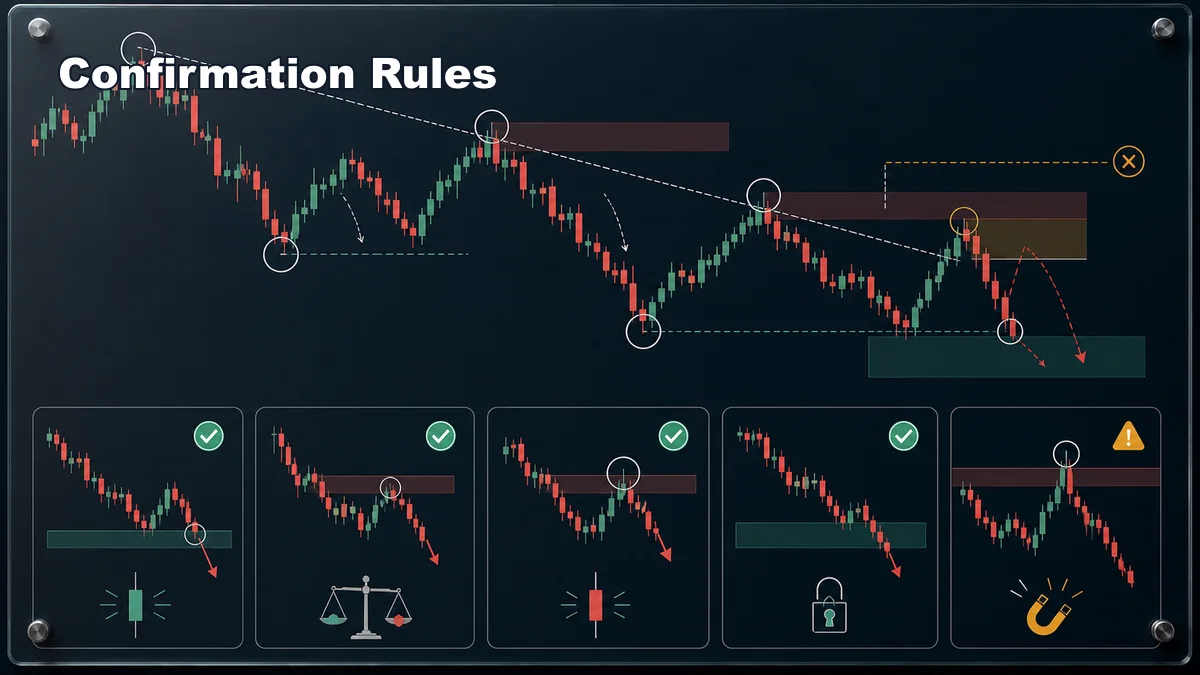
- Use meaningful swings. A tiny break below a tiny low may not change the market state. Focus on levels that matter on your trading timeframe.
- Prefer acceptance over a wick. A close below the prior low, a hold below the level, or a failed retest is stronger than a brief spike.
- Protect the lower high. If price breaks above the prior lower high after making a lower low, the bearish structure is no longer clean.
- Check location. A lower high forming at resistance is usually cleaner than one forming directly into major higher-timeframe support.
- Wait for behavior. A possible lower high becomes more useful only after price reacts and shows that sellers are defending it.
- Watch for liquidity sweeps. A wick below a previous low can trap sellers if price quickly returns above the level.
Confirmation should make the trade clearer, not slower for no reason. The goal is to avoid selling every red candle. A bearish setup is stronger when the chart shows context, location, reaction, and invalidation together.
Multi-timeframe confirmation also matters. A fifteen-minute lower low has more value if it forms under a four-hour resistance area. The same signal has less value if it forms directly on daily support after an extended selloff.
Examples of Lower Highs and Lower Lows
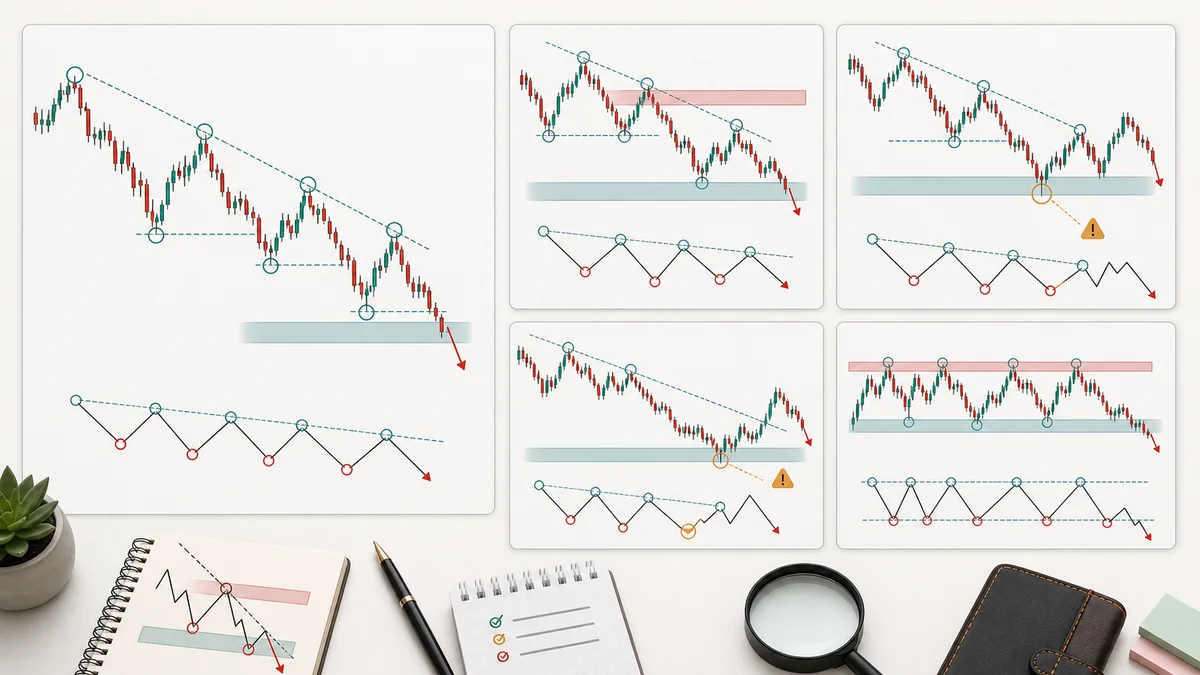
Example one is a clean bearish continuation. Price breaks below a prior low, pulls back into the old support area, forms a lower high, and then drops again. This is the easiest version to study because the sequence is obvious. The trader can see where the bearish idea begins, where it is confirmed, and where it would be wrong.
Example two is a deep pullback that still holds structure. Price makes a strong lower low, then retraces more deeply than expected. Many traders panic during the pullback, but price still holds below the previous swing high. If sellers step in and price breaks a minor lower-timeframe low, the market may still be forming a valid lower high.
Example three is a failed breakdown. Price breaks below a prior low but cannot hold. It quickly returns above the breakdown area and later breaks above the previous swing high. In that case, the old bearish sequence is no longer clean. A disciplined trader stops treating the chart as a simple lower high and lower low trend.
Example four is a range pretending to be a downtrend. Price makes small marginal lows and small marginal lower highs, but each move lacks follow-through. The chart looks choppy, and every breakdown fails quickly. In this case, forcing a downtrend label can lead to poor short entries.
Example five is a bearish structure inside a higher-timeframe uptrend. The lower timeframe may show lower highs and lower lows, but the larger chart may be pulling back into a major support area. A trader should decide whether the trade is a short-term countertrend idea or whether it is too close to support to justify the risk.
Common Mistakes When Trading Lower Highs and Lower Lows
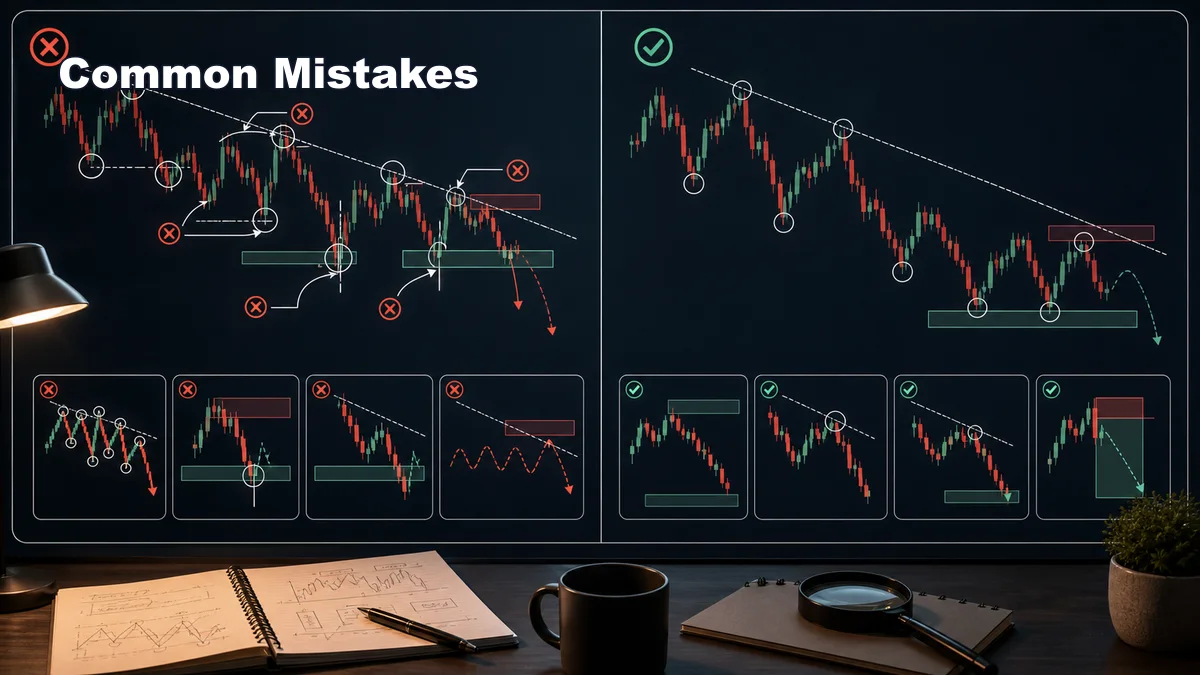
- Forcing tiny swings: marking every candle makes the chart unreadable. Start with the most obvious structure.
- Chasing the lower low: late breakdown entries often leave poor reward-to-risk. Wait for the next pullback when possible.
- Ignoring higher-timeframe support: a lower-timeframe downtrend can still be running directly into a major demand area.
- Moving invalidation: if the trade depends on a lower high, a strong break above that high changes the setup.
- Assuming continuation forever: downtrends age, momentum weakens, and the sequence can transition into a range or reversal.
- Selling every red candle: bearish candles matter more when they appear at a logical lower high or resistance area.
Used correctly, lower highs and lower lows are a powerful beginner concept because they make bearish market direction visible. They help traders read structure, wait for pullbacks, define invalidation, and avoid reacting to random candles. Study the pattern inside the broader Price Action hub and keep connecting it back to the Structure category so it becomes part of a complete chart-reading process.
Connect this setup to the wider framework
Lower highs and lower lows describe one layer of structure. Compare them with higher highs and higher lows, the full market-structure guide, and BOS versus CHoCH before treating a small swing as a trend reversal.
Sources and limits
General market-risk and technical-analysis references:
Strategy labels and chart examples are interpretive; they are not standardized signals and do not guarantee outcomes.