


BOS vs CHoCH BOS usually describes a break that confirms the prevailing structural direction, while CHoCH usually describes an early break against it. Definitions vary among educators, so the chosen swing degree and wick-or-close rule must be stated before signals are compared. The method should be treated as a testable chart-reading framework rather than a forecast. Before using it, define the market condition, confirmation event, invalidation price, transaction costs and maximum risk. This guide explains the rules, a repeatable workflow, common failure modes and the most relevant supporting concepts.
Definitions
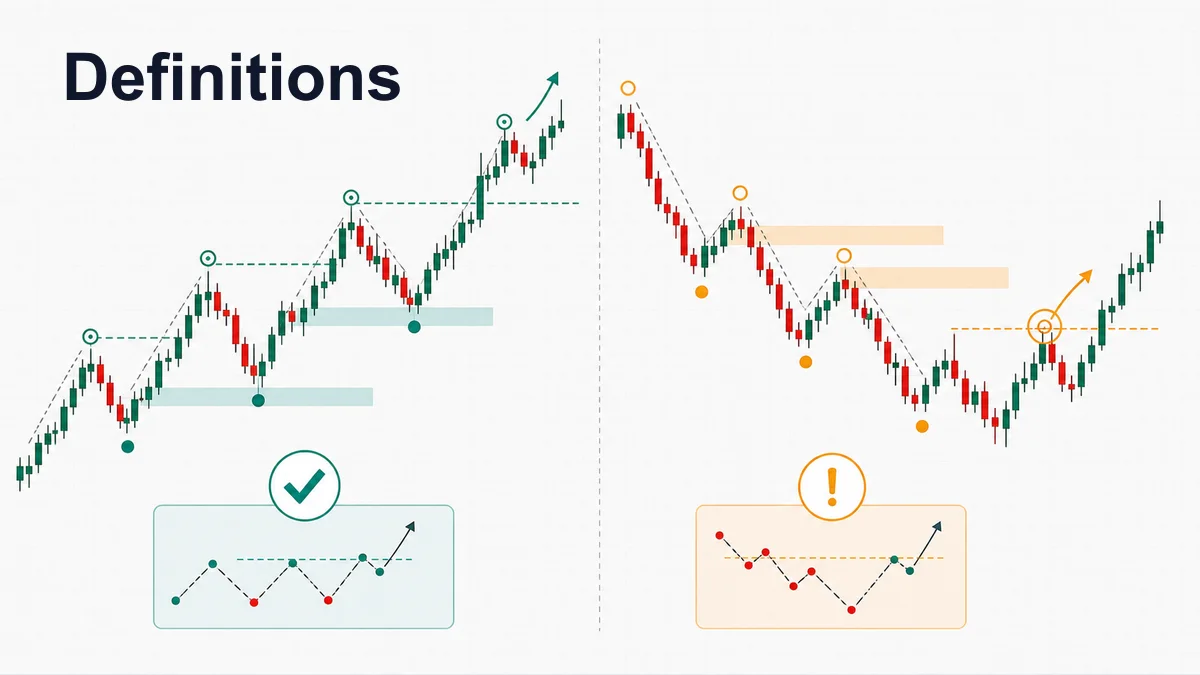
A Break of Structure is a break of a meaningful swing point in the direction of the current structure. In an uptrend, price makes a higher high by breaking the previous swing high. In a downtrend, price makes a lower low by breaking the previous swing low. This suggests that the current structure is still being respected and that the market has created a new continuation leg.
A Change of Character is a break that interrupts the most recent swing sequence. In an uptrend, CHoCH may appear when price breaks below the higher low that supported the latest higher high. In a downtrend, CHoCH may appear when price breaks above the lower high that supported the latest lower low. It is an early warning that the recent control of buyers or sellers may be weakening.
The important word is meaningful. Not every tiny candle break should be called BOS or CHoCH. A useful structure point should be visible, connected to the current price sequence, and important enough that a break changes the trader’s interpretation. If you mark every small wiggle, the chart becomes noisy and both terms lose value.
Key Differences
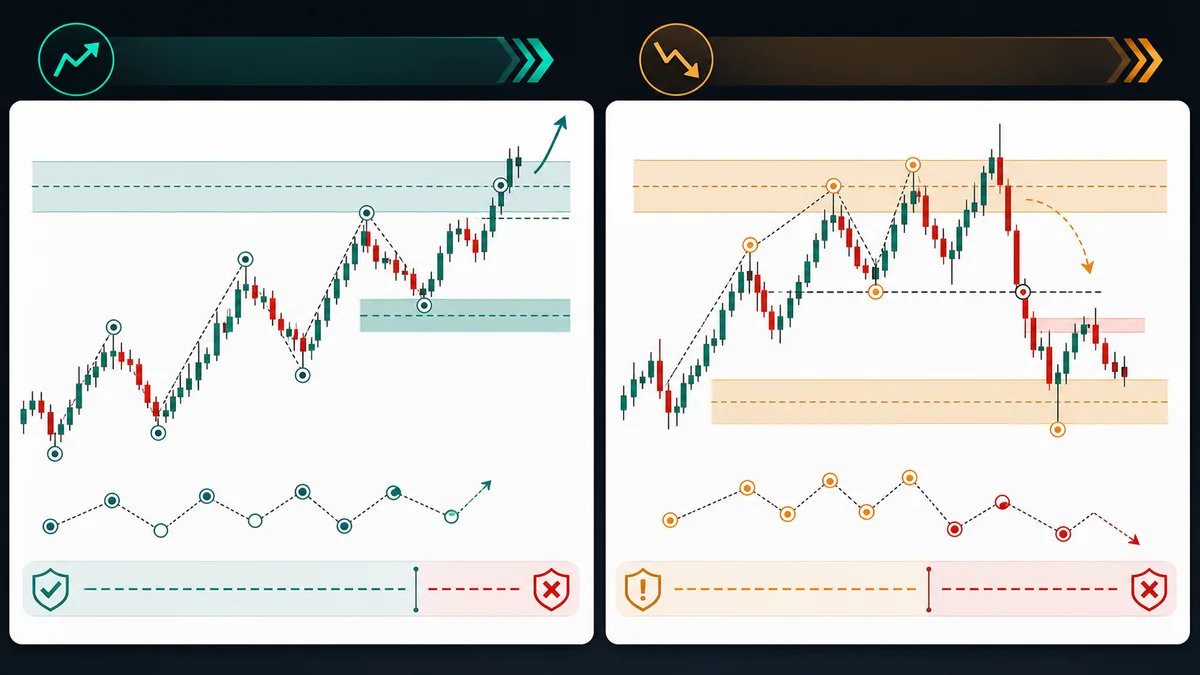
The first difference is direction. BOS normally breaks with the current structure. It says the trend or swing sequence has made progress. CHoCH breaks against the recent minor structure. It says the market may be losing the rhythm that created the previous leg.
The second difference is timing. BOS often appears after the market has already shown strength in the same direction. CHoCH often appears earlier, around a transition area, after a sweep, at a higher-timeframe level, or after momentum starts to weaken. Because CHoCH is earlier, it is also more vulnerable to false signals.
The third difference is usage. BOS is often used to confirm continuation, trail bias, or validate that a pullback has ended. CHoCH is often used to notice a possible reversal, start a lower-timeframe entry model, or warn the trader not to chase the old direction blindly.
The fourth difference is confirmation requirement. A BOS can still fail, but it is usually easier to read because it agrees with the current sequence. A CHoCH needs more context because it may only be a pullback inside a larger trend. This is why multi-timeframe analysis is so important. A five-minute CHoCH against a daily uptrend may be only a short-term correction.
The fifth difference is emotional pressure. BOS often tempts traders to chase continuation after a candle has already moved far. CHoCH often tempts traders to call the top or bottom too early. Both mistakes come from treating a structure break as an entry instead of evidence. A better approach is to let the break tell you that the market is changing state, then wait for a retracement, retest, or lower-timeframe confirmation that gives a more controlled entry.
The sixth difference is where invalidation usually sits. For BOS continuation, invalidation often sits beyond the pullback low in a bullish structure or beyond the pullback high in a bearish structure. For CHoCH reversal planning, invalidation often sits beyond the sweep high, sweep low, or the structure point that created the change of character. If you cannot define where the BOS or CHoCH idea is wrong, the label is not useful yet.
Comparison Table
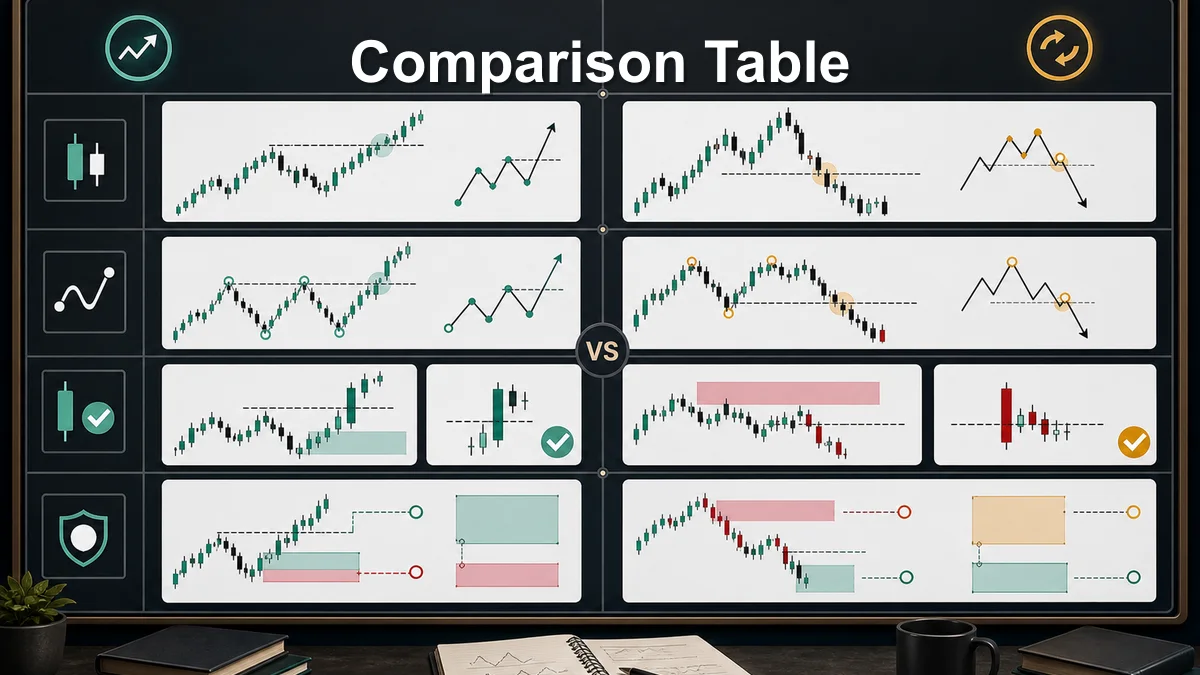
| Factor | Break of Structure | Change of Character |
|---|---|---|
| Main meaning | Continuation of the active structure | Possible shift in recent behavior |
| Typical direction | With the current trend or swing sequence | Against the most recent minor structure |
| Best use | Confirming trend continuation and pullback completion | Spotting early reversal clues or transition risk |
| Main risk | Late entry after an extended move | False reversal signal inside a larger trend |
| Needs context? | Yes, especially target space and trend maturity | Yes, especially higher-timeframe location and liquidity |
This table is not meant to make the decision mechanical. A trader still needs to ask where the break happened, what liquidity was taken before the break, whether the candle closed with intent, and whether the next target has enough room. Structure terms are useful only when they support a full trading plan.
Another useful comparison is the close versus wick question. A candle body close beyond a meaningful swing is usually stronger than a wick through the level. A wick may be a liquidity sweep, a news spike, or a failed breakout. Some traders require a body close for BOS and a clear displacement candle after CHoCH before they trust the signal. That extra filter reduces frequency, but it can also reduce low-quality trades.
When to Use Each
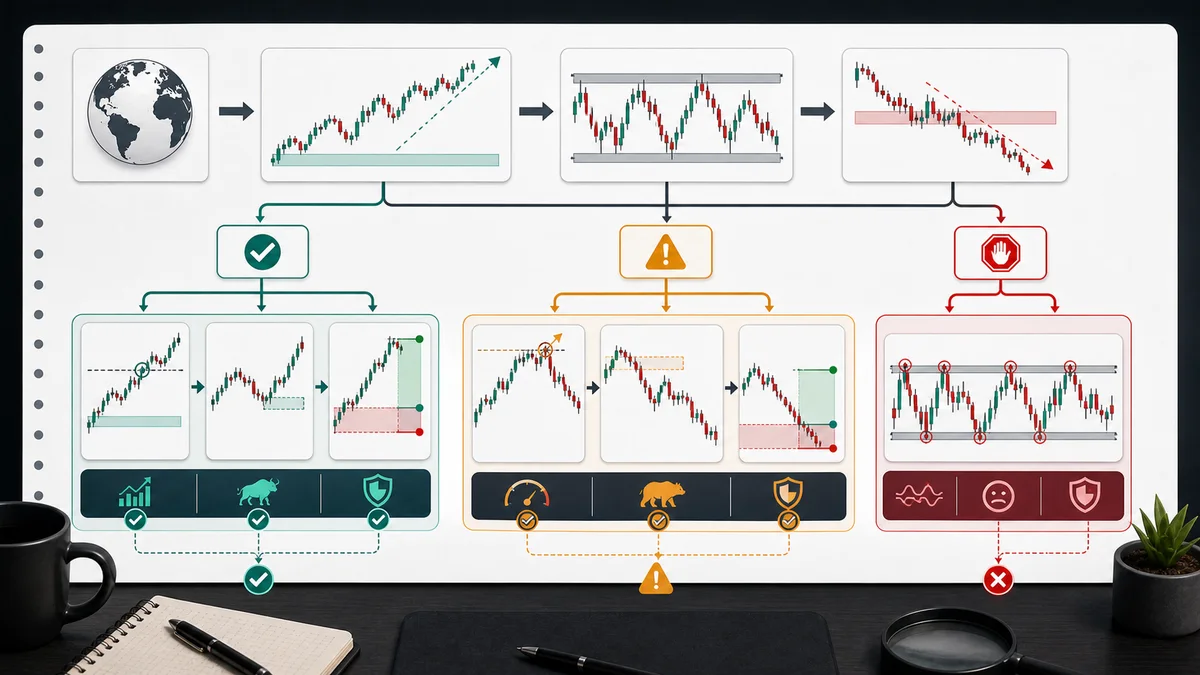
Use BOS when you want to confirm that a market is still following its existing structure. If price is making higher highs and higher lows, a clean break above the previous high can confirm that buyers are still active. If price is making lower highs and lower lows, a clean break below the previous low can confirm that sellers are still active.
BOS is especially useful after a pullback. For example, price may retrace into a support zone inside an uptrend, reject the area, then break a minor high. That break can help confirm that the pullback may be ending and that the larger bullish structure is trying to continue.
Use CHoCH when you want to detect a possible shift in control. For example, if an uptrend sweeps buy-side liquidity above a high and then breaks below the most recent higher low, the market may be changing character. That does not mean you should instantly short. It means the old bullish behavior deserves caution.
CHoCH is strongest when it appears at a meaningful location: a higher-timeframe supply or demand zone, a major support or resistance level, a premium or discount area, or after a clear liquidity sweep. Without location, CHoCH can become another way to overreact to normal pullback movement.
There are also times when neither term should be used aggressively. Inside a tight range, price may break small highs and lows repeatedly without creating a clean directional story. Around major news, price may spike both sides of a level before the real move develops. Near the end of a mature trend, BOS may still appear but offer poor reward because the next liquidity target is too close. The best traders do not label everything. They wait for structure to become clear enough that a trade can be planned.
Examples
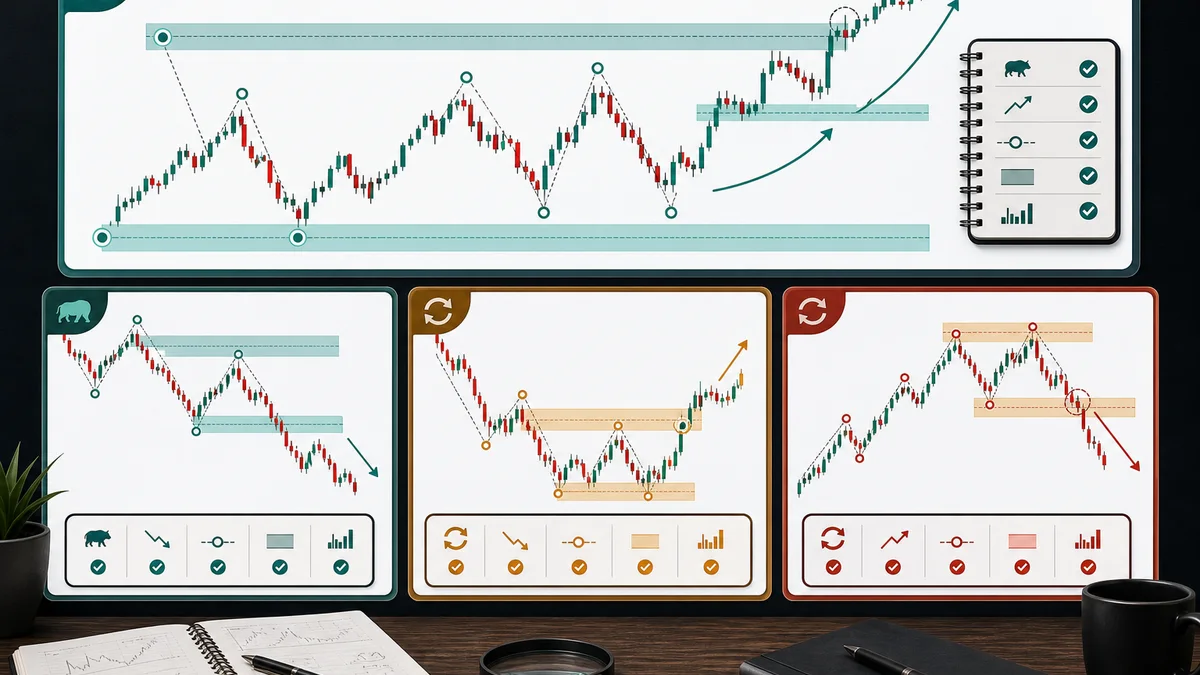
Example one: price is in an uptrend. It creates a higher low, rallies, and breaks the previous swing high with a strong candle close. This is a bullish BOS. The structure has continued. A trader may then watch for a pullback into a demand area, fair value gap, or previous structure zone before planning an entry.
Example two: price is in a downtrend. It creates a lower high, sells off, and breaks the previous swing low. This is a bearish BOS. The downtrend is still active. A trader who wants to sell should avoid entering after the move is already extended and instead wait for a retracement with clear invalidation.
Example three: price is in an uptrend and sweeps above a prior high. Instead of accepting higher, it rejects and breaks below the higher low that supported the last push. This is a bearish CHoCH. It may suggest that buyers are losing control, especially if it happens near a higher-timeframe resistance zone.
Example four: price is in a downtrend and sweeps below a prior low. It quickly reclaims the level and breaks above the lower high that formed before the sweep. This is a bullish CHoCH. It may suggest that sellers are losing control, especially if the move happens near higher-timeframe support or sell-side liquidity.
In all examples, the break is not enough by itself. The trader still needs confirmation, entry logic, stop placement, target space, and risk control. A BOS can become a trap if it breaks into major liquidity and reverses. A CHoCH can fail if it appears in the middle of a strong trend with no higher-timeframe support.
A common example of confusion happens after a strong bullish move. Price breaks a small low on the lower timeframe, and beginners immediately call it CHoCH. But if the higher timeframe still shows a strong uptrend and price is only pulling back into demand, that lower-timeframe CHoCH may simply describe the pullback leg. The trade idea may still become bullish later if price forms a higher low and breaks structure upward again.
The opposite confusion happens after a downtrend. Price breaks a small high and traders call a bullish reversal. But if the break happens directly into higher-timeframe supply, the move may only be a short squeeze or liquidity grab before sellers return. This is why examples should always include location, not only the arrow through a swing point.
Recommendation
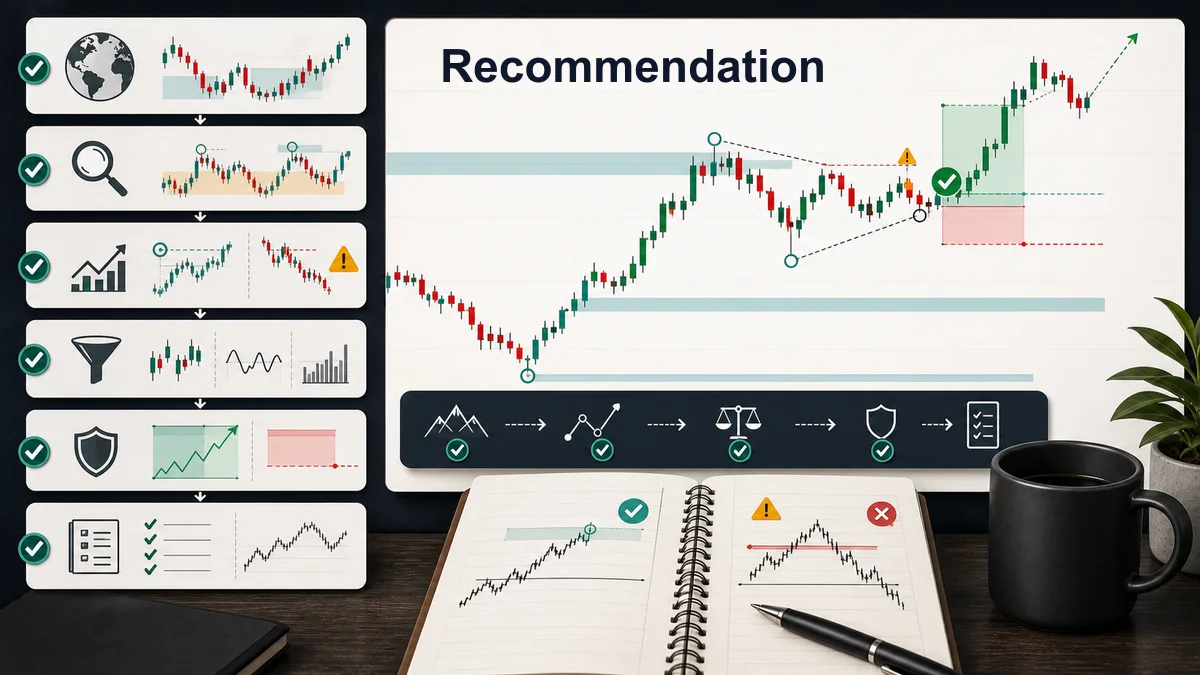
The best recommendation is not to choose BOS or CHoCH as if one is always better. They answer different questions. BOS answers, “Is the current structure continuing?” CHoCH answers, “Is the recent behavior starting to change?” A good trader can use both without forcing either one onto every chart.
Start with the higher timeframe. Decide whether the market is trending, ranging, reversing, or sitting near a major decision area. Then mark only the meaningful swing points. After that, use BOS to confirm continuation and CHoCH to detect potential transition. If a lower-timeframe CHoCH aligns with a higher-timeframe level, it becomes more useful. If it appears randomly in the middle of a trend, treat it with caution.
A simple workflow is this: define the higher-timeframe bias, mark liquidity and structure, wait for BOS or CHoCH at a meaningful level, require displacement or a strong close, plan the entry after confirmation, place invalidation where the structure idea is wrong, and target the next realistic liquidity area.
For beginners, the safest study path is to collect screenshots before risking money. Save examples of clean BOS, failed BOS, clean CHoCH, fake CHoCH, and CHoCH that only became a pullback. Over time, your chart library will teach you more than memorizing definitions. The goal is not to label every candle. The goal is to read structure well enough that your trades have context, confirmation, and a clear reason to be invalidated.
Key takeaways
- BOS usually describes a break that confirms the prevailing structural direction, while CHoCH usually describes an early break against it.
- Definitions vary among educators, so the chosen swing degree and wick-or-close rule must be stated before signals are compared.
- Label the external trend first, then classify breaks with one consistent closing-price rule.
- A valid plan separates location, trigger, invalidation, position size and exit logic.
A validation workflow you can reproduce
- Define the sample: choose the market, timeframe, session and date range before reviewing outcomes.
- Write the rule: Label the external trend first, then classify breaks with one consistent closing-price rule.
- Record invalidation: identify the observable price event that disproves the setup.
- Include execution costs: account for spread, commission and slippage where relevant.
- Validate separately: test the finished rule on data that was not used to create it.
When this concept is unreliable
BOS and CHoCH labels become unreliable when internal noise is mixed with major swings or terminology changes from one example to another. Keep failed and skipped examples in the journal so the review is not limited to attractive winners.
Use this concept within a complete analysis
This method should remain connected to its parent framework and adjacent decision steps. Use Market Structure: Complete Guide for Traders, Higher Highs and Higher Lows Explained, ICT Market Structure Explained, Price Action Trading: Structure, Setups and Risk, Multi-Timeframe Analysis: Complete Guide and Trading Theories: Complete Guide to Technical Analysis Frameworks to compare definitions, establish context and avoid treating one signal as a complete trading system.
References and methodology
Practise before considering real capital
Use historical charts or a demo account to test the written rules before considering live execution. Review the Exness account and demo information. Availability, protections and trading conditions depend on jurisdiction, so review the applicable legal documents yourself.
Affiliate disclosure: Học Làm Trader may receive a commission if you open an account through this link, at no additional cost to you. This relationship does not determine the educational conclusions.
Risk warning: This article is for education and general information only. It is not investment advice, a trade signal or an invitation to trade. Trading can result in loss of capital, and past examples do not guarantee future results. Assess your own circumstances and risk tolerance.