


Wyckoff distribution is one of the most useful models for understanding what may be happening near the end of a mature advance. Instead of assuming every sideways range near the highs is bullish consolidation, the Wyckoff method asks whether demand is being absorbed and whether stronger supply is quietly entering the market.
Quick answer: Wyckoff distribution is a market phase where large interests may distribute positions to late buyers inside a trading range. It usually appears after an uptrend, includes range behavior, buying climax, secondary tests, possible upthrusts, signs of weakness, and eventually a markdown if supply gains control.
This article belongs inside the THEORIES hub and the Wyckoff category. For the bullish side of the same framework, read Wyckoff Accumulation Explained, then use this guide to understand the opposite market phase.
Nothing here is financial advice. Distribution analysis is a framework for reading behavior, not a guarantee that a market will fall.
For beginners, the most important habit is to separate a distribution candidate from confirmed distribution behavior. A candidate is only a market that has rallied and started ranging. Confirmation requires evidence that demand is weakening and supply is creating results.
Definition
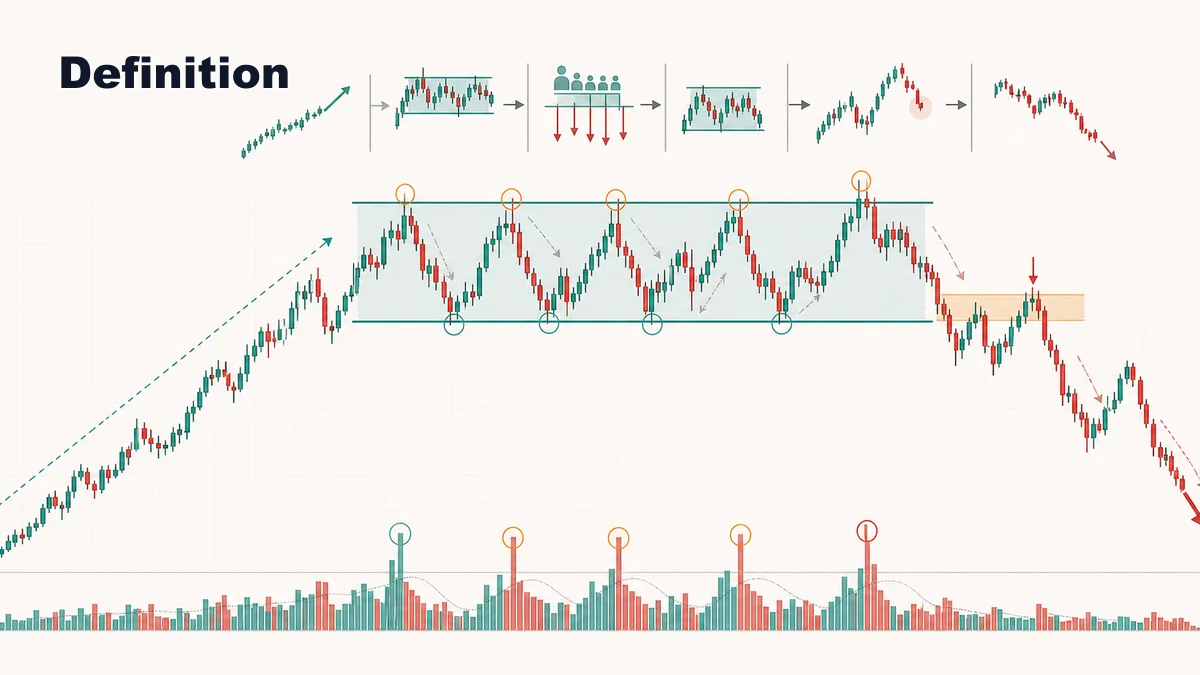
Wyckoff distribution is a sideways structure that may form after a significant uptrend. In Wyckoff language, it is the phase where the Composite Operator may be unloading positions while public demand remains strong enough to absorb that selling for a period of time.
The pattern usually begins with strong upward movement and a Buying Climax. Price then reacts lower, forming an Automatic Reaction, and a trading range starts to develop. As the range continues, rallies may become weaker, breakouts may fail, and selling pressure may begin to create more downside result.
A complete distribution does not need to match a textbook schematic perfectly. The key idea is behavioral: demand that once moved price higher is no longer producing the same upside progress, while supply becomes more visible through rejections, failed breakouts, and signs of weakness.
This is why Wyckoff distribution should be studied as a process rather than a pattern name. A trader is not trying to label every candle. The trader is asking whether buyers are still able to create upside progress, whether sellers are becoming more effective, and where the bearish idea would be wrong.
Distribution is also the opposite side of accumulation. Accumulation studies how supply may be absorbed before markup. Distribution studies how demand may be absorbed before markdown. Learning both helps traders avoid reading every range with the same bias.
How to Identify
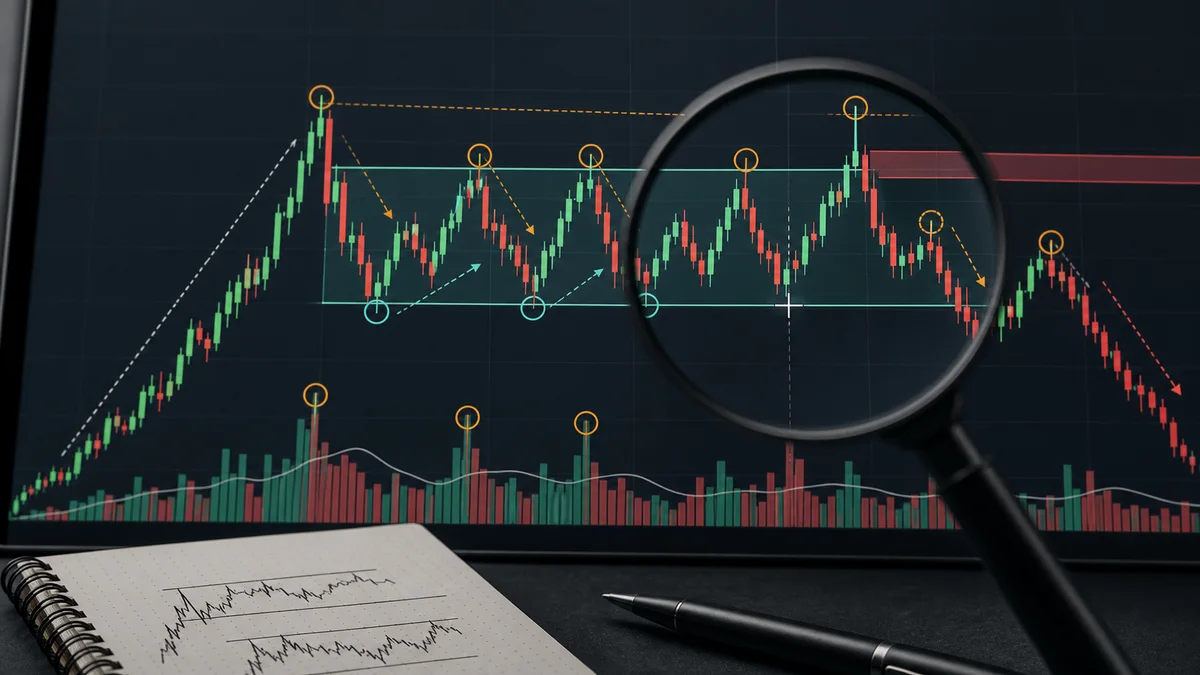
Start with context. Wyckoff distribution is most meaningful after a clear advance. If the market has not been trending higher, the range may simply be sideways consolidation rather than distribution. The stronger the prior advance, the more important it becomes to study whether late buyers are entering at poor locations.
Next, define the range. A Buying Climax often marks the first major exhaustion point, while the Automatic Reaction helps set the lower boundary. Secondary Tests may revisit the upper area. If each push higher produces less progress, that can suggest demand is weakening.
Watch for an upthrust or upthrust after distribution. This occurs when price moves above range resistance, attracts breakout buyers, then fails back inside the range. The failure matters more than the wick. A breakout that holds and accepts above the range may invalidate the bearish distribution read.
Also study the downside reactions. A Sign of Weakness appears when price breaks lower with stronger selling pressure and poor recovery. Later, a weak rally back toward supply may become a Last Point of Supply if sellers defend it.
Volume can help, but it should be read with price result. High volume with no upside progress near resistance can suggest absorption. Strong downside movement after repeated failed rallies can show that sellers are finally producing result. If volume data is not available, focus more heavily on structure, candle spread, closing location, and follow-through.
Do not ignore the higher timeframe. A range that looks bearish on a small chart may only be a shallow pause inside a strong weekly trend. The best distribution reads usually have exhaustion, range behavior, and confirmation on the timeframe that actually controls the trade idea.
Why It Works
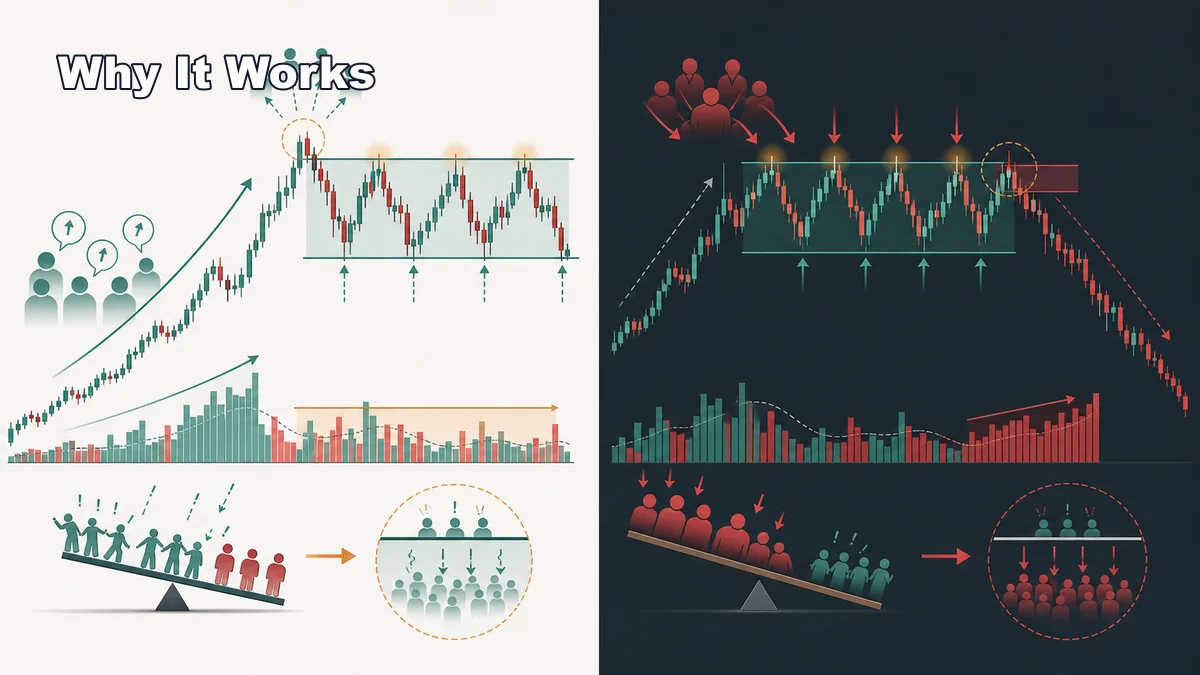
Wyckoff distribution works because large positions usually cannot be sold all at once without moving price sharply lower. A range allows supply to be released gradually while public buying, short covering, and breakout enthusiasm provide liquidity.
The model also helps traders avoid buying late in an exhausted trend. A market can look strong near the top because rallies are still appearing. Wyckoff analysis asks a deeper question: are those rallies producing real progress, or are they being absorbed by sellers?
Distribution becomes useful when it shifts the trader from prediction to evidence. The goal is not to call the exact top. The goal is to recognize when demand is failing, supply is increasing, and risk can be defined before a possible markdown phase.
The model also protects traders from emotional breakout buying. Near market highs, news and sentiment can still look positive. Wyckoff distribution reminds traders to watch the quality of the breakout, not only the excitement around it. A breakout that cannot hold above the range may reveal that demand was used as liquidity.
Step-by-Step Usage
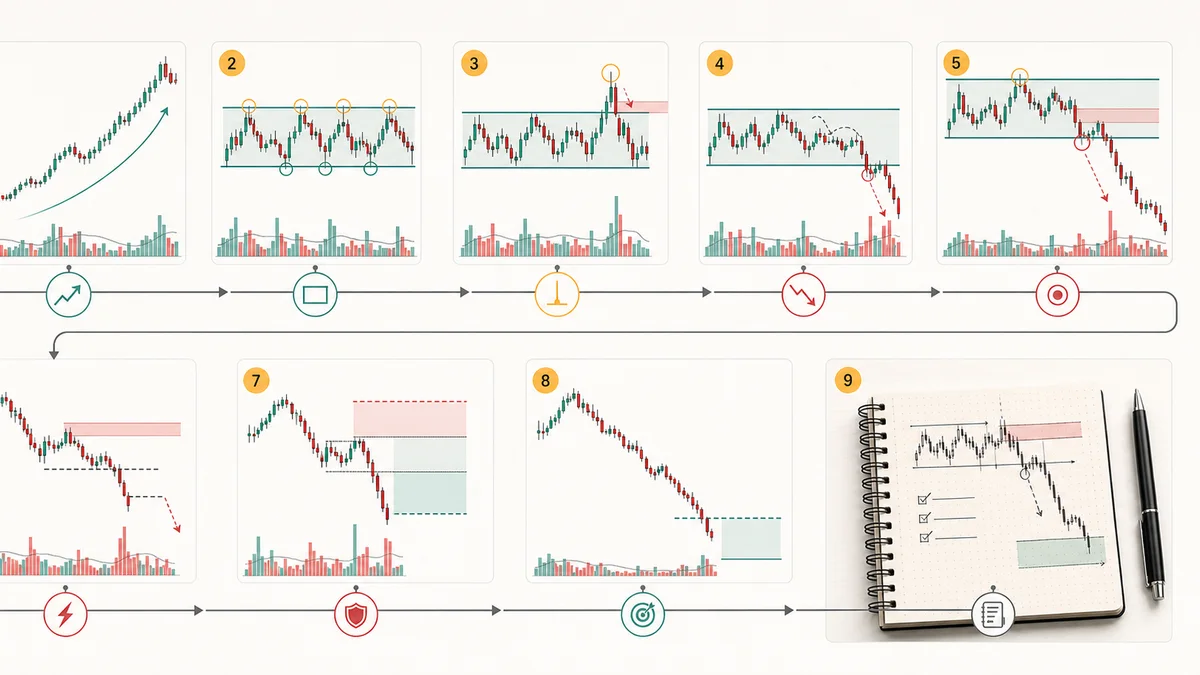
- Find the prior uptrend. Distribution has more meaning when it appears after a mature bullish campaign.
- Mark the trading range. Use the Buying Climax and Automatic Reaction as early boundaries, then refine only when price proves cleaner levels.
- Study the tests. Secondary Tests near the high should show whether demand still has strength or is beginning to fade.
- Watch the upthrust. A failed breakout above the range can reveal trapped buyers, but only if price returns inside and follows through lower.
- Wait for weakness. A Sign of Weakness should show real downside progress, not just a small candle below support.
- Plan around the Last Point of Supply. A weak rally after the breakdown can offer a cleaner location for risk.
- Define invalidation. If price reclaims the range or accepts above resistance, the distribution thesis should be questioned.
Many traders get hurt by shorting too early in Phase B. The range can continue longer than expected, and a real breakout can still happen. Patience is part of the method.
A conservative trader can use the distribution read as a warning before using it as a short setup. First, reduce the urge to buy late rallies. Then wait for the market to show weakness. Only after weakness appears should the trader plan entries, stops, and targets. This sequence keeps the method practical.
Confirmation Rules
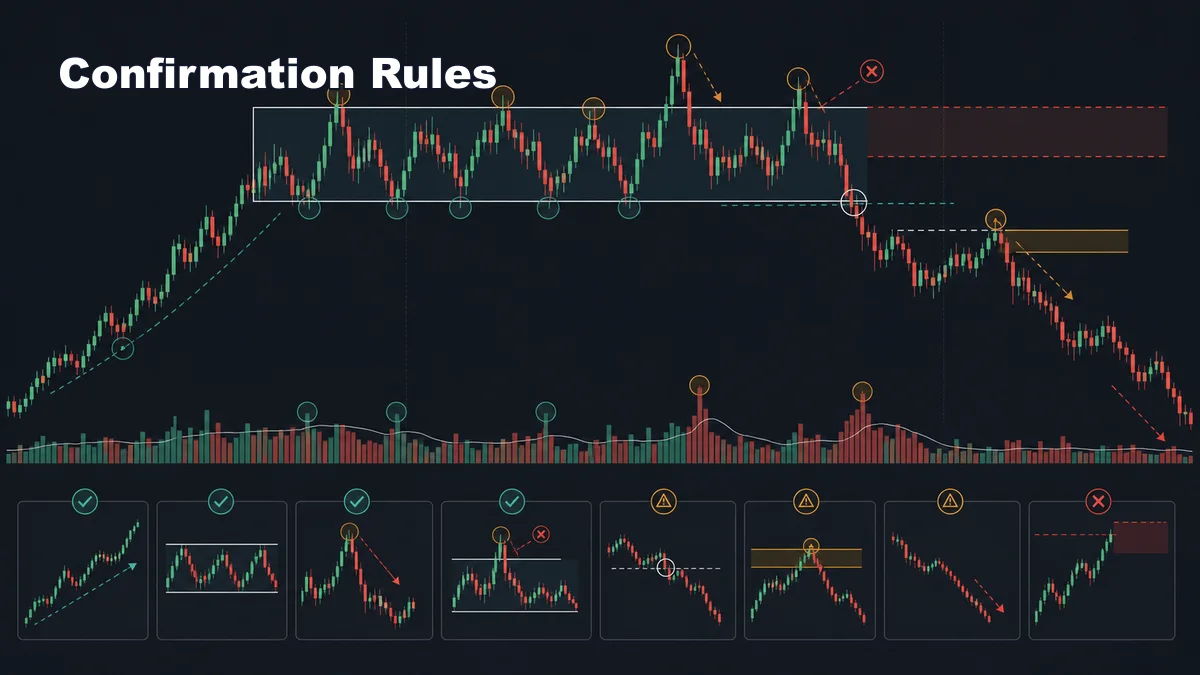
Confirmation matters because many ranges near the highs continue higher. A trader should not call distribution simply because price has stopped rising for a few candles.
- Clear prior advance: the structure should appear after a meaningful uptrend or extended rally.
- Range clarity: support and resistance should be visible enough to plan around.
- Weakening rallies: later pushes into the high should show less upside result or faster rejection.
- Upthrust failure: a move above resistance should fail back inside the range and attract selling.
- Sign of Weakness: price should break lower with stronger result than earlier pullbacks.
- Last Point of Supply: a weak rally after breakdown should fail below key resistance.
- Invalidation: acceptance above the range or strong demand after a breakdown can cancel the thesis.
The cleanest bearish ideas often come after weakness is visible, not at the first sign of hesitation near the top.
One useful filter is to ask whether the market has trapped one side. A failed upthrust can trap breakout buyers. A failed rally after a breakdown can trap late dip buyers. When trapped participation aligns with a clear risk level, the distribution idea becomes easier to manage.
Examples
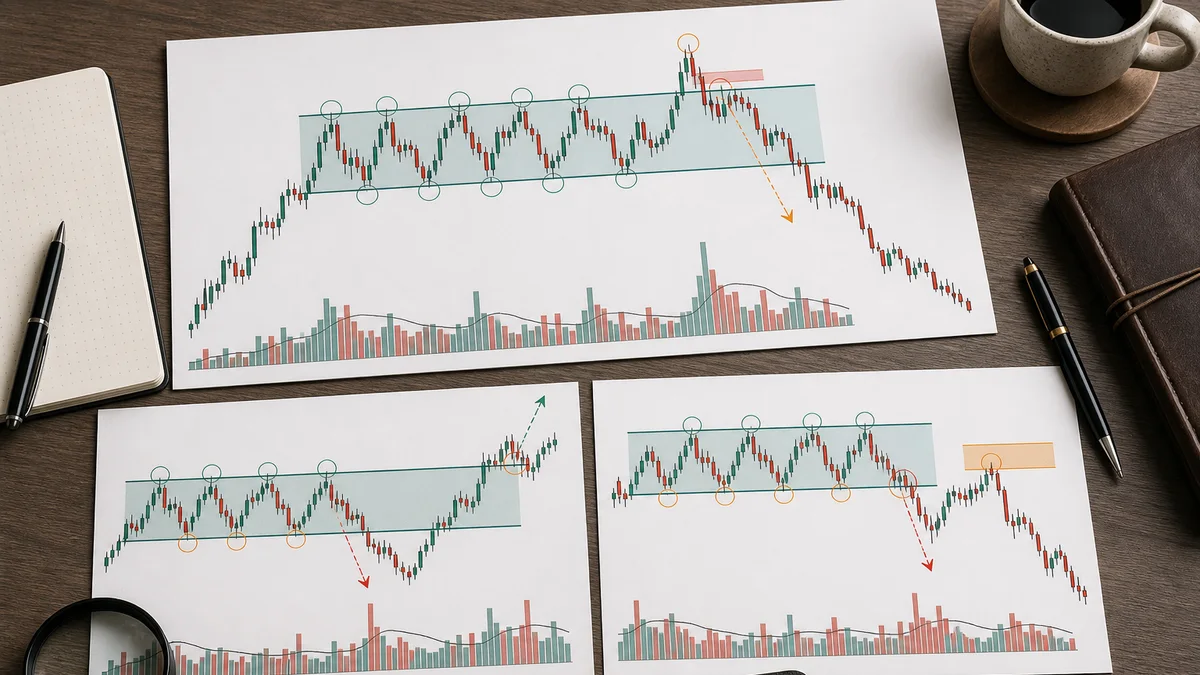
Imagine a stock that rallies for several weeks, then prints a wide-range candle on high participation and quickly reacts lower. The first reaction creates the lower edge of the range. Over the next sessions, price pushes back toward the high but cannot create meaningful new upside progress.
Later, price breaks above resistance and attracts breakout buyers. If it quickly falls back into the range and then breaks the midpoint with strong downside pressure, the upthrust becomes useful evidence. A trader may then wait for a weak rally that fails below the old high.
A failed bearish example is also important. If price breaks above the range, holds above it, and uses the old resistance as support, that is not distribution confirmation. It may be continuation, reaccumulation, or simply a strong breakout.
Another example is a slow range that never breaks down. Price may test resistance several times, react lower, and still hold support. If no Sign of Weakness appears, a bearish trader has no confirmation. In that case, the correct decision may be to stay neutral until the market chooses a direction.
Common Mistakes
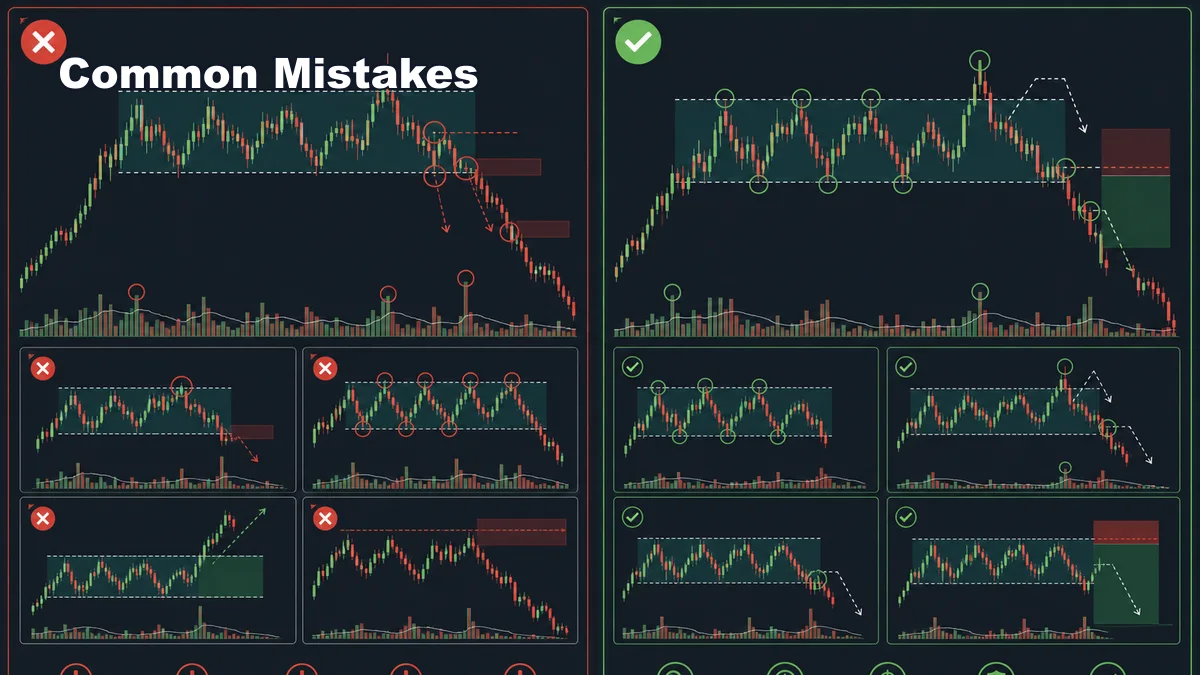
- Calling every top range distribution: a pause after an uptrend is only a candidate until supply proves itself.
- Shorting Phase B too early: the range can stay bullish or neutral for a long time before any markdown appears.
- Misreading a real breakout as an upthrust: an upthrust should fail. If price accepts above the range, respect the evidence.
- Ignoring volume and result: Wyckoff is not only labels. It studies effort, result, and the quality of reactions.
- Forcing exact schematics: real markets rarely print perfect textbook sequences.
- No invalidation: a bearish thesis needs a clear point where strong demand proves it wrong.
Wyckoff distribution is valuable because it teaches patience near market highs. It keeps traders from blindly buying late rallies and also from shorting too soon. Study it alongside the THEORIES hub, the Wyckoff category, and Wyckoff Accumulation Explained so accumulation and distribution become two sides of one practical framework.
The best use of Wyckoff distribution is not to predict every top. It is to wait for evidence that demand is weakening, supply is gaining control, and a trade idea has a clear invalidation point.
When used well, Wyckoff distribution makes traders more patient. It encourages them to study the range, respect invalidation, and wait for the market to prove that sellers are doing more than simply pausing the uptrend.
A distribution range can include several tests of resistance. The dedicated Wyckoff Upthrust and UTAD guide explains how Phase B and Phase C events differ. For the inverse behavior at accumulation support, see the Spring and Test validation guide.
Sources and limits
General market-risk and technical-analysis references:
Strategy labels and chart examples are interpretive; they are not standardized signals and do not guarantee outcomes.
Related reading: Wyckoff Upthrust and UTAD: Failed Breakout or Distribution?
Place in the learning route: Start with the Wyckoff method pillar to connect distribution events with phases, range context and invalidation before treating a label as a standalone signal.