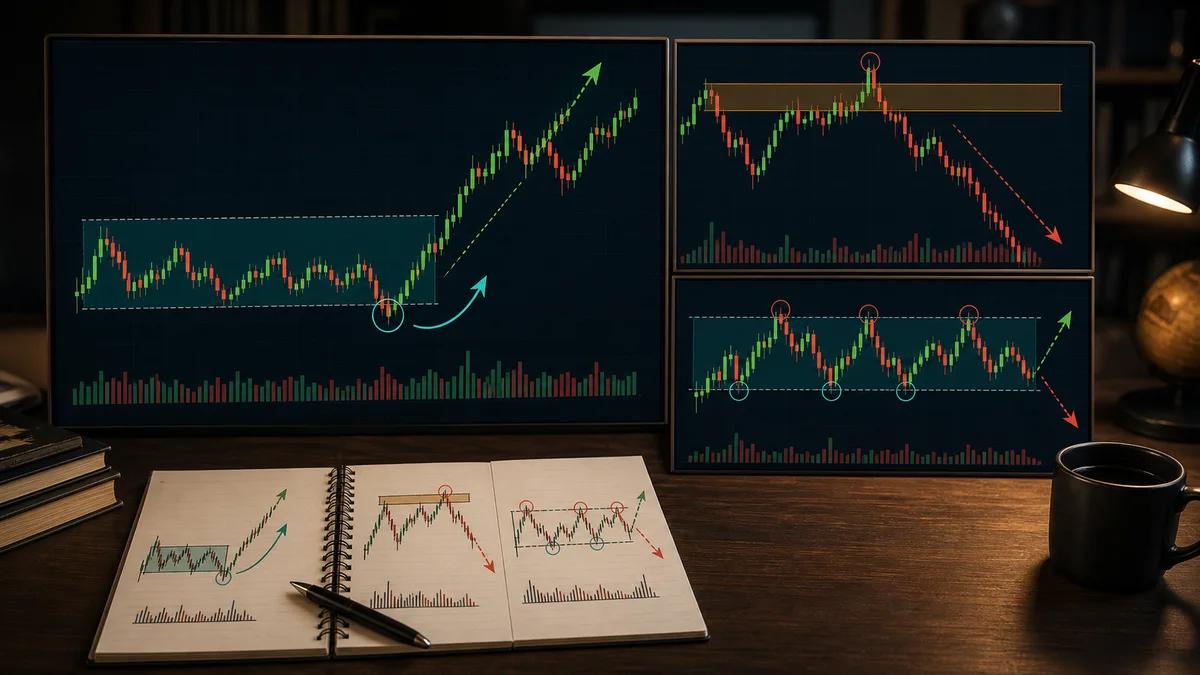
Wyckoff Method: Complete Beginner Guide

The Wyckoff Method is one of the most useful frameworks for traders who want to understand why price moves through accumulation, expansion, distribution, and decline. Instead of treating every candle as a random signal, the Wyckoff Method asks a practical question: are strong market participants absorbing supply, distributing inventory, testing demand, or pushing price into a new phase?

For beginners, Wyckoff can look complicated because many charts are covered with labels such as Phase A, Phase B, spring, upthrust, sign of strength, and last point of support. Those labels matter, but they are not the heart of the method. The heart of Wyckoff is reading the relationship between price, volume, range behavior, and market context. When that relationship is clear, the labels become easier to understand.

This guide explains the Wyckoff Method from the ground up. You will learn what it means, the core principles, key patterns and models, how to identify Wyckoff structure on a chart, a practical trading workflow, example scenarios, and related guides to study next. It is written as the parent guide for the Wyckoff category inside the THEORIES hub, so future cluster articles can link back here and build a clean learning path.

Nothing in this article is financial advice or investment advice. Trading involves risk, and no Wyckoff schematic, spring, breakout, or volume clue can predict the future with certainty. Regulators such as the CFTC warn traders to be cautious of systems or educators that promise easy returns. Use Wyckoff as a decision framework, not as a guarantee.

Definition: What Is the Wyckoff Method?

Definition of the Wyckoff Method showing a market cycle from accumulation to markup distribution and markdown
The Wyckoff Method is a chart-reading framework for understanding market cycles through supply, demand, price action, and volume.

The Wyckoff Method is a technical analysis framework developed from the work of Richard D. Wyckoff, who studied how large operators and informed market participants accumulate, mark up, distribute, and mark down assets. In modern trading language, it helps traders read whether price is building a base, breaking out, topping, or entering a decline.

A simple definition is this: the Wyckoff Method studies the battle between supply and demand through price structure, volume behavior, and trading range development. If demand is stronger than supply, price is more likely to rise. If supply is stronger than demand, price is more likely to fall. If both sides are balanced, price often moves inside a range until one side gains control.

The method is not only about one pattern. It is a full way of thinking. A Wyckoff trader asks whether the market is in accumulation, markup, distribution, or markdown. Accumulation is a base-building phase where stronger hands may absorb supply. Markup is the advance that follows successful accumulation. Distribution is a topping phase where stronger hands may sell into demand. Markdown is the decline that follows failed demand and dominant supply.

Wyckoff analysis often appears on charts as a schematic. A schematic is a simplified model of how a trading range may develop. In accumulation, traders may look for a selling climax, automatic rally, secondary test, spring, sign of strength, and last point of support. In distribution, they may look for a buying climax, automatic reaction, secondary test, upthrust, sign of weakness, and last point of supply.

Beginners should treat these schematics as maps, not scripts. Real markets rarely follow textbook diagrams perfectly. Sometimes price accumulates without a clean spring. Sometimes distribution happens without a dramatic upthrust. Sometimes a breakout fails and returns to the range. The Wyckoff Method is strongest when it helps you read the current story instead of forcing the chart to match a template.

The practical purpose of the Wyckoff Method is to improve context. It helps traders avoid buying into distribution, shorting into accumulation, or chasing breakouts without understanding the range behind them. It also gives a structure for planning: where is the range, what phase may price be in, what evidence confirms the idea, and where is the idea invalidated?

Core Principles of the Wyckoff Method

Core principles of the Wyckoff Method including supply and demand cause and effect effort versus result and market phases
Wyckoff principles help traders connect supply and demand, cause and effect, effort versus result, and market phase analysis.

The first core principle is the law of supply and demand. Price rises when demand is stronger than available supply. Price falls when supply is stronger than available demand. In Wyckoff analysis, this is not an abstract economic phrase. It is read directly from the chart through price spread, volume, reaction strength, range behavior, and follow-through.

The second principle is the law of cause and effect. Wyckoff viewed trading ranges as areas where cause is built. A long accumulation range may create the cause for a future markup. A long distribution range may create the cause for a future markdown. This does not mean a range automatically produces a trend, but it does remind traders that large moves often begin after a period of preparation.

The third principle is the law of effort versus result. Volume can be read as effort, while price movement is the result. If volume is high but price makes little progress, the market may be absorbing supply or demand. If volume expands and price moves strongly in the same direction, the effort is producing a clear result. If effort and result do not match, the trader should pay attention.

The fourth principle is composite operator thinking. Wyckoff used the idea of a composite operator as a mental model for large informed interests. The point is not to prove exactly who is buying or selling. The point is to think in terms of campaign behavior: accumulation before advance, distribution before decline, and tests that reveal whether supply or demand still remains.

The fifth principle is context before entry. A spring inside a mature accumulation range is very different from a random wick below support in a weak downtrend. A sign of strength after repeated successful tests is different from a breakout in the middle of a noisy range. Wyckoff setups become more useful when the surrounding story supports them.

The sixth principle is confirmation. A trader should not assume that every range is accumulation or every failed high is distribution. Price needs to confirm the idea through tests, breakout quality, volume behavior, and follow-through. Confirmation does not remove risk, but it keeps the trader from acting too early.

The seventh principle is invalidation. Every Wyckoff scenario should have a point where the story is wrong. If an accumulation idea depends on price holding above a last point of support, acceptance back below that area may invalidate the setup. If a distribution idea depends on weakness after an upthrust, strong acceptance above the range may invalidate the bearish idea.

The eighth principle is simplicity. Wyckoff charts can become overloaded with labels. A cleaner approach is to identify the range, ask what phase may be forming, compare price with volume, wait for a test or confirmation, and define risk. Labels should serve the decision, not decorate the chart.

Key Wyckoff Patterns and Models

Key Wyckoff patterns and models showing accumulation distribution spring upthrust sign of strength and sign of weakness
Key Wyckoff models include accumulation, distribution, springs, upthrusts, signs of strength, and signs of weakness.

The first key model is accumulation. Accumulation is a trading range where stronger demand may gradually absorb available supply. It often appears after a decline, when many traders are still bearish but downside progress becomes weaker. A classic accumulation model may include a selling climax, automatic rally, secondary test, spring, sign of strength, and last point of support.

The second model is distribution. Distribution is a trading range where stronger supply may gradually absorb demand. It often appears after an advance, when many traders are still bullish but upside progress becomes weaker. A classic distribution model may include a buying climax, automatic reaction, secondary test, upthrust, sign of weakness, and last point of supply.

The third pattern is the spring. A spring happens when price moves below support in an accumulation range, attracts selling or stop orders, then quickly returns back into the range. The key is the reaction after the break. If price breaks support and keeps falling, that is not a successful spring. If price rejects and demand appears, the spring may show that supply has been absorbed.

The fourth pattern is the upthrust. An upthrust is the bearish counterpart to a spring. Price moves above resistance in a distribution range, attracts breakout buyers or buy stops, then fails back into the range. If price cannot hold above resistance and selling appears, the upthrust may reveal that demand has been exhausted.

The fifth model is the sign of strength. A sign of strength is a strong upward move away from the range after demand has shown control. It is usually more meaningful when it follows a successful test, spring, or base-building phase. A weak breakout with poor follow-through is lower quality than a decisive sign of strength with volume and acceptance.

The sixth model is the sign of weakness. A sign of weakness is a strong downward move away from the range after supply has shown control. It may follow an upthrust, failed breakout, or loss of support. A sign of weakness becomes more credible when rallies back toward the range fail to regain control.

The seventh model is the test. Wyckoff traders care deeply about tests because tests reveal whether supply or demand remains. After a spring, a successful test may hold above the spring low with reduced selling pressure. After an upthrust, a successful bearish test may fail below resistance with weak demand. Tests help traders avoid entering only because of one dramatic candle.

Future cluster guides can go deeper into Wyckoff accumulation, Wyckoff distribution, Wyckoff springs, Wyckoff upthrusts, and Wyckoff schematics. Each cluster should link back to this pillar so the category has a clear parent page.

How to Identify Wyckoff on a Chart

How to identify Wyckoff on a chart using trading range boundaries spring breakout retest volume and phase analysis
Identify Wyckoff by reading the trading range, volume behavior, tests, springs, breakouts, and phase transitions.

Start by identifying the market context. Is the market coming from a major decline, a long advance, or a broad sideways range? Wyckoff analysis works best when you understand the higher-timeframe story first. An accumulation idea after a long decline may make more sense than an accumulation label inside a strong active downtrend with no evidence of demand.

Next, mark the trading range. A Wyckoff range usually has a clear upper boundary and lower boundary created by repeated reactions. The range does not need to be perfectly horizontal, but it should be obvious enough that other traders may also see the support and resistance areas. If the range is unclear, the Wyckoff phase labels will probably be unclear too.

Then study the early reactions. After a decline, a selling climax and automatic rally may define the first boundaries of a possible accumulation range. After an advance, a buying climax and automatic reaction may define the first boundaries of a possible distribution range. These early events help you establish the range before looking for later tests.

After that, compare volume with price progress. Is high volume producing little downside progress near support? That may suggest absorption. Is high volume producing little upside progress near resistance? That may suggest supply. Is volume expanding with strong movement out of the range? That may suggest that one side has finally gained control.

Next, look for tests around important levels. In accumulation, price may test the lower part of the range and fail to make meaningful new lows. In distribution, price may test the upper part of the range and fail to continue higher. A good test often has reduced pressure compared with the earlier extreme.

Then watch for the spring or upthrust only if the range context supports it. A spring should break below support and recover with strength. An upthrust should break above resistance and fail back into the range. The trap itself is not enough. The reaction after the trap is what matters.

Finally, wait for confirmation outside the range or near the last support or supply point. For bullish Wyckoff analysis, traders often want a sign of strength and a last point of support before planning continuation. For bearish analysis, they may want a sign of weakness and a last point of supply. If price is still in the middle of the range, patience is often better than prediction.

A Practical Wyckoff Trading Workflow

A practical Wyckoff trading workflow from market context to range diagnosis phase analysis confirmation entry invalidation target and review
A Wyckoff workflow keeps analysis focused on context, range structure, confirmation, invalidation, targets, and review.

A practical workflow begins with higher-timeframe context. Before labeling any phase, decide whether the market is trending, ranging, reversing, or approaching a major support or resistance area. Wyckoff is a context method. The same candle can mean different things depending on where it appears in the larger structure.

Step two is range diagnosis. Draw the range boundaries and ask whether the market has shown accumulation-like or distribution-like behavior. In accumulation, downside attempts should begin to lose quality over time. In distribution, upside attempts should begin to lose quality over time. The goal is not to guess the phase; the goal is to collect evidence.

Step three is event mapping. Mark the major events without over-labeling every candle. For accumulation, note possible selling climax, automatic rally, secondary test, spring, sign of strength, and last point of support. For distribution, note possible buying climax, automatic reaction, secondary test, upthrust, sign of weakness, and last point of supply.

Step four is volume and effort analysis. Ask whether volume confirms or contradicts price movement. If price makes a new low with less downside result, supply may be weakening. If price pushes above resistance with strong volume and acceptance, demand may be real. If price breaks out but immediately fails, the market may be trapping late participants.

Step five is confirmation. Do not enter only because a label appears. Wait for the market to show that the phase reading is working. A bullish idea may need recovery after a spring, a sign of strength, and a controlled pullback. A bearish idea may need failure after an upthrust, a sign of weakness, and a weak rally back toward supply.

Step six is trade planning. Define entry area, invalidation, target, and position risk before taking action. A bullish setup may use the last point of support as a planning area, with invalidation below the relevant test. A bearish setup may use the last point of supply, with invalidation above the failed test or range high.

Step seven is target selection. Wyckoff targets can come from the opposite side of the range, prior swing structure, measured cause from the range, or higher-timeframe liquidity. Targets should be realistic. If the target requires price to ignore several major levels, the plan may be too optimistic.

Step eight is review. Save screenshots before and after the trade. Write down the range, phase idea, evidence, confirmation, entry reason, invalidation, target, result, and emotional state. Wyckoff improves through repeated observation. Without a journal, it is easy to remember only the perfect schematics and forget the messy failures.

Wyckoff Method Examples

Wyckoff Method examples showing accumulation spring markup distribution upthrust markdown and failed breakout scenarios
Wyckoff examples should include accumulation, distribution, spring, upthrust, breakout, and failure scenarios.

Example one: price has been falling for several weeks, then sells off sharply on high volume. After that selloff, price rebounds quickly and forms a range. Later, price revisits the low but cannot make meaningful downside progress. If the next decline below support quickly recovers back into the range, a trader may interpret it as a possible spring. The trade idea becomes stronger only if demand follows through with a sign of strength.

Example two: price forms a broad base and then breaks above range resistance with expanding spread and volume. Instead of chasing the breakout candle, a Wyckoff trader may wait for a pullback that holds above the prior resistance area. If that pullback is controlled and demand returns, it may act as a last point of support. Invalidation could sit below the failed support test.

Example three: price has been advancing strongly and then forms a sideways range near highs. The first reaction down is sharp, but buyers continue to push price back toward resistance. Later, price moves above the range high but fails to hold. If the upthrust is followed by weakness and poor rallies, the trader may suspect distribution. The bearish idea still needs confirmation through a sign of weakness or failed retest.

Example four: price breaks above a range and every trader calls it a sign of strength, but the breakout has weak volume, no acceptance, and quickly falls back inside the range. This is a warning. A breakout without result may be a trap or simply a low-quality signal. Wyckoff analysis should help you question breakouts, not blindly chase them.

Example five: a trader labels every range as accumulation because they want to buy. This is a common beginner mistake. Some ranges are redistribution, some are distribution, and some are just noisy balance. The correct question is not “where can I place the label?” The better question is “what is supply and demand actually showing?”

Example six: a trader sees a spring and enters immediately, but the market continues lower and never returns to the range. In that case, the break was not a successful spring. It was a breakdown. This is why confirmation and invalidation matter. The Wyckoff Method should make a trader more disciplined, not more eager to predict reversals.

These examples show that Wyckoff is about sequence. Context creates the possible story. The range builds evidence. The test reveals whether supply or demand remains. The sign of strength or weakness confirms control. The trade plan defines risk. If one part of the sequence is missing, patience is usually the better choice.

Related guides and next learning path for the Wyckoff Method including trading theories accumulation distribution volume market structure and risk management
The best Wyckoff learning path connects trading theories with accumulation, distribution, volume analysis, structure, and risk management.

The Wyckoff Method belongs inside the THEORIES hub because it is one of the major technical analysis frameworks traders use to understand market behavior. This article should act as the parent pillar for the Wyckoff category, with future cluster articles linking back to it.

The first related guide to read is Trading Theories: Complete Guide to Technical Analysis Frameworks. It explains how Wyckoff fits beside Dow Theory, Elliott Wave, Gann Theory, price action, chart patterns, and other ways of organizing market behavior.

Next, study Market Structure. Wyckoff analysis depends on swings, ranges, breaks, failed breakouts, continuation, and reversal behavior. If market structure is unclear, Wyckoff phase analysis usually becomes subjective.

You should also review Price Action Trading and Candlestick Patterns. Springs, upthrusts, tests, signs of strength, and signs of weakness all rely on how price behaves around important levels.

Future Wyckoff clusters can include Wyckoff accumulation explained, Wyckoff distribution explained, Wyckoff spring trading guide, Wyckoff upthrust trading guide, Wyckoff volume analysis, Wyckoff phase analysis, and Wyckoff trading range guide.

A good beginner path is simple: learn the market cycle, study supply and demand, practice marking ranges, observe volume versus price result, learn accumulation and distribution schematics, then focus on one setup such as a spring with confirmation or an upthrust with confirmation. Build a screenshot journal and review both winning and losing examples.

The Wyckoff Method can make a trader more patient because it shifts attention from isolated signals to market development. It becomes dangerous only when the trader forces labels, ignores invalidation, or treats schematics as predictions. Use Wyckoff to read the story, define the risk, and wait for evidence.

Phase C needs confirmation rather than prediction. At the lower boundary, follow the Wyckoff Spring and Test workflow. At the upper boundary, use the Upthrust and UTAD guide to compare rejection with genuine breakout acceptance.