


A Wyckoff Upthrust is a move above trading-range resistance that fails to hold and returns into the range. An Upthrust After Distribution, or UTAD, is a more specific Phase C event that tests demand near the end of a potential distribution. Neither label is confirmed by an upper wick alone. Traders should evaluate the maturity of the range, the close back inside, the quality of a later Test, and whether price produces a Sign of Weakness. Acceptance above resistance favors a genuine breakout instead.
Key takeaways
- Upthrust describes failed acceptance above range resistance; UTAD describes a specific late distribution test.
- A UT in Phase B and a UTAD in Phase C do not carry the same structural meaning.
- The close and follow-through matter more than wick length.
- A Test and Sign of Weakness provide stronger evidence than immediate shorting at resistance.
- Holding above resistance invalidates the bearish failed-breakout scenario.
Where UTAD fits in Wyckoff distribution
A potential distribution usually follows an advance. Phase A slows demand, Phase B builds a range, Phase C may include a UTAD that tests whether demand can sustain prices above resistance, and Phase D shows weakness through a Sign of Weakness and Last Point of Supply. Some distributions do not produce a textbook UTAD, so its absence does not invalidate the entire range.
The context is covered in the Wyckoff Method guide, Wyckoff Distribution article and schematics guide. Use those pages to establish phase before analyzing the event.
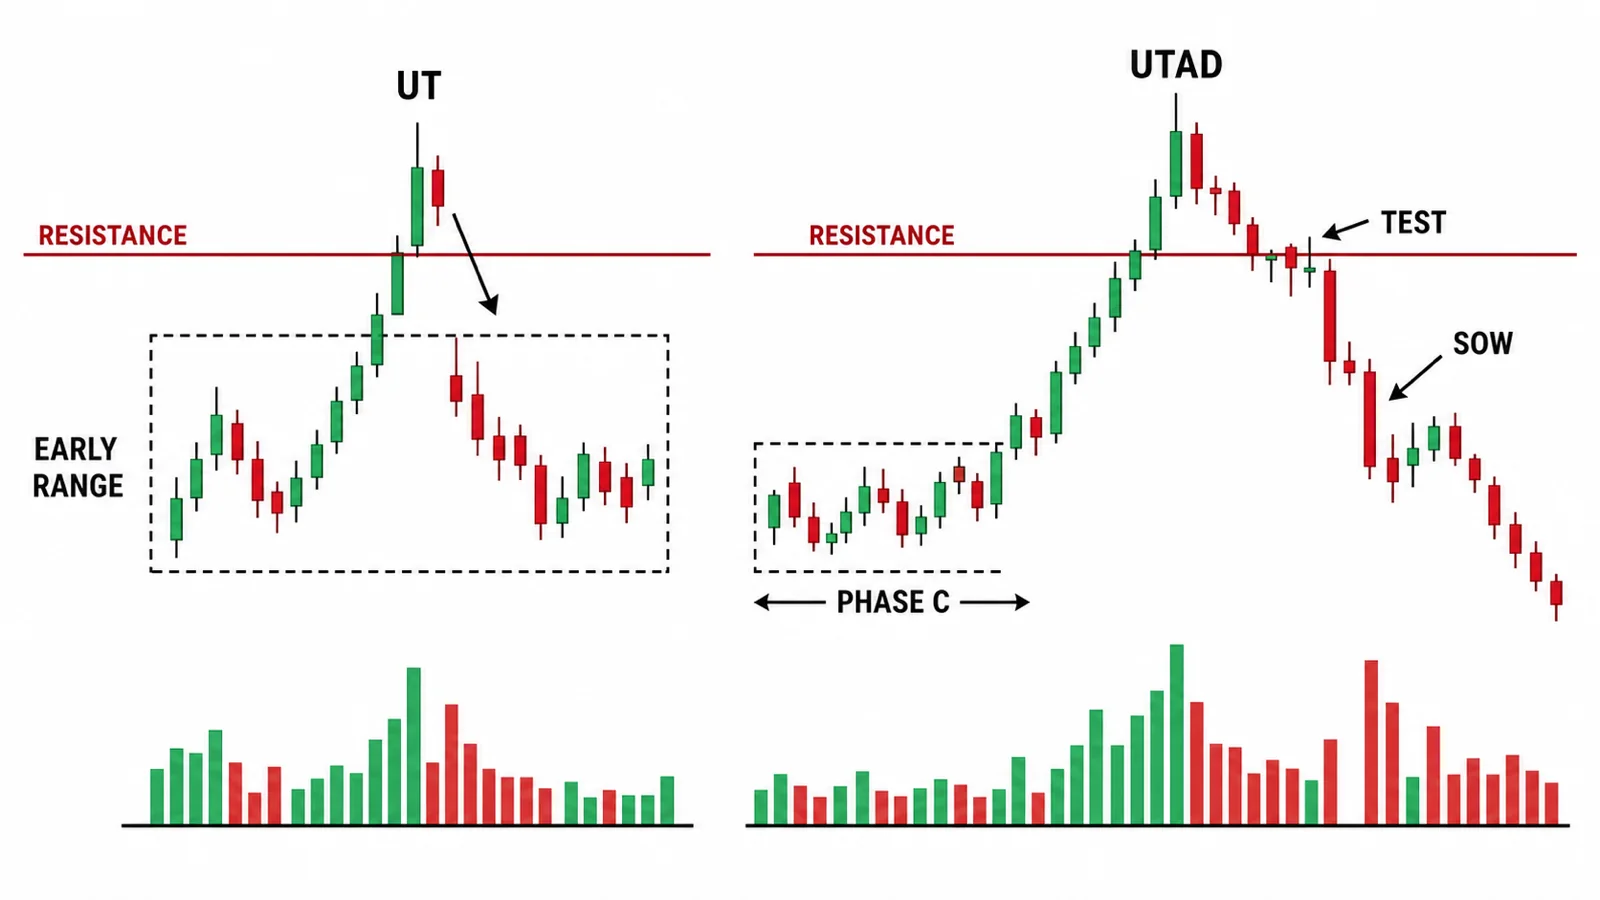
Upthrust versus UTAD
Upthrust is the broader term. It can occur during Phase B as the range tests its upper boundary and helps define resistance. UTAD is usually reserved for Phase C after a mature distribution has developed. A UTAD may be the final test before weakness, but that interpretation requires subsequent evidence. Labeling every Phase B excursion as UTAD creates a bearish bias too early.
| Feature | Upthrust | UTAD |
|---|---|---|
| Typical phase | Often Phase B | Usually Phase C |
| Primary role | Tests or defines resistance | Late test of demand |
| Required next evidence | Return to range | Test, SOW and weak rally |
| Bearish implication | Context dependent | Stronger if confirmed |
| Common error | Shorting every upper wick | Calling distribution complete early |
The UTAD–Test–SOW–LPSY sequence
1. UTAD above resistance
Price moves above the range high but fails to gain acceptance. It closes back within the range or quickly loses the breakout area. Several closes above resistance weaken the UTAD interpretation and increase the probability that the market is accepting higher value.
2. Test of demand
Price revisits the UTAD area or upper range but makes less upward progress. The Test may form a lower high, narrower spread or lower relative volume. It does not have to touch the UTAD extreme. The important observation is whether demand can again push and hold price above resistance.
3. Sign of Weakness
A Sign of Weakness is a decline that makes meaningful progress through the range, often breaking an internal support or the lower boundary. The move should hold long enough to distinguish it from another false breakdown. Immediate reclaim would weaken the bearish case.
4. Last Point of Supply
After weakness, a rally may fail below former support or in the lower half of the range. This Last Point of Supply can offer a more conservative planning location than the initial UTAD, although the stop distance and reward may be less attractive.
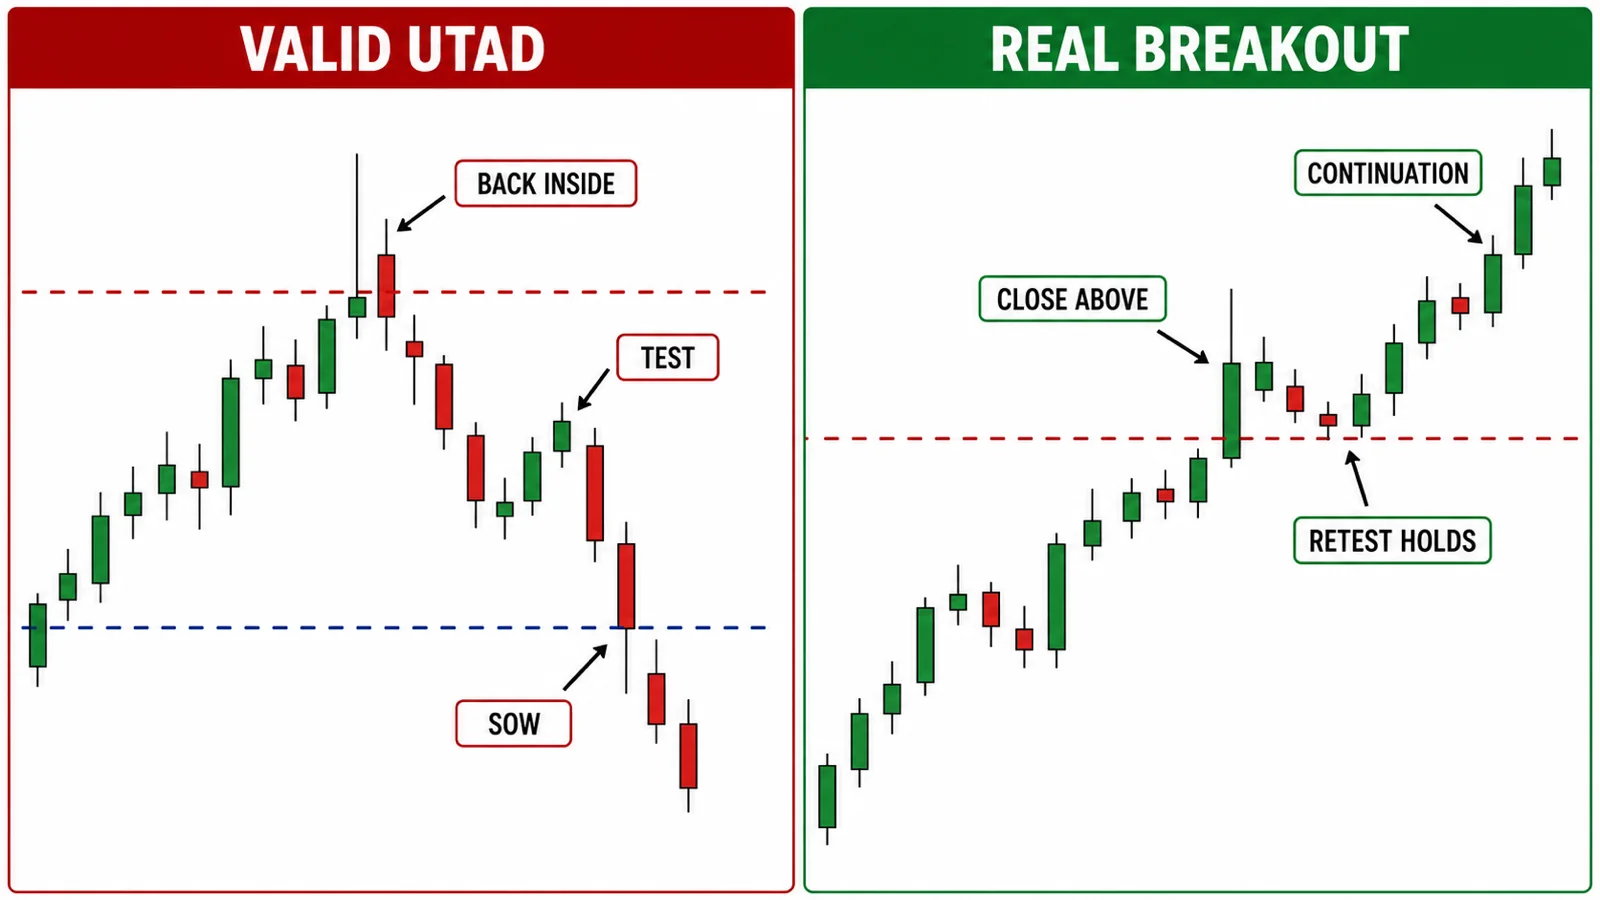
UTAD or true breakout?
| Observation | UTAD scenario | Breakout scenario |
|---|---|---|
| Close | Returns inside the range | Closes clearly above resistance |
| Retest | Cannot hold above the range | Old resistance acts as support |
| Structure | Lower high followed by weakness | Higher low followed by new high |
| Follow-through | Moves through range midpoint | Continues expanding upward |
| Invalidation | Acceptance above UTAD | Close back deep inside range |
At the exact moment price crosses resistance, the chart does not reveal whether the move is a UTAD or a successful breakout. Build two scenarios and let acceptance or rejection decide.
Reading volume responsibly
High volume above resistance with little upward result may be consistent with supply meeting demand. Reduced volume during a Test may be consistent with weaker demand. These are contextual observations, not proof that a named institution is selling. Futures volume is centralized by venue, while spot Forex tick volume is broker-specific. Explain which dataset you are using.
Three execution approaches
- Aggressive: act after price returns inside the range, accepting that SOW is not yet confirmed.
- Moderate: wait for a failed Test and a bearish local structure trigger.
- Conservative: wait for SOW and a weak rally or LPSY, accepting a later entry.
- For every approach, define acceptance above the UTAD or Test as an invalidation condition.
- Compare the stop distance with the next support before calculating position size.
Hypothetical example
Assume an equity index advances for several months and then forms a broad range. Price trades above the range high for two sessions but closes back inside. The next rally fails below the extreme, and price breaks an internal swing low with wider spread. A later bounce stalls near the midpoint. The sequence supports a UTAD–Test–SOW–LPSY hypothesis. If price instead closes above the UTAD and holds the level on retest, the distribution scenario is invalidated. This is not a live recommendation.
Distribution, redistribution or simple consolidation?
A range after an advance may be distribution, reaccumulation or a neutral consolidation. The label cannot be known from location alone. Distribution becomes more credible when rallies repeatedly fail, weakness makes progress and price cannot regain lost support. Reaccumulation becomes more credible when support holds, breakouts are accepted and pullbacks form higher lows.
Redistribution occurs within a broader downtrend and prepares another decline. Its Upthrust-like events may resemble UTAD, but the higher-timeframe context is different. Before assigning a schematic, mark the prior trend and determine whether the range is pausing an advance or an existing markdown.
Timeframe and market considerations
A UTAD on a five-minute chart may be a minor liquidity event inside a daily uptrend. Match the range timeframe to the trade horizon and avoid using a small bearish pattern to override a large bullish structure without evidence. Multi-timeframe analysis should clarify context rather than provide permission for a predetermined short.
Volume interpretation also changes by market. Exchange-traded products provide centralized venue volume, whereas spot Forex usually provides tick activity from one feed. In either case, compare volume with recent bars on the same instrument and timeframe instead of using an absolute threshold.
Common mistakes
- Shorting the first touch of resistance.
- Calling every upper wick an Upthrust or UTAD.
- Ignoring whether the event belongs to Phase B or Phase C.
- Using divergence as the only confirmation.
- Refusing to accept a breakout that holds above resistance.
- Keeping a short position after price invalidates the distribution structure.
Risk management
A suspected UTAD can become a genuine breakout. Define risk before entry and never widen invalidation to preserve a bearish narrative. If the distance above the UTAD is too large, wait for a Test or LPSY, reduce size, or skip the trade. A trader should also plan what happens near the range midpoint and support because price may remain rotational instead of entering a full markdown.
Document whether the entry occurred after rejection, after a failed Test or after SOW and LPSY. These are different setup variants and should not be combined into one performance number. Consistent screenshots and notes reveal whether confirmation improves results enough to justify the later entry.
A partial profit plan should also be defined before entry. The range midpoint can produce a reaction even when the larger distribution idea remains valid. Moving the stop or target during the trade solely because the Wyckoff label feels convincing replaces process with narrative.
When evidence remains mixed, standing aside is a complete and disciplined decision.
Compare the setup with the breakout versus fakeout guide and risk–reward framework before execution.
The opposite Phase C event is explained in the Wyckoff Spring and Test guide. Studying both sides of the range helps prevent a trader from treating every failed breakout as distribution.
Affiliate disclosure: Học Làm Trader may receive a commission if you open an account through the XM link below. This does not increase your cost and does not affect the educational analysis in this article.
Practice the workflow with an Exness demo account before considering real-money execution. A demo result does not predict future performance.
Frequently asked questions
Is every Upthrust a UTAD?
No. Upthrust is a broader failed-breakout event. UTAD normally refers to a Phase C test near the end of potential distribution.
Can distribution occur without a UTAD?
Yes. Wyckoff schematics are models, not mandatory templates. Some ranges move into weakness without a clear UTAD.
Should a trader short immediately after a UTAD wick?
Not automatically. Waiting for return to range, a failed Test or a Sign of Weakness reduces ambiguity, though confirmation may create a later entry.
Sources and further reading
- Wyckoff Analytics — The Wyckoff Method
- CME Group — Technical Analysis
- CFTC — Foreign Currency Trading Advisory
Risk warning: This material is for education and general information only. It is not investment advice, a trade signal, or an invitation to trade. Trading can result in loss of capital. Past performance does not guarantee future results. Test every idea, assess your risk tolerance, and remain responsible for your decisions.