


To identify market cycle phases, start with range context, structure and close-and-hold behaviour rather than trying to call a top or bottom. A phase label is only useful when it has a confirmation rule and an explicit invalidation point.
The difficult part is not memorising four labels. It is avoiding a new label after every candle. An H1 trader may see a short markdown while a D1 trader still sees a broad balance range. Use three layers instead: higher-timeframe context, behaviour at the range edge and follow-through once price leaves the range.
Start with the range and a context timeframe
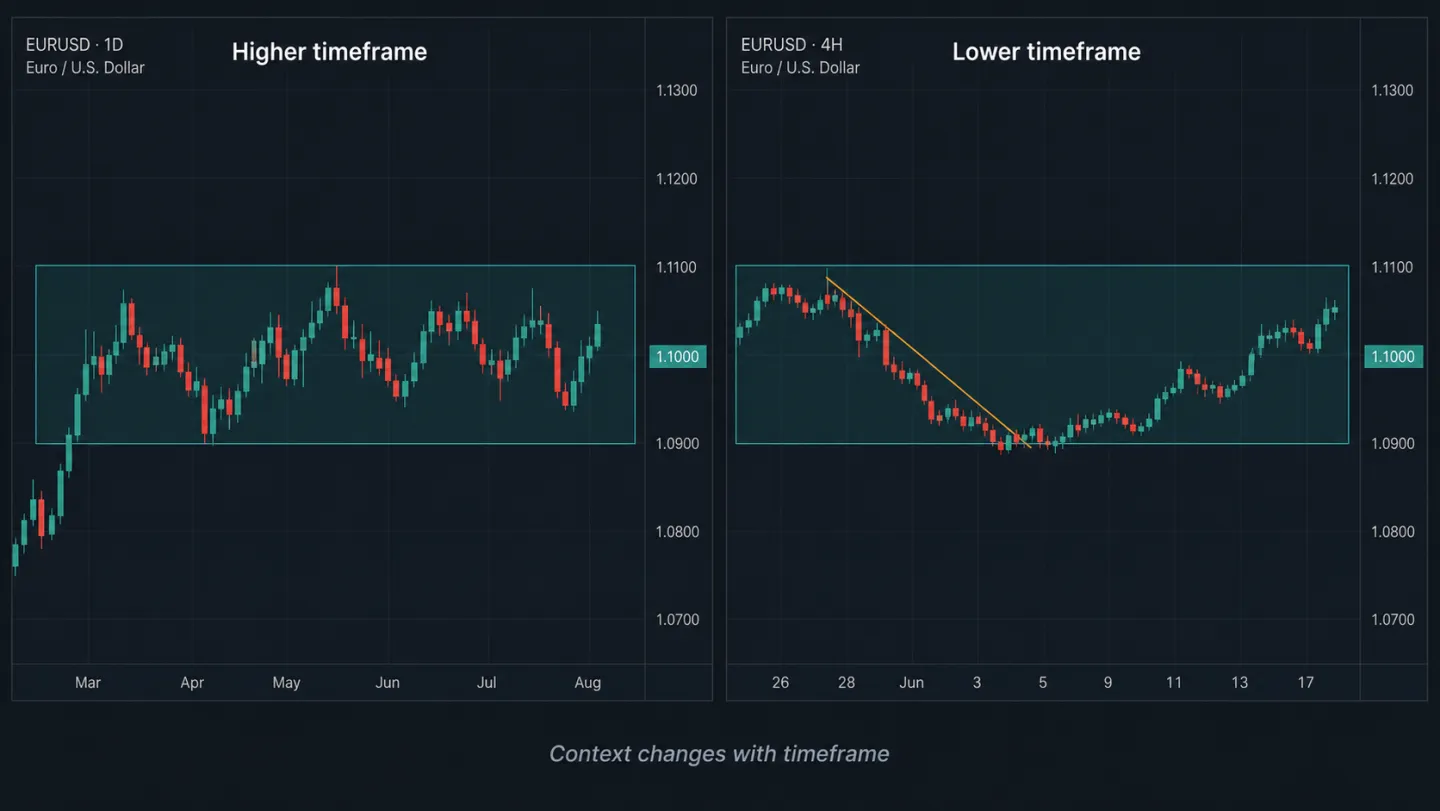
Choose a context timeframe before looking for a phase. For swing trading, D1 or H4 is often more useful than M5; for intraday work, H1/H4 may provide context while M15/M5 supplies execution detail. The aim is not to find a magic timeframe but to apply a repeatable rule.
Mark the upper and lower edges of a range after meaningful reactions on both sides. Then record what happened before the range: an advance, decline or previous balance area. The same rectangle can be a pause in trend, balance after a decline or news-driven volatility. Shape alone does not decide the label.
For an illustrative EURUSD D1 range between 1.0900 and 1.1100, H4 may make lower highs for several days while D1 continues to close inside the range. A cautious conclusion is “D1 range with short-term downside pressure,” not a D1 markdown. Pair the method with market structure and multi-timeframe analysis.
Test close-and-hold before declaring a phase transition
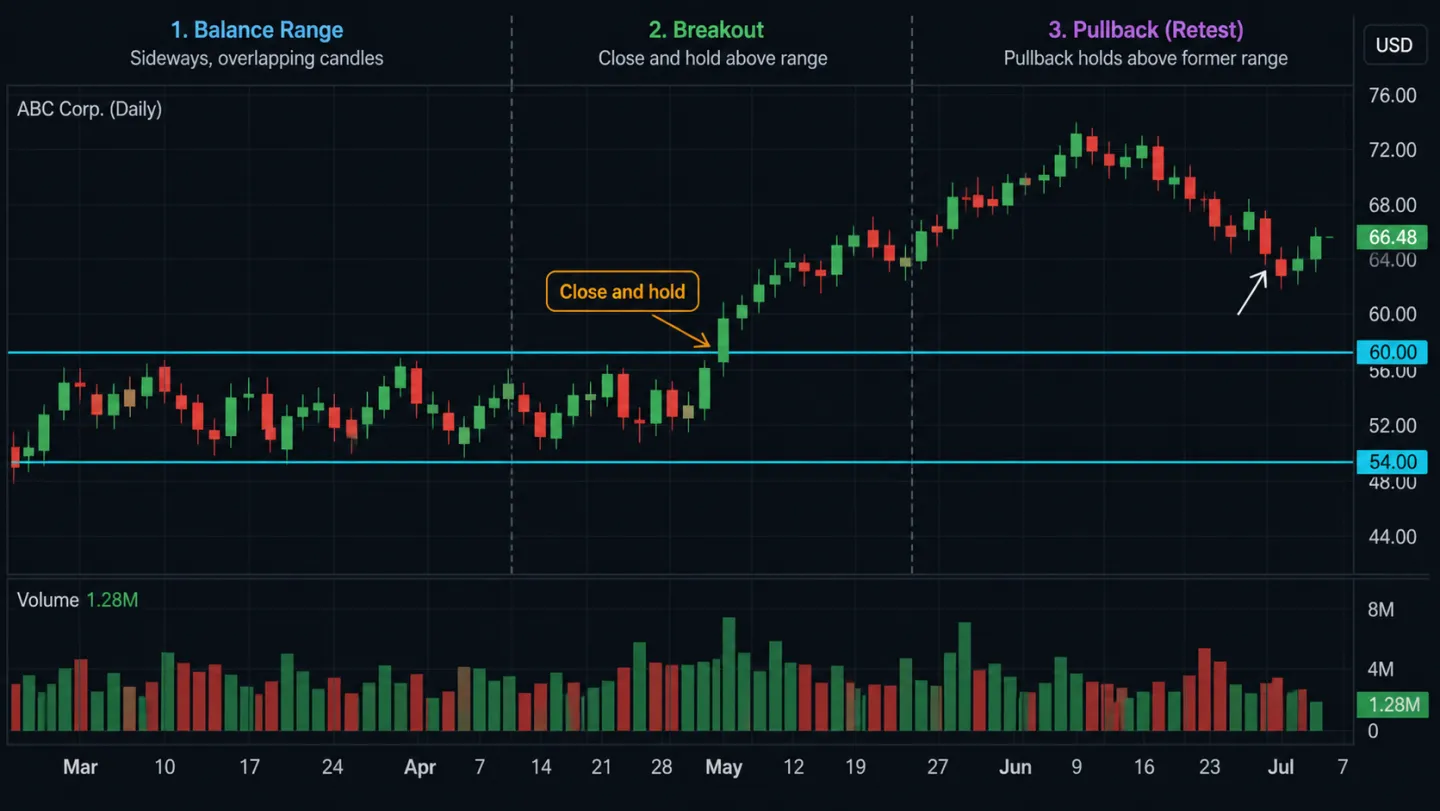
A wick through a boundary is not the same as acceptance. Write the rule in advance: for example, one H4 close outside the range plus a second close that does not return to its middle; or one D1 close followed by a retest that holds the boundary. The rule may differ by market, but it should not change after the outcome is known.
Close-and-hold does not guarantee continuation. It simply updates the scenario and defines the evidence that weakens the old one. If price breaks higher, closes outside and quickly closes back into the range, the markup scenario is weakened. Return to the range hypothesis and wait for new information rather than defending the old label.
This fits naturally with a breakout versus fakeout workflow. A breakout is an event; a phase is the wider context updated by a sequence of events.
Spot lost follow-through and opposite-side acceptance
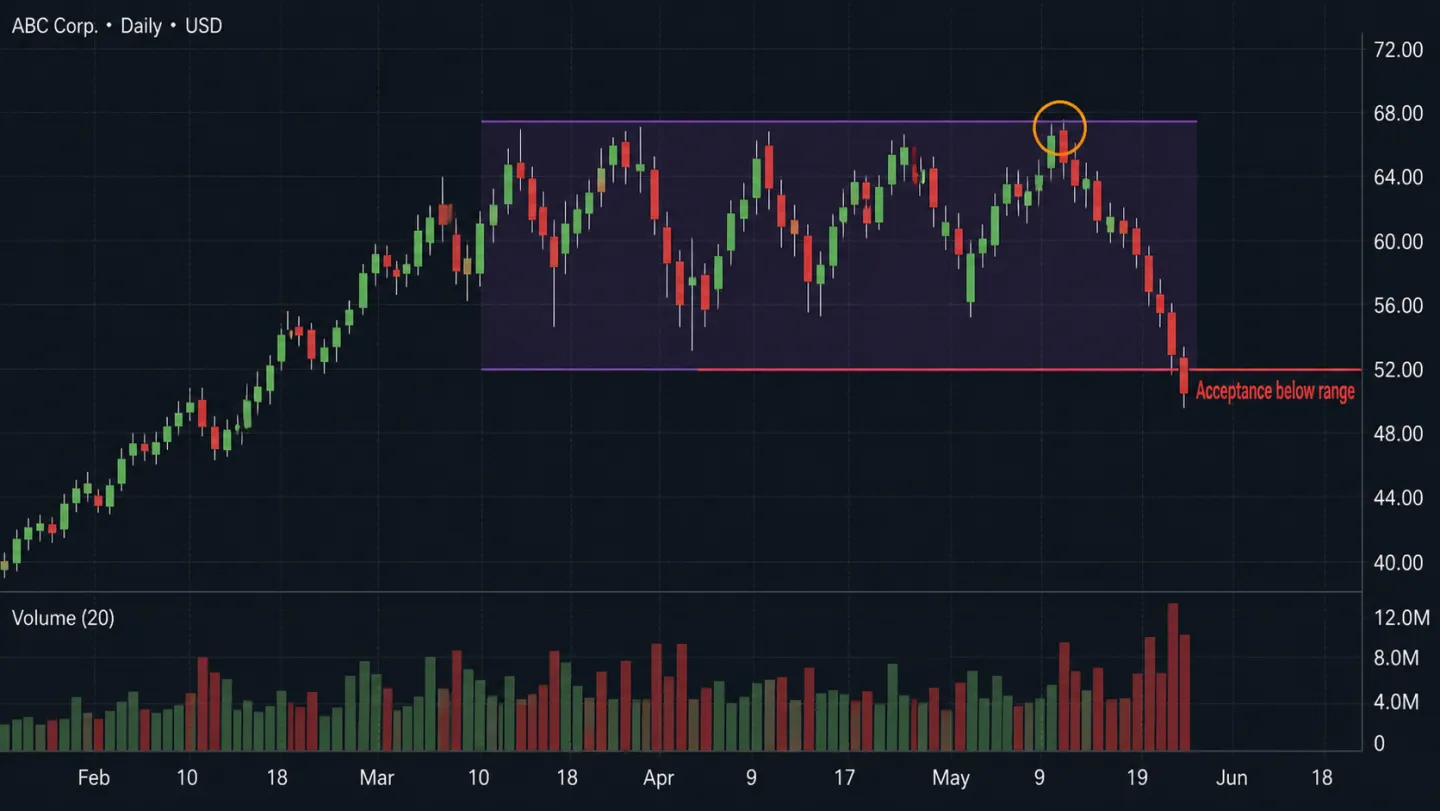
The move from markup to range or markdown is often recognised through a combination: advances lose follow-through, fresh highs are quickly rejected, volatility expands and price begins to accept below the balance range. There is no need to catch the top. The operational question is whether price still holds the area it previously broke.
In the illustration, one lower high inside the range is insufficient. If price then closes below support and a pullback cannot recover it, a bearish scenario becomes more relevant. Stop distance, target selection and size still depend on invalidation and risk limits, not on the phase name.
A review note for every chart
- Context timeframe and observation date.
- The range or swing boundary being used.
- The move into the range: up, down or neutral.
- The close-and-hold, retest or acceptance rule.
- The event that would invalidate the current label.
- The volume/data source and its limits, especially for spot-Forex tick volume.
Consistent notes make it possible to review a sample of charts instead of preserving only attractive examples. They also separate a context framework from a promise of results.
Risk disclosure: This educational content is not investment advice or a trade signal. Charts are illustrative; markets involve a risk of loss.
Sources and limits
- CMT Association — general technical-analysis education.
- Investor.gov — public financial-literacy and investment-risk education.
- The charts in this article are educational illustrations, not backtest data or evidence that a setup will work.