


Pivot Points trading uses a prior period’s high, low and close to calculate projected reference levels for the next period. Classic pivots can organize intraday support and resistance, but a level is not a guaranteed reversal. The formula, session template, instrument and data feed must be documented before interpreting a reaction.
Classic Pivot Point formula and levels
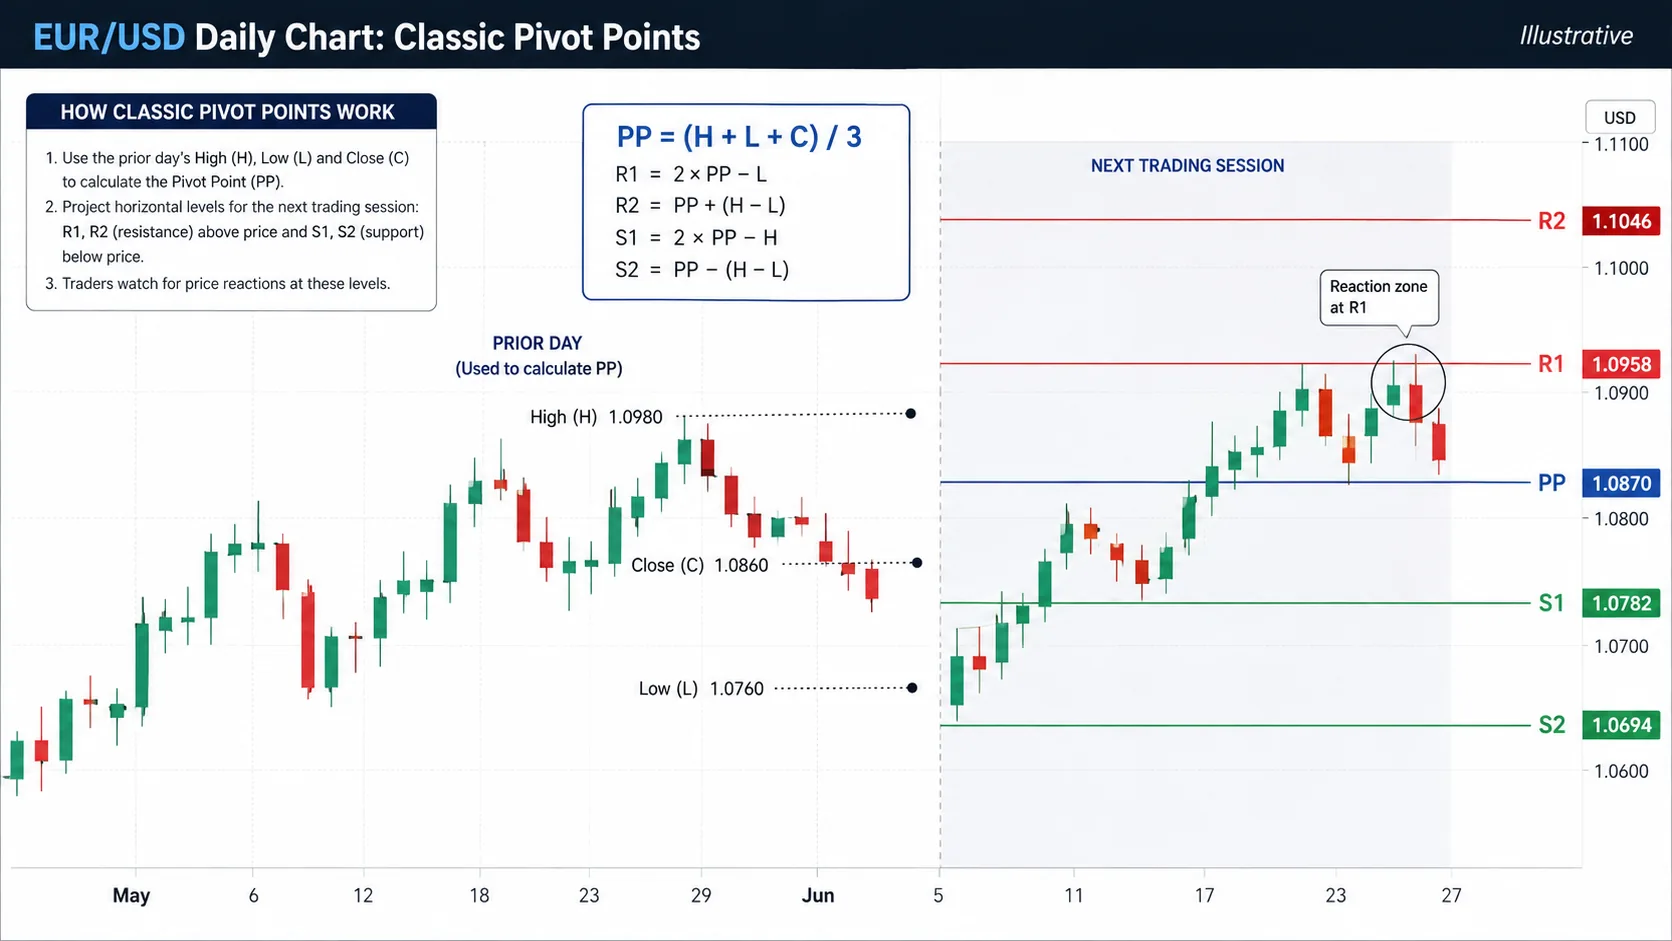
The classic central pivot is PP = (H + L + C) / 3, where H, L and C are the prior period’s high, low and close. Common projections are R1 = 2 × PP − L, S1 = 2 × PP − H, R2 = PP + (H − L), and S2 = PP − (H − L). These levels are calculations, not physical barriers.
Define the period: daily pivots on a futures session, a broker’s forex day or a custom timezone can differ. The site’s technical-indicators guide helps keep formula settings explicit. A reaction at R1 or S1 still needs price context and an invalidation point.
Classic versus Fibonacci pivots
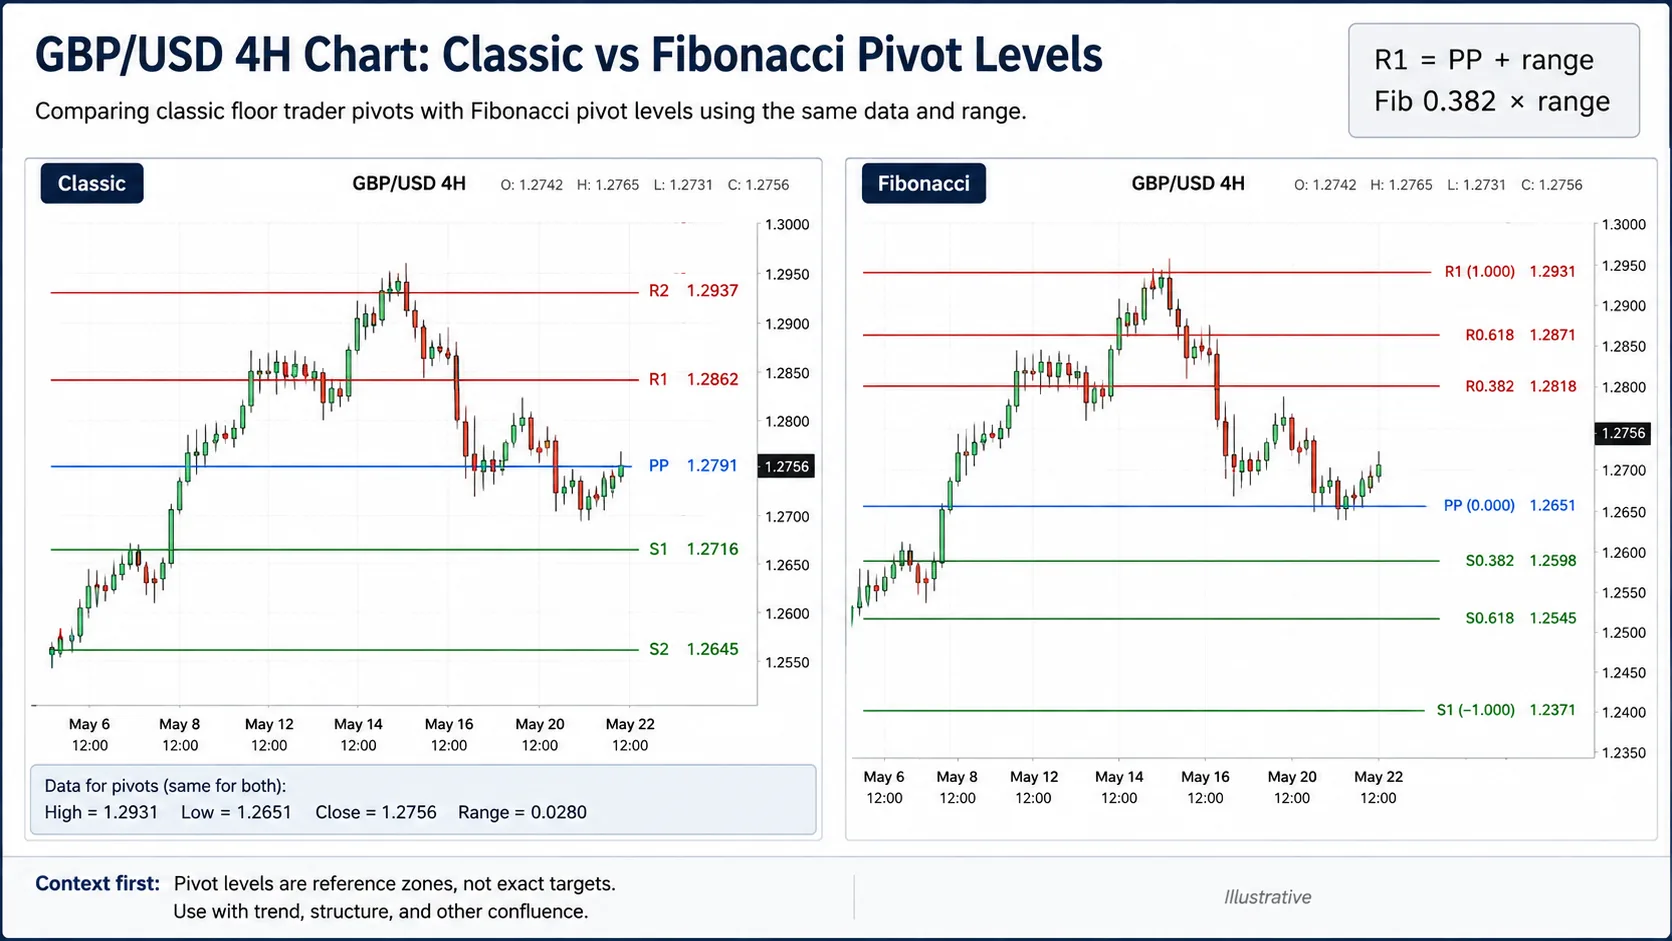
Fibonacci pivot variants apply chosen Fibonacci ratios to the prior range around PP. A common example is R1 = PP + 0.382 × (H − L), although platforms and authors may use different ratios and level names. State the exact formula; never assume two “Fibonacci pivot” indicators are identical.
| Choice | What changes | Risk |
|---|---|---|
| Classic pivot | Fixed arithmetic projections | False precision around a level |
| Fibonacci pivot | Ratio-based range projections | Different ratios across platforms |
| Session template | Input H, L and C | Levels shift when the day changes |
Use pivots as a map of reference points. Combining them with market structure can clarify whether a level is aligned with a swing or simply in the middle of noise.
Reactions, failure and risk management
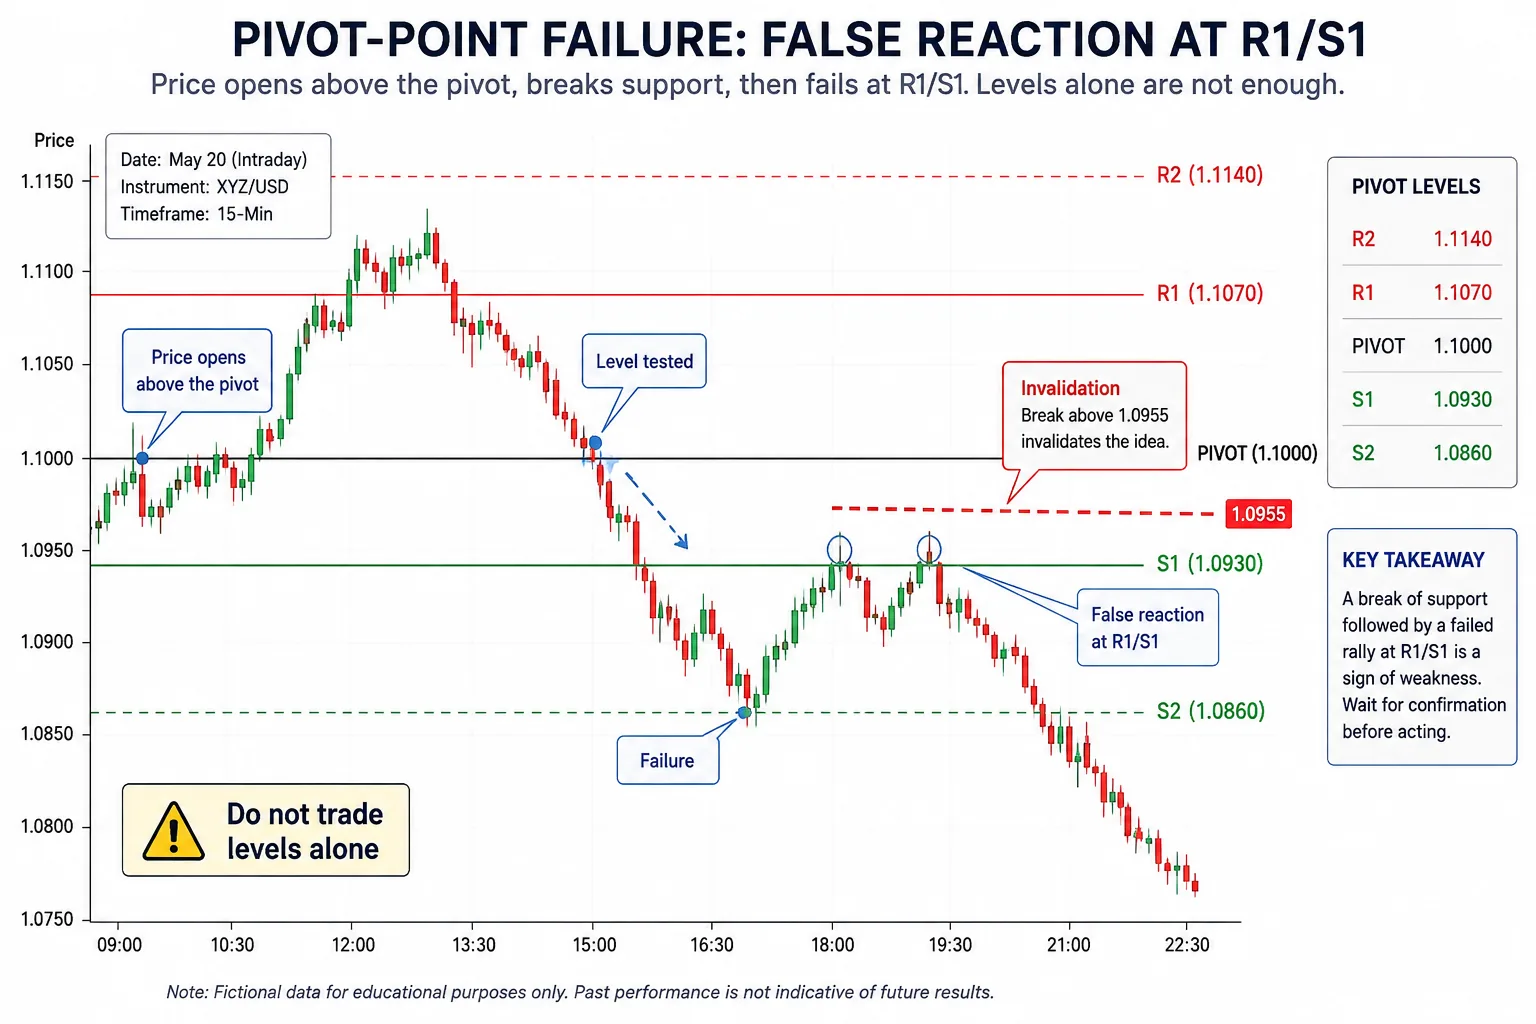
A level test is not confirmation. Price can pause at R1, pass through it, return below it or ignore it completely. In the illustrative failure, a reaction does not hold and the original level thesis is invalidated by a close through support.
- Freeze formula, timeframe and session before testing.
- Mark nearby structure and event risk.
- Define the close or rejection trigger.
- Place invalidation beyond the scenario, not exactly on a line.
- Size from risk after spread and slippage.
Avoid using every pivot level as a separate trade idea; correlated levels can multiply exposure. Test classic and Fibonacci variants as distinct models with dated examples and no unsupported win-rate claims.
Pivot levels are recalculated when the input period changes. A daily pivot based on a broker’s midnight differs from one based on a futures regular-trading-hours session, even when both are labelled “daily.” Record the timezone, session close and whether the chart uses bid, ask or last-traded data. Without those details, another analyst cannot reproduce the levels.
Before testing a reaction, define what counts as acceptance: for example, two closes beyond the level, a retest that holds, or a structure break. Treat a single touch as an observation. Compare classic and Fibonacci variants on separate samples and include days when price ignores every level.
Further reading: Compare pivot references with the Volume Profile guide and the trading glossary.
Risk disclosure: This article is educational information, not investment advice or a solicitation to trade. Price-action patterns and indicator readings can fail, illustrative charts do not predict future results, and leveraged trading can result in loss of capital. Define risk and verify your data before acting.