


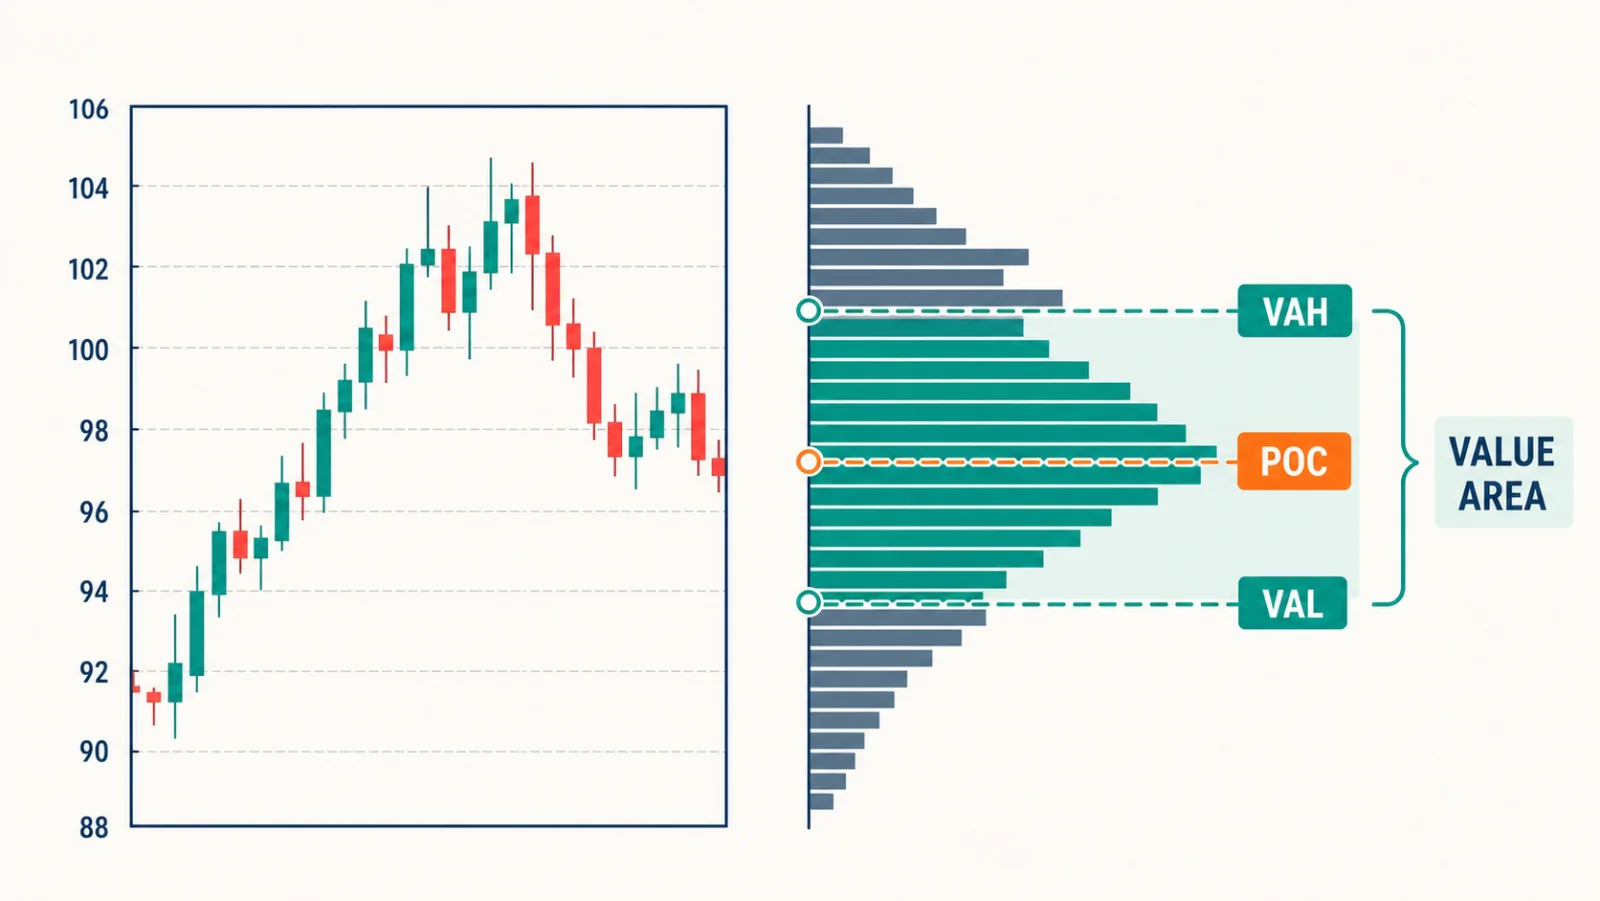
Volume Profile displays how much trading activity occurred at different price levels during a selected period. The Point of Control (POC) is the price row with the most volume. Value Area High (VAH) and Value Area Low (VAL) bound the range containing a chosen share of profile volume—commonly 70%, although the setting can vary. These levels describe where activity occurred; they do not guarantee future support or resistance. Traders use them to study acceptance near high-volume areas, quicker travel through low-volume areas, and whether price holds outside or returns inside value.
Key takeaways
- Volume Profile organizes volume by price, not by time.
- POC is the highest-volume price row for the selected profile.
- VAH and VAL depend on the chosen value-area percentage and profile range.
- A level is context, not an automatic entry.
- Feed, row-size, session, and profile-range choices can change the result.
What Volume Profile measures
A conventional volume histogram below a chart answers when volume occurred. Volume Profile rotates that question: it estimates how activity was distributed across price rows within a fixed range, visible range, session, or recurring period. That makes the tool useful for studying where the market spent effort, but it remains backward-looking.
Begin with the broader technical-indicators framework. Volume Profile should add information that price structure alone does not show. It should not cover a chart with levels that all receive equal importance.
The quality of the output depends on input data. Exchange-traded instruments may provide centralized volume, while spot forex commonly uses broker-specific tick volume rather than one consolidated market total. Two feeds can therefore produce different profiles without either chart being visually broken.
POC, VAH, VAL and the value area
POC is the row with the largest calculated volume. The value area starts around that row and expands into neighboring rows until it contains the configured percentage of volume. The highest included row becomes VAH; the lowest becomes VAL. A 70% setting is common, but it is a convention rather than a law.
POC is sometimes described as a location of acceptance because the selected range recorded substantial activity there. VAH and VAL are boundaries of the calculated value area, not invisible walls. Price can cross them repeatedly, especially when the profile spans an unsuitable range or the market is balanced.
TradingView notes that row size, lower-timeframe data availability, and non-standard charts affect calculation. Avoid building the profile on Heikin Ashi, Renko, or similar synthetic displays when you need actual price-and-volume relationships.
Acceptance, rejection and low-volume travel
Acceptance is not one candle touching a level. A practical definition might require several closes, time spent, and two-way trade around the area. Rejection describes price testing an area and moving away with a close and structure change. Write those definitions before reviewing examples.
High-volume nodes show concentrations of prior activity; low-volume nodes show relatively less. Traders often watch whether price rotates around a high-volume node or moves more quickly through a low-volume pocket. That is a hypothesis to test, not a promise that price will behave the same way on the next visit.
Combine the profile with market structure and multi-timeframe analysis. A session VAL inside a higher-timeframe downtrend has different meaning from the same label at weekly support.
A step-by-step reading workflow
- Choose one profile type and define its range before inspecting the outcome.
- Confirm the session template, timezone, data feed, row size, and value-area percentage.
- Mark POC, VAH, VAL, high-volume nodes, and only the clearest low-volume pockets.
- Read the higher-timeframe structure and nearby support or resistance.
- Classify current price as inside value, outside value, or testing a boundary.
- Define observable acceptance, rejection, or close-and-hold criteria.
- Write invalidation and the next obstacle before considering execution.
- Record the full settings with the screenshot.
What the main Volume Profile labels mean
| Label | Calculation | Useful question | Common error |
|---|---|---|---|
| POC | Highest-volume row | Is price rotating around prior activity? | Treating it as guaranteed support |
| VAH | Upper value-area boundary | Does price hold above or return inside? | Shorting every touch |
| VAL | Lower value-area boundary | Does price hold below or reclaim value? | Buying every touch |
| HVN | Relative concentration | Is price balancing? | Assuming direction |
| LVN | Relative low activity | Does price move quickly through? | Calling it empty liquidity |
Every label is conditional on the selected profile and settings.
Worked chart example
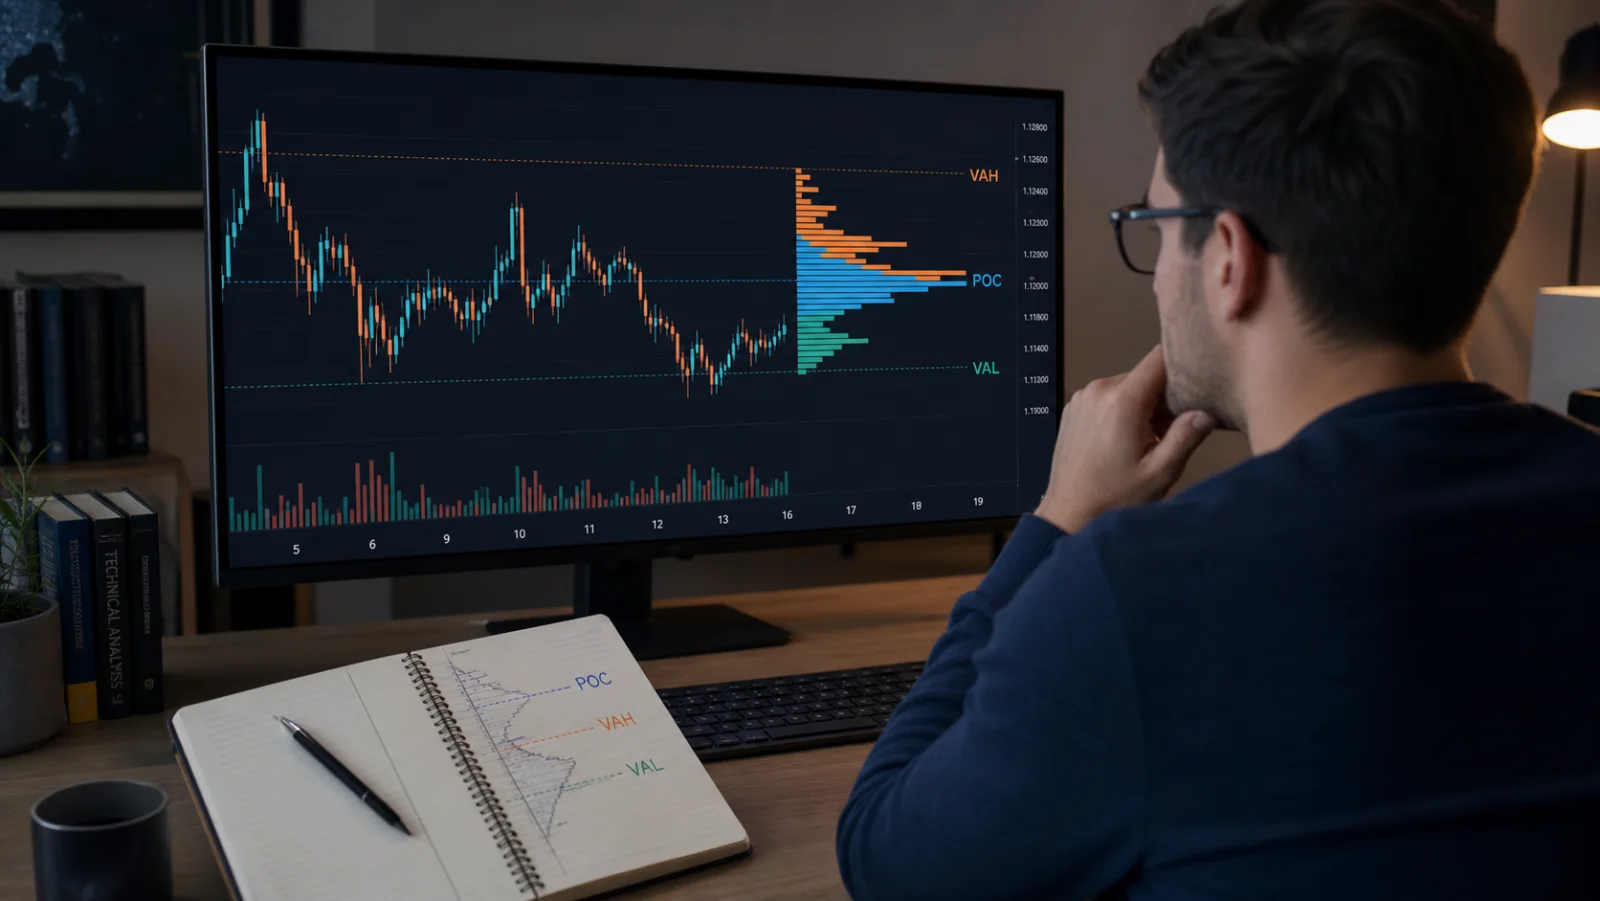
Assume an H1 session profile places POC near 1.1200, VAH at 1.1260, and VAL at 1.1130. Price opens below VAL, closes back inside value, and then holds above VAL on a retest. The observation is a reclaim of the prior value boundary—not a guaranteed long signal.
A testable plan waits for the reclaim to remain valid and for lower-timeframe structure to turn upward. Invalidation sits below the structure that confirmed the reclaim, not at an arbitrary number of pips. POC is the next area to monitor, but price is not required to reach it.
If price instead closes back below VAL and holds, the reclaim thesis fails. The trader records a failed scenario rather than moving VAL or redrawing the profile to preserve the original view.
Profile selection changes the story
A visible-range profile changes when the chart is zoomed. A fixed-range profile depends on two manually chosen endpoints. A session profile resets each session, while a periodic profile follows the selected day, week, or month. If the range is selected after seeing the outcome, the level becomes fitted to history.
Keep separate statistics for separate profile types. Do not compare a weekly fixed profile with a session profile as if the levels came from one method. Record row size, value-area percentage, session template, feed, and timezone so another reviewer can reproduce the chart.
For support and resistance context, compare Volume Profile with the existing guide on SNR zones and volume. Price location and zone state should remain visible even when the histogram looks compelling.
Common mistakes
- Changing the visible range until the levels fit the move.
- Using centralized-volume language for broker-specific spot-forex data.
- Calling every POC support or resistance.
- Ignoring row size, session, timezone, or feed differences.
- Using profiles on synthetic chart types without understanding distortion.
- Entering because price touched VAH or VAL without a trigger.
The most serious error is treating a descriptive distribution as a forecast. Define what price must do at the level.
Risk management and invalidation
Volume Profile does not provide a natural stop by itself. Invalidation should come from the structure and scenario being traded: a failed reclaim, a close back inside value, or a break of the confirming swing. The profile level identifies the area of interest; price action defines whether the thesis remains valid.
An indicator condition does not determine position size. Define the chart condition that invalidates the setup, measure the actual distance to that point, and only then calculate exposure. The position-sizing formula and the limits of the risk–reward ratio should be applied after the technical thesis is clear. If the coherent invalidation point creates more risk than the plan allows, reduce size or skip the trade.
Spread, slippage, gaps, data-feed differences, and fast conditions can change execution. The CFTC warns that leverage amplifies both gains and losses and that OTC forex customers trade through a dealer-controlled platform rather than a live exchange. A correct chart observation can still lead to a loss, poor fill, or missed trade.
Pre-trade checklist
- The profile range was chosen before the outcome.
- Feed and session limitations are recorded.
- The current price location relative to value is clear.
- Acceptance or rejection has an observable definition.
- Structure confirms the scenario.
- Invalidation and the next obstacle are written.
How to backtest without hindsight
Freeze the profile range and parameters before advancing the chart. Test one scenario—such as VAL reclaim or VAH rejection—rather than mixing every profile interaction.
- Choose one instrument and consistent session.
- Save the profile before the test begins.
- Advance one candle at a time.
- Record hold, rejection, failure, and no-trade outcomes.
- Compare results across feeds only as separate datasets.
- Validate on unseen periods.
Save a screenshot before the signal and another after the scenario is complete. Record the instrument, timeframe, settings, market state, trigger, invalidation, maximum adverse excursion, maximum favorable excursion, spread, slippage, and whether the order could realistically have been filled. Keep failed and ambiguous cases. Removing them creates survivorship bias.
Score process separately from outcome. A profitable trade taken outside the rules is poor process, while a losing trade that followed a tested plan can still be a valid sample. Use the same definitions for at least 30–50 examples before changing a rule. When parameters change, date the revision and start a separate data group.
When not to use this tool
Stand aside when the chosen profile changes dramatically with minor zoom adjustments, the feed lacks meaningful volume for the intended comparison, or price is rotating around POC without a directional trigger. More levels do not solve an unclear market state.
Avoid using Volume Profile to justify a trade that contradicts a written price-action plan. If the structure, level, and trigger disagree, the correct output can be no trade.
Frequently asked questions
Is POC always support or resistance?
No. POC identifies the highest-volume row in the selected profile. Price may rotate through it repeatedly.
Why do two platforms show different profiles?
Data feed, session template, lower-timeframe history, row size, and calculation rules can differ.
Is the value area always 70%?
Seventy percent is common, but it is a configurable convention.
Can Volume Profile be used in spot forex?
It can be studied with broker tick-volume data, but it should not be described as consolidated global forex volume.
Conclusion
Volume Profile is most useful when its range and settings are fixed before analysis. Read POC, VAH and VAL as historical activity references, then require price structure and an explicit trigger before acting.
Sources and limitations
- TradingView — Volume profile indicators: basic concepts, accessed August 2, 2026.
- TradingView — Periodic Volume Profile, accessed August 2, 2026.
- CME Group — Technical Analysis, accessed August 2, 2026.
- CFTC — Eight Things You Should Know Before Trading Forex, accessed August 2, 2026.
Volume Profile implementations can differ. Platform documentation explains one implementation and does not prove that any profile scenario has predictive value.
Affiliate disclosure: If you need a practice environment, you may review an Exness demo account. This is a sponsored affiliate link, and Học Làm Trader may receive a commission if you register. The link is not a recommendation to open an account. Check costs, product terms, legal availability in your jurisdiction, and suitability before using any service.
Risk warning: This article is for education and general information only. It is not investment advice, a trade signal, or an invitation to trade. Indicators summarize historical price or volume data and can produce late, conflicting, or false signals. Leveraged trading can cause rapid losses, and past performance does not guarantee future results. Test every rule independently, include realistic costs, assess your ability to bear loss, and take responsibility for your decisions.
To separate volume at price, time at price and order-flow measures, compare Market Profile vs Volume Profile: Time at Price vs Volume at Price; Market Profile Explained: TPO, Initial Balance, Value Area and Auction Context; Footprint Chart Trading: Bid–Ask Volume, Imbalance, Delta and Data Limits; Cumulative Volume Delta: Calculation, Divergence and Failure Cases.