


The Williams Alligator overlays three smoothed moving averages—Jaw, Teeth and Lips—to describe whether price is moving in a coordinated trend or overlapping in a range. The lines are delayed and parameter-dependent; they do not guarantee a trend or an entry.
What Is the Alligator Indicator?
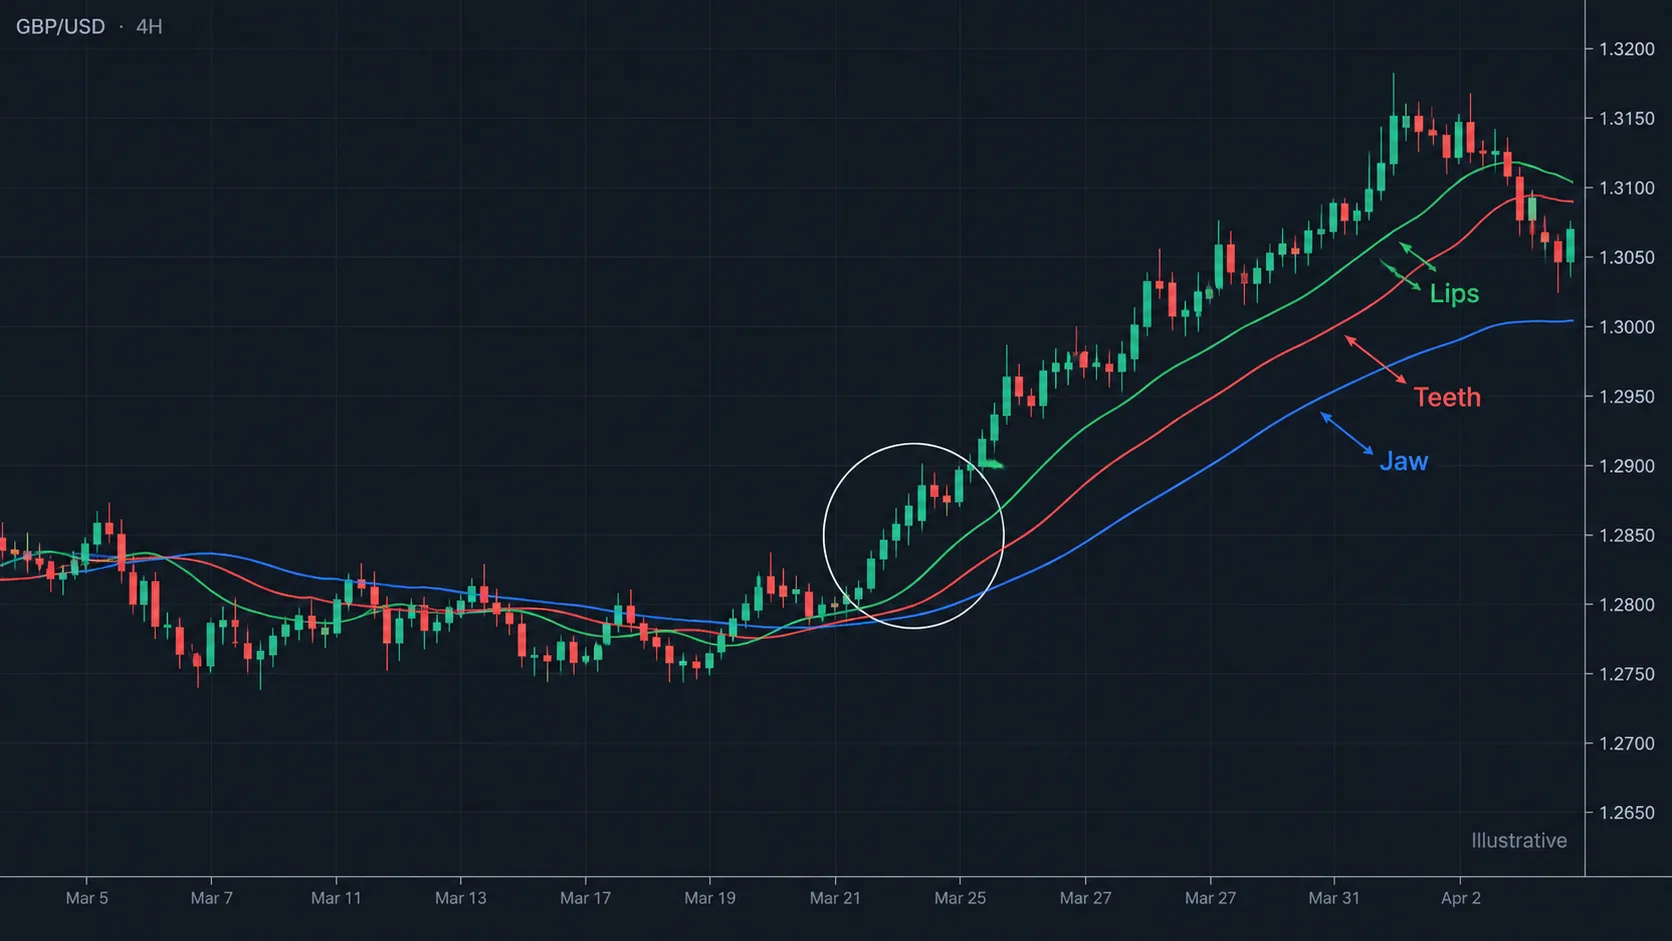
The three lines are commonly interpreted as a slow Jaw, a medium Teeth and a fast Lips. When they overlap, the market is often described as “sleeping”; when they separate, the display suggests expanding directional movement. These are descriptive labels, not proof of accumulation, intent or future price.
Frame line alignment with market structure and candlestick context. A line arrangement is more informative when the underlying swings and closes support the same hypothesis.
Parameters, Shifts and Data
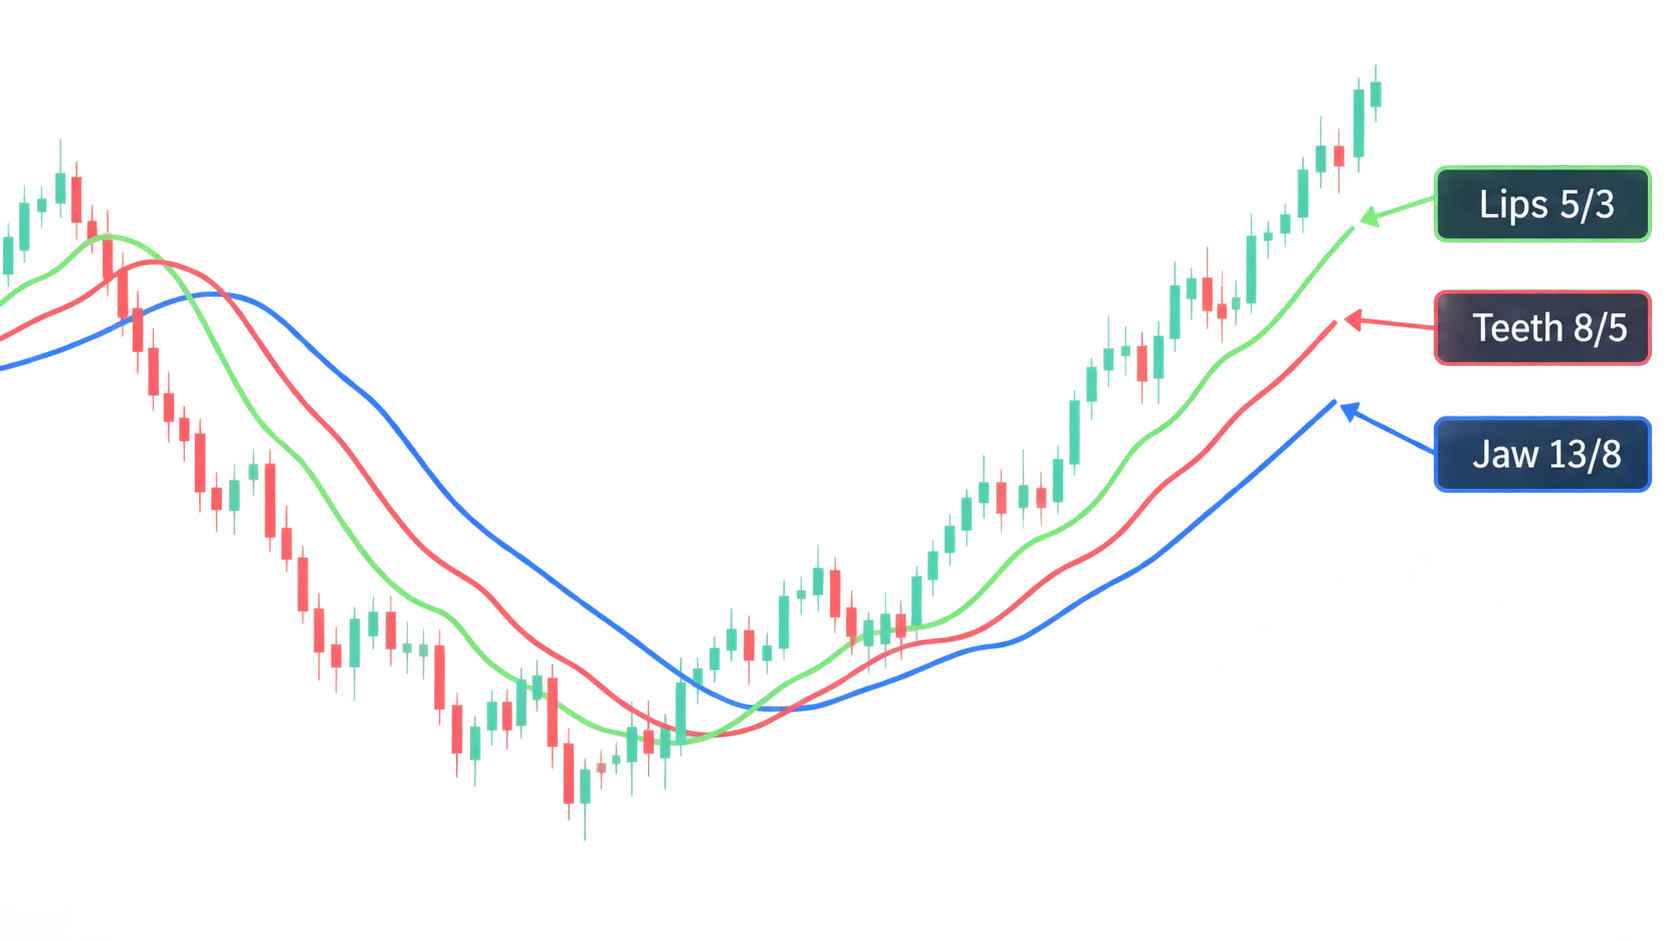
A common configuration uses Jaw 13 shifted 8 bars forward, Teeth 8 shifted 5 bars, and Lips 5 shifted 3 bars. Implementations can differ in smoothing method, shift direction, applied price and handling of incomplete bars. Write every setting before comparing results; otherwise two “Alligator” charts may not represent the same calculation.
| Observation | May describe | Does not prove |
|---|---|---|
| Lines intertwined | Moving averages are close together | A breakout is imminent |
| Lips above Teeth above Jaw | Recent price is stronger than slower averages | A trend will continue |
| Lines spread apart | Directional movement expanded | A safe entry |
| Lines recross | Alignment changed | A confirmed reversal |
Illustrative Failure: False Separation
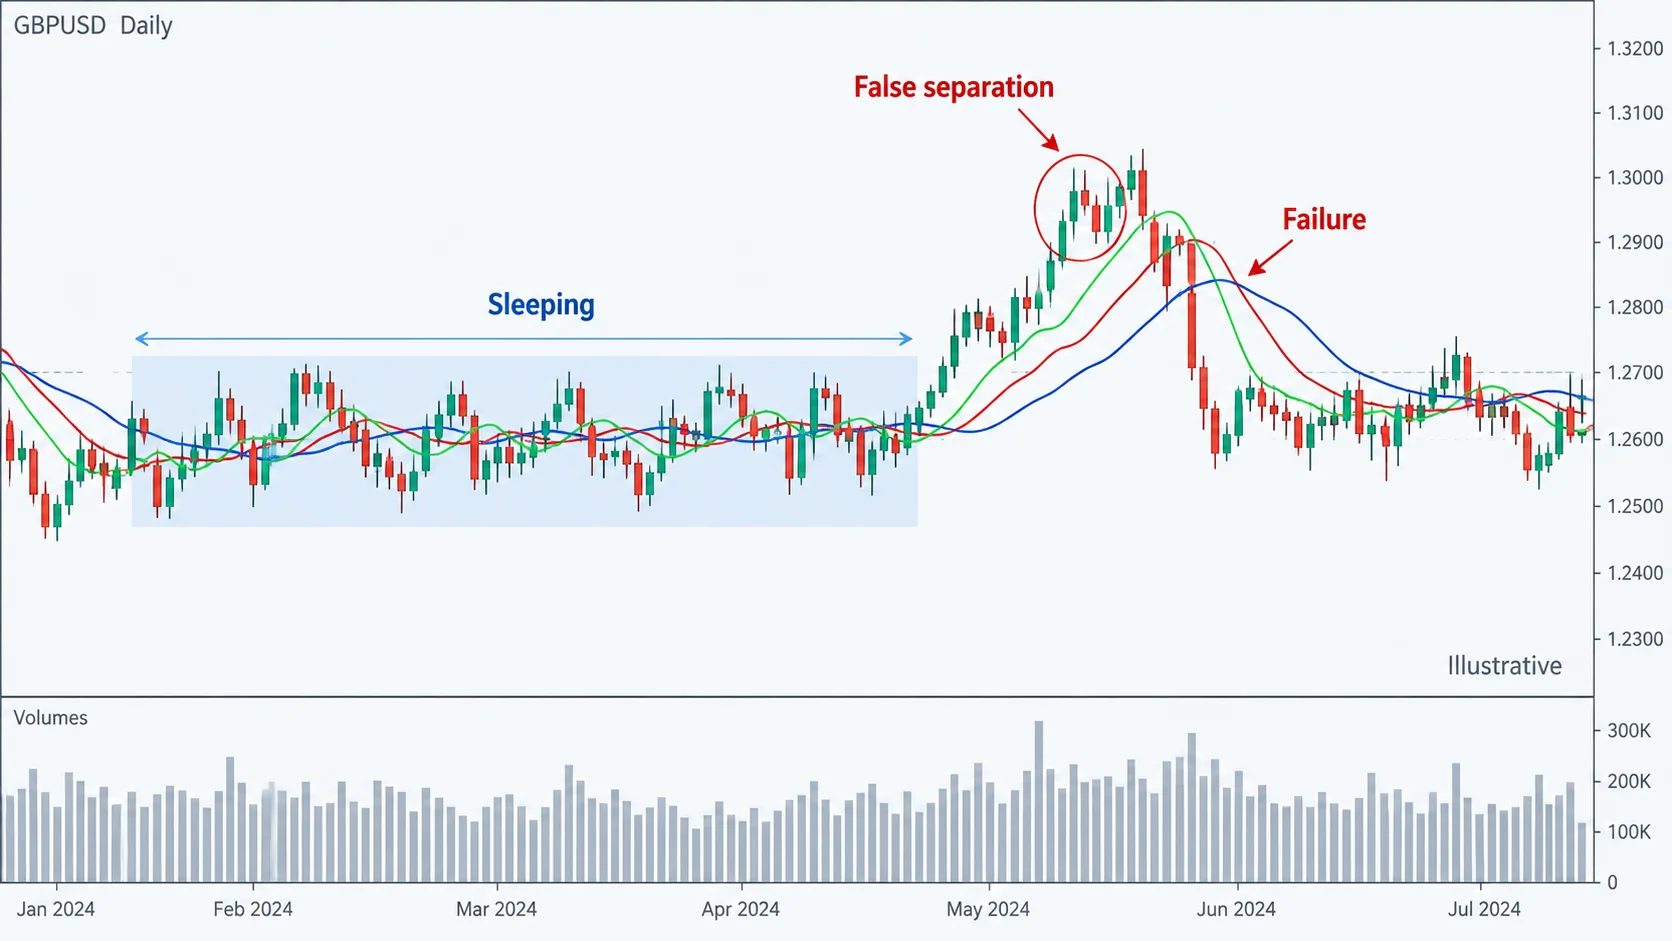
Imagine a fictional GBPUSD daily range in which the Lips move above Teeth and Jaw for several bars, then price returns to the middle and the lines tangle again. The separation described a temporary change in the moving-average relationship. It did not establish acceptance outside resistance or a fixed target. News and thin liquidity can create the same visual pattern.
Failure cases
- reading forward-shifted lines as if they were real-time forecasts;
- changing periods after observing a favourable segment;
- treating “sleeping” and “awakening” labels as universal states;
- ignoring the underlying candles, spread and timeframe;
- using the overlay without a written invalidation condition.
A Repeatable Workflow and Limits
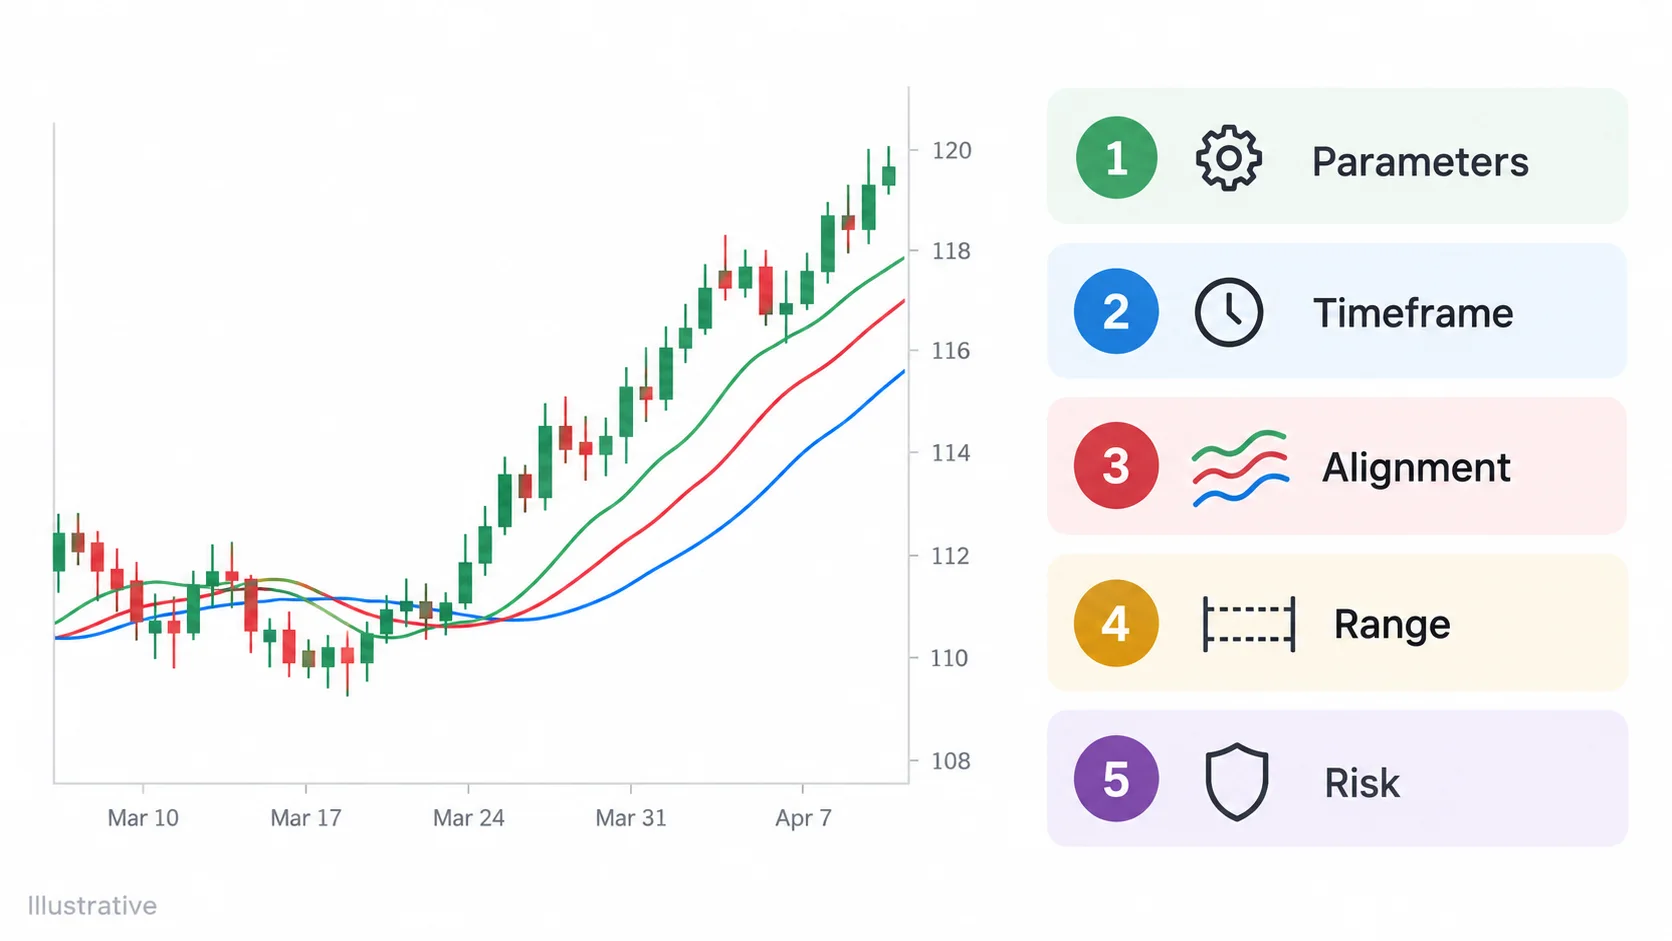
- record smoothing, periods, shifts, applied price and feed;
- start with higher-timeframe structure and mark nearby levels;
- classify overlap versus separation without assuming an outcome;
- check closes and follow-through rather than a single line cross;
- define risk with position sizing and risk–reward planning;
- log range failures and late signals in the same sample.
Limits
- moving averages lag by construction;
- forward shifts can confuse visual timing;
- parameters are not universal;
- the overlay contains no centralized volume or order-flow data;
- no line alignment substitutes for risk management.
Key takeaways
- Alligator uses three smoothed, shifted averages;
- overlap and separation are context descriptions;
- settings and shift conventions must be reproducible;
- false separation is common in ranges;
- use structure, confirmation and risk limits together.
References
Risk note: This is educational content, not investment advice. Trading can result in losses; validate data, costs and risk limits independently.