


The Cup and Handle pattern is a rounded consolidation followed by a shorter pullback near the prior high. Traders use it as a context hypothesis: the cup describes a recovery, the handle shows a pause, and a neckline break needs confirmation. Shape alone does not guarantee a breakout, target or win rate.
Cup and Handle Structure: Cup, Handle and Neckline
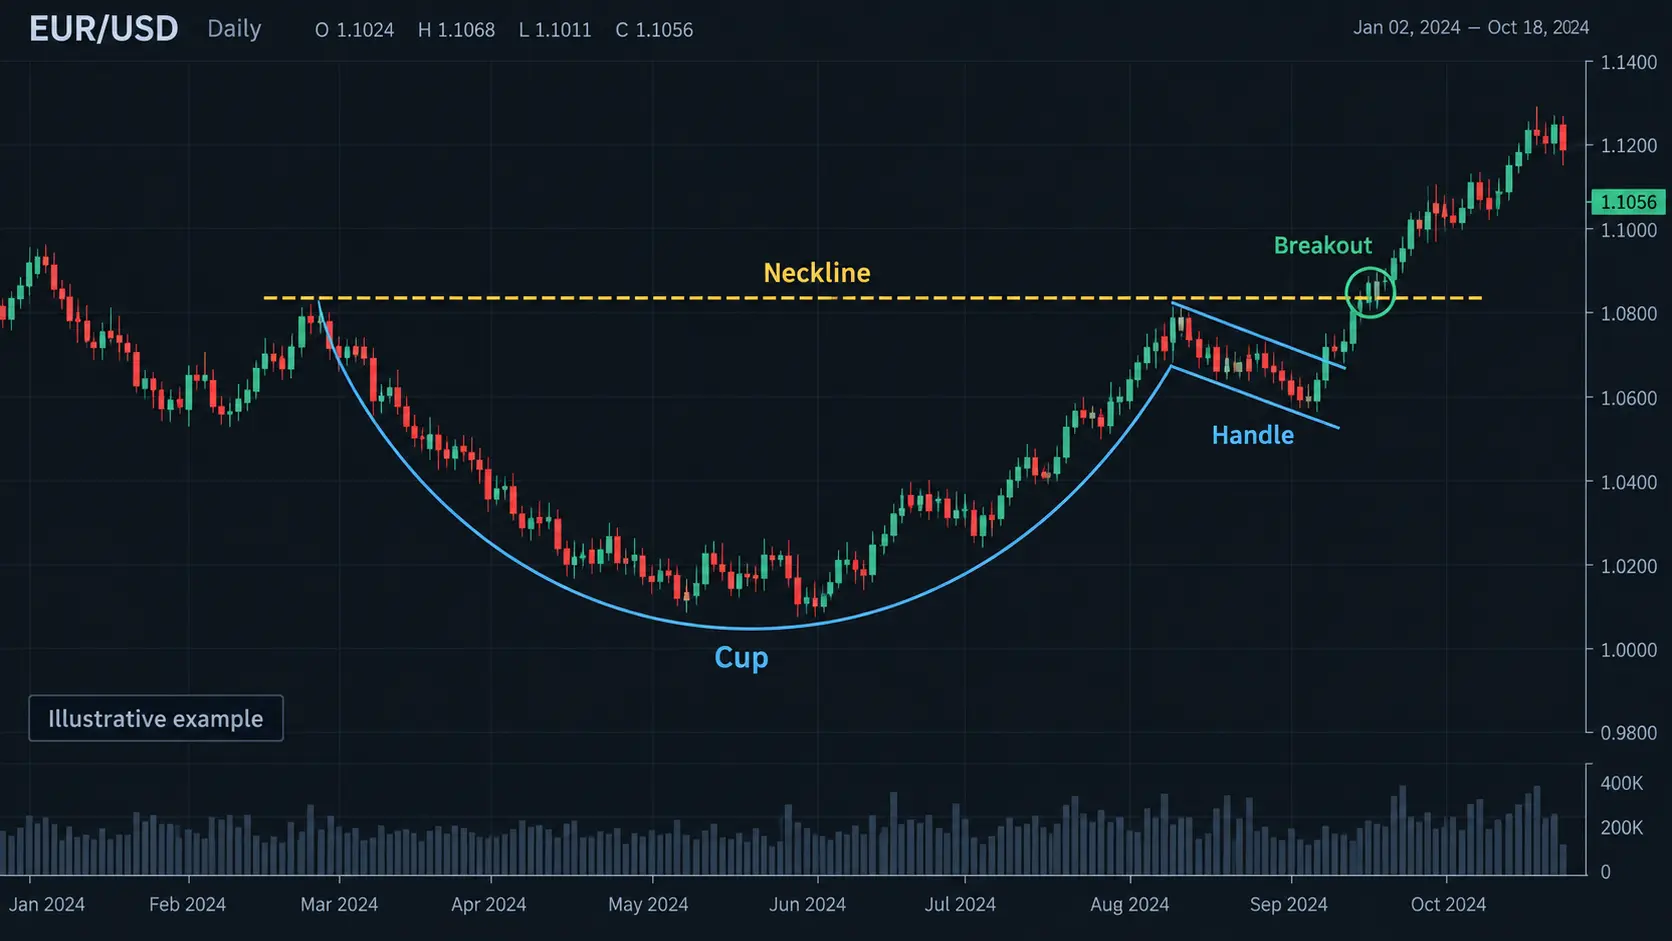
A conventional cup has two shoulders near a similar high and a rounded recovery between them. The handle is a relatively shallow, shorter consolidation below the neckline. These are descriptive tendencies, not rigid geometric requirements. Define the timeframe, the prior trend and the range of the neckline before applying the label.
What to mark
- left rim and right rim, including the price band rather than one exact tick;
- the cup low and whether the recovery is gradual or a news spike;
- handle boundaries, duration and whether the pullback remains proportionate;
- neckline closes and any retest; a wick above the line is not acceptance;
- an invalidation condition such as a decisive close back through the handle low.
Use the candlestick patterns hub to read individual bars, but keep the Cup and Handle as a multi-swing structure. The market structure guide helps distinguish a true sequence of swings from a shape created by hindsight.
Volume and Context: What the Pattern Can and Cannot Say
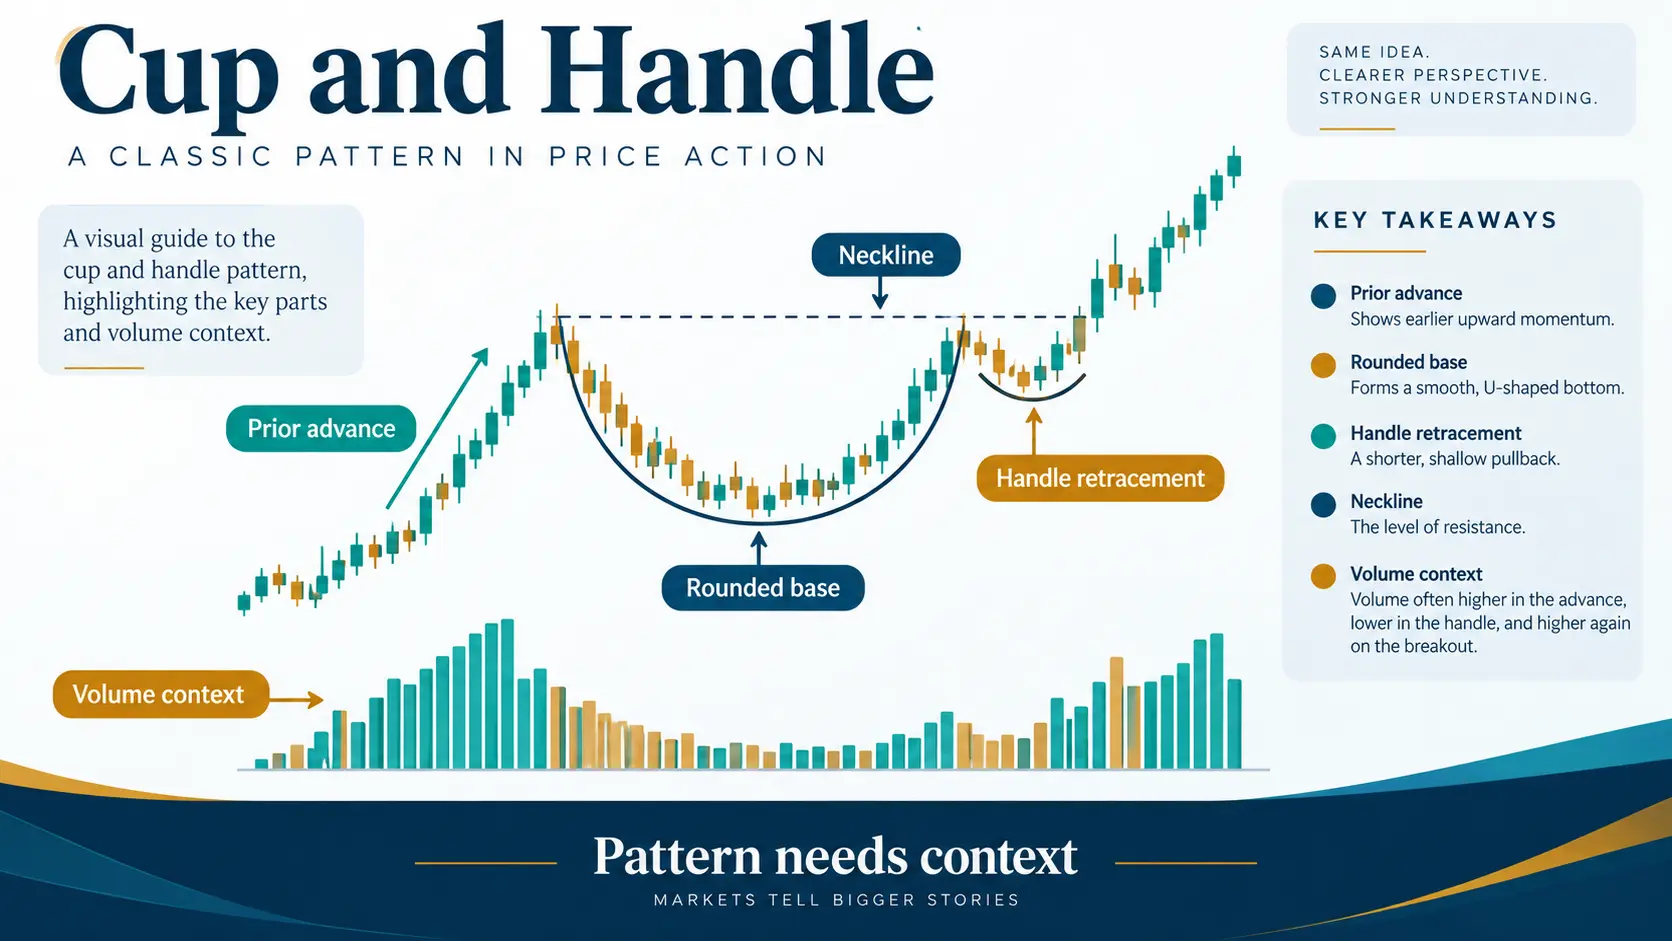
Some educational descriptions expect volume to contract during the handle and expand on a neckline test. That is a hypothesis to test against a stated data source and timeframe, not a universal rule. In spot Forex, tick volume is a broker-specific activity proxy; it is not centralized exchange volume. Record whether the chart is historical or illustrative and do not invent a win rate.
| Observation | Possible reading | Not proven by itself |
|---|---|---|
| Rounded recovery | Supply may have been absorbed over time | A bullish continuation is certain |
| Shallow handle | Profit-taking or balance near the rim | The handle must break upward |
| Volume expansion | More activity around the test | Institutional buying or future target |
| Neckline wick | Intrabar excursion above resistance | Acceptance above the level |
Context includes the broader trend, volatility regime, instrument liquidity and nearby resistance. A pattern under major resistance can fail even when its outline looks textbook.
Illustrative Example and Failure Cases
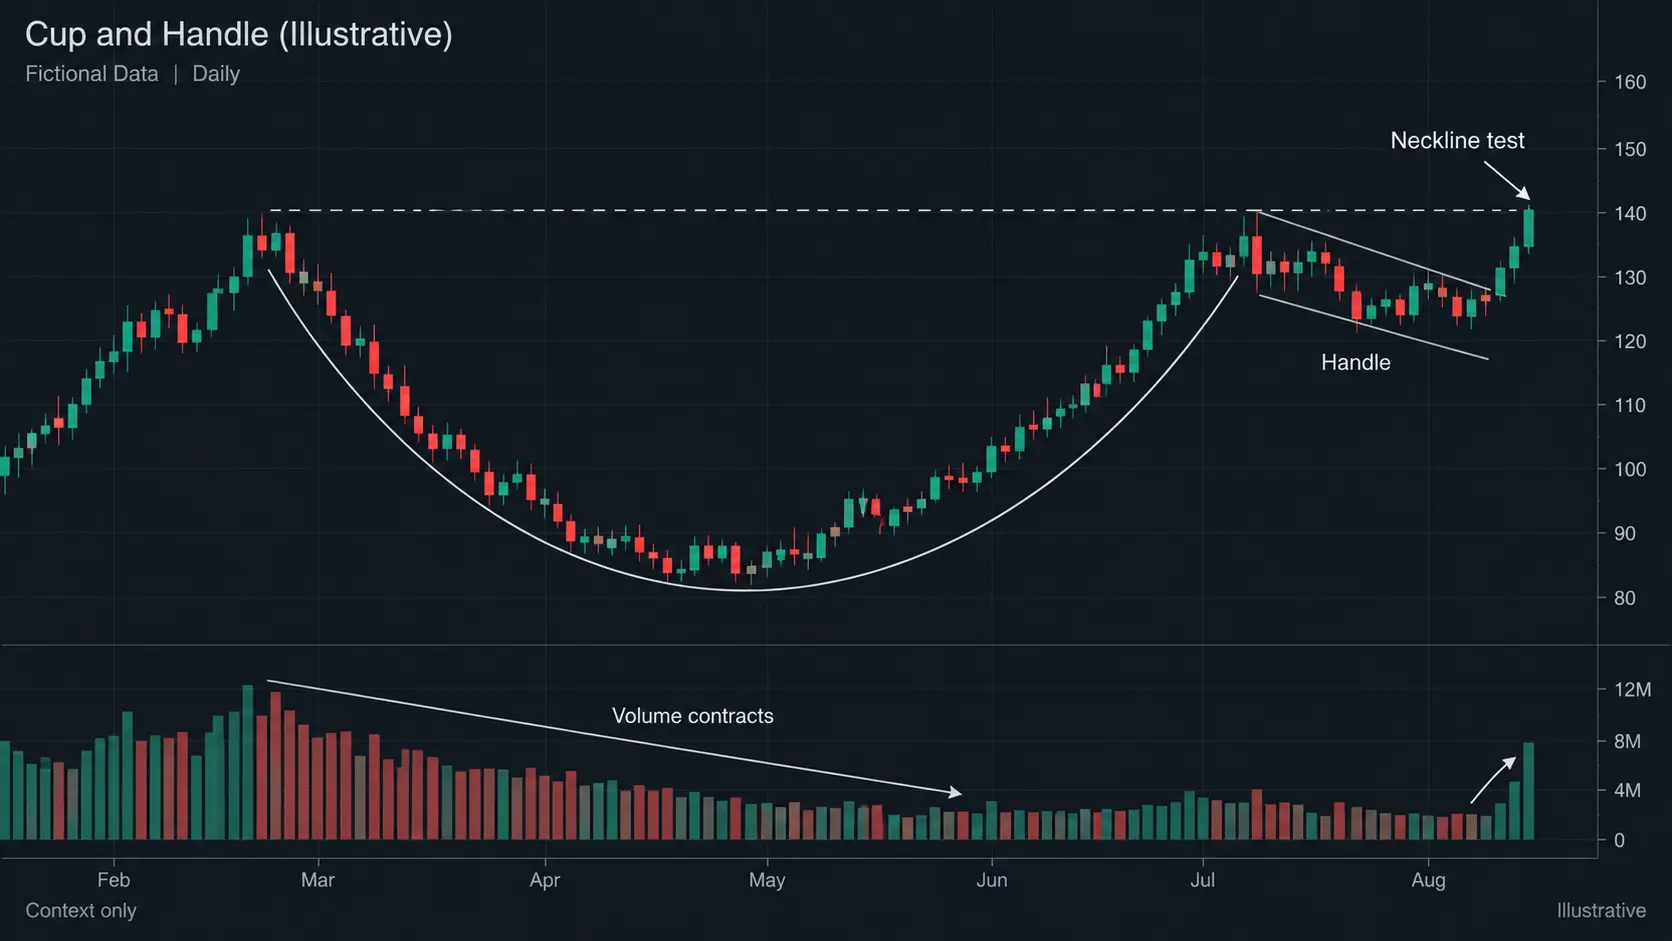
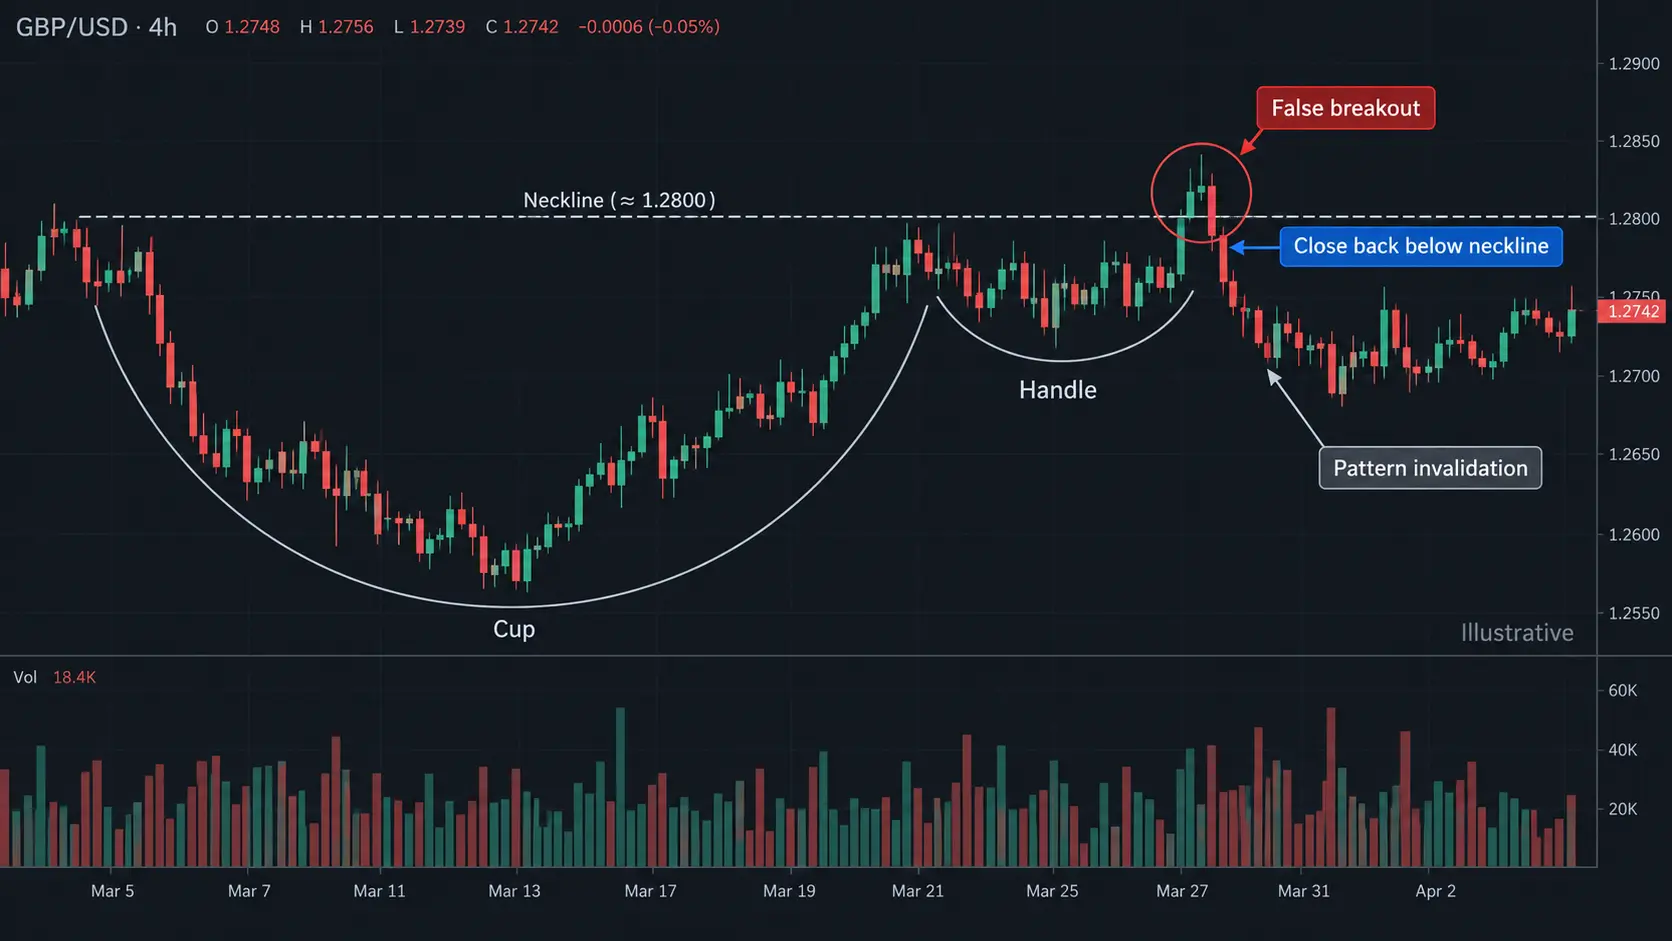
Imagine a fictional EUR/USD daily chart from 03/02/2025 to 30/05/2025 with rims near 1.0900, a cup low near 1.0500 and a handle between 1.0780 and 1.0870. A daily close above 1.0900 followed by a close back below the neckline is evidence against acceptance, not proof of a short trade. The working hypothesis is invalidated if price closes through the handle low or returns deeply into the cup without recovery. Do not convert the cup depth into an automatic target; any target method requires separate testing, fees and slippage assumptions.
Common failure cases
- a V-shaped rebound is labelled a rounded cup despite little balance;
- the two rims are at materially different levels and the neckline is forced;
- the handle lasts longer or becomes deeper than the supposed cup context;
- a news spike clears the neckline but there is no follow-through;
- the chart is selected after the outcome, creating hindsight bias.
A Context-First Workflow and Limitations
Workflow
- define instrument, timeframe, date range and the data source;
- mark rim, cup low, handle and neckline before looking at later bars;
- separate observation (close, range, volume) from the pattern hypothesis;
- require a close and follow-through, then document a retest or failure;
- predefine risk, costs and invalidation; evaluate samples instead of promising an outcome.
Limits
- pattern boundaries are subjective and change with timeframe;
- volume behavior differs across centralized futures, equities and spot Forex;
- a breakout can fail or become a range extension;
- one example cannot establish statistical edge;
- pattern recognition does not replace position sizing or risk management.
For execution-neutral planning, review risk–reward concepts. The link supports defining invalidation and costs; it is not a recommendation to trade every pattern.
Key takeaways
- Cup and Handle is a multi-swing context hypothesis;
- the handle and neckline need explicit boundaries;
- volume is a testable observation, not proof of future demand;
- close, follow-through and failure conditions matter more than a perfect shape;
- no pattern guarantees a target, win rate or profit.
References
Risk note: This is educational content, not investment advice. Pattern failure and leveraged trading can cause losses; verify data and manage risk for your circumstances.
Pingback: ICT Trading Concepts: Structure, Liquidity And Risk