


TRIX is a momentum oscillator built from the one-period rate of change of a triple-smoothed exponential moving average. It can describe momentum and filter some short-term noise, but it is lagging and is not a guaranteed trend or entry signal.
What Is the TRIX Indicator?
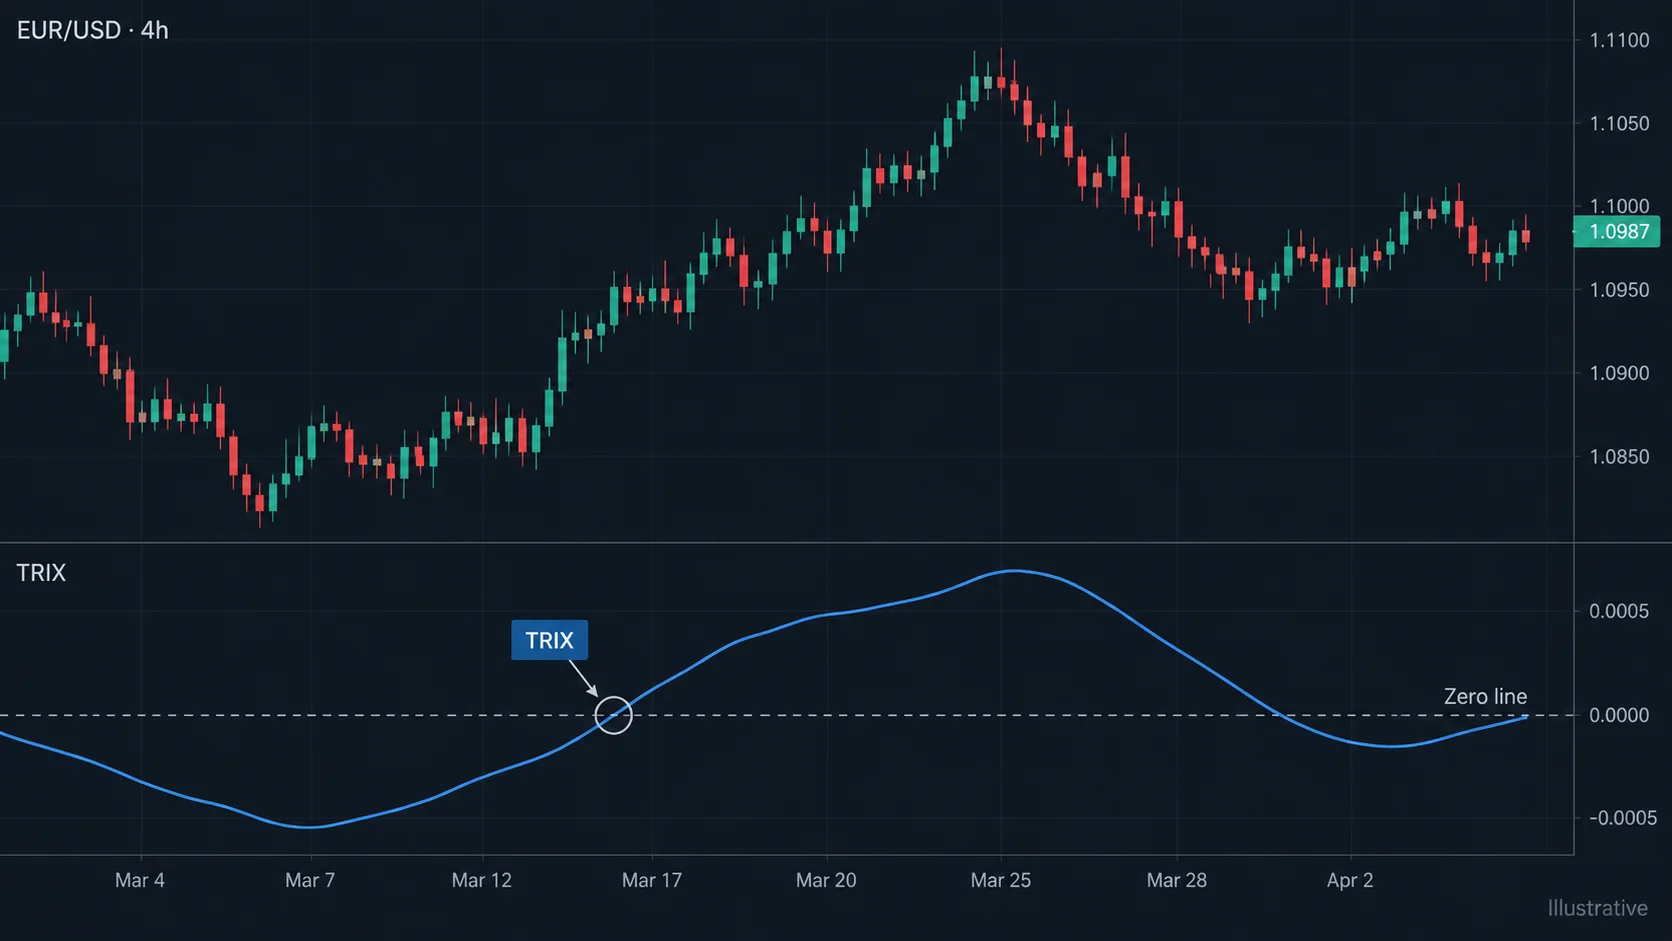
TRIX applies exponential smoothing three times to a selected price series and then measures its percentage change. The extra smoothing makes the line less jagged than many fast oscillators, while also delaying turns. Treat it as a compact description of momentum, not a forecast.
Read TRIX alongside market structure and candlestick context. A crossover without price context does not establish direction.
Formula: Triple Smoothing and Rate of Change
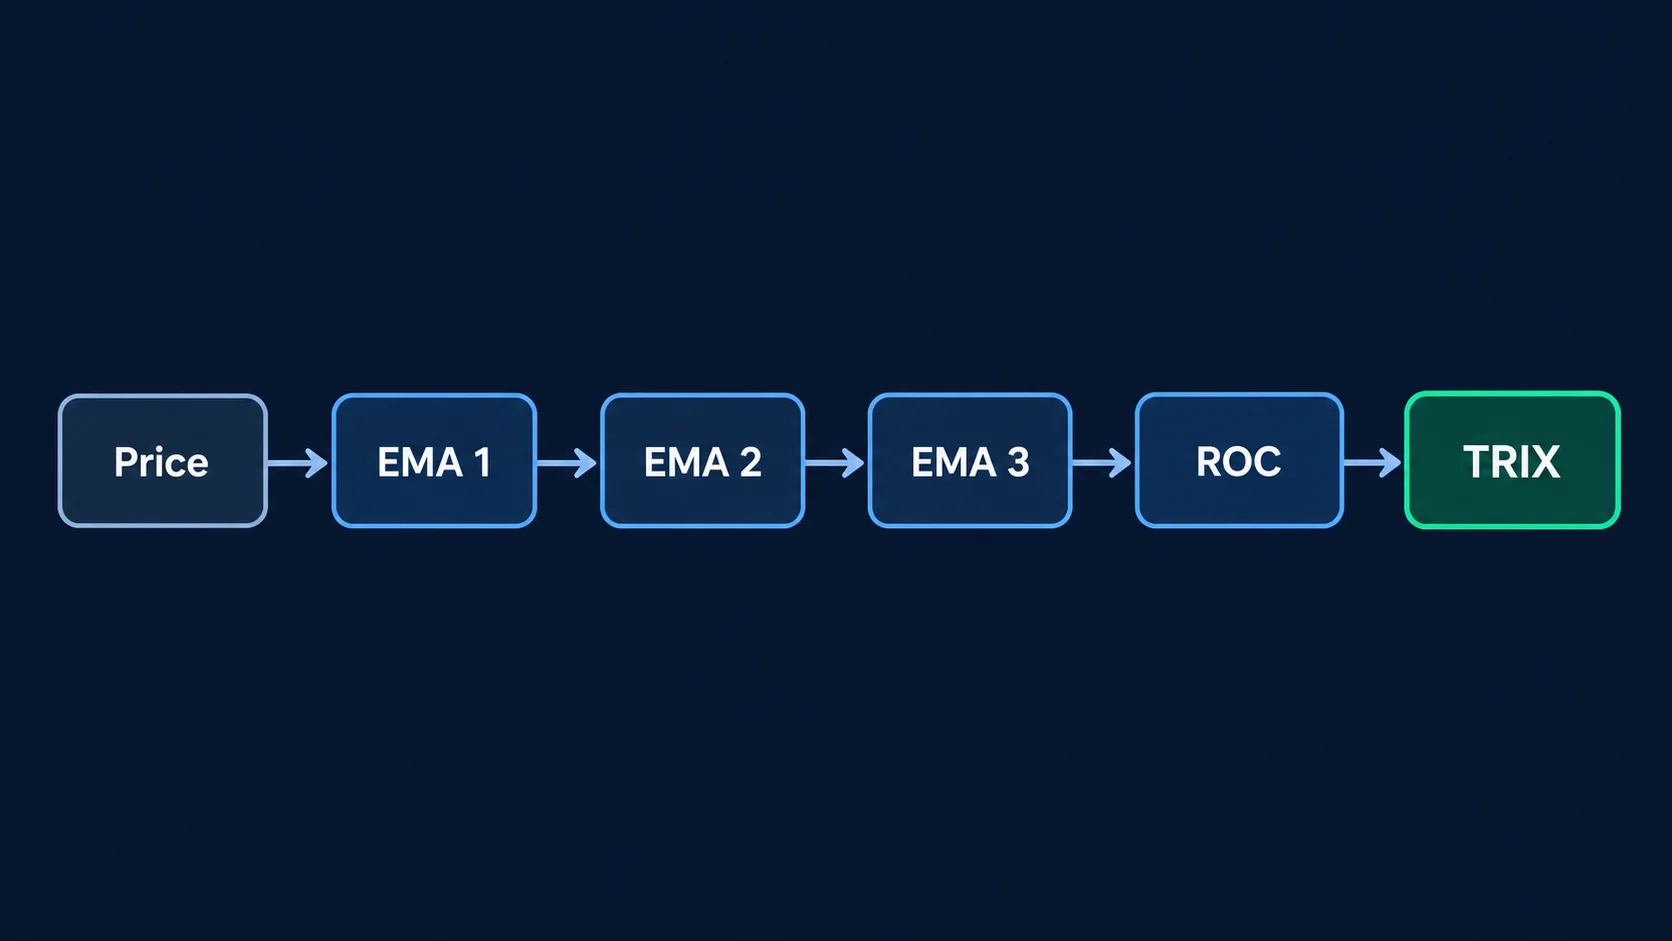
EMA1 = EMA(price, N), EMA2 = EMA(EMA1, N), EMA3 = EMA(EMA2, N), then TRIX = 100 × (EMA3 − EMA3[1]) / EMA3[1]. Some platforms add a signal-line EMA. Record N, signal length, price field, timeframe and data feed so another reader can reproduce the value.
| Observation | May describe | Does not prove |
|---|---|---|
| TRIX above zero | Triple-smoothed momentum is rising over the lookback | A durable uptrend |
| TRIX below zero | Triple-smoothed momentum is falling | A durable downtrend |
| Signal-line cross | Recent momentum changed relative to its average | A confirmed reversal |
| Price/TRIX divergence | Momentum and price reached different extremes | A timed reversal |
Illustrative Failure: A Cross Inside a Range
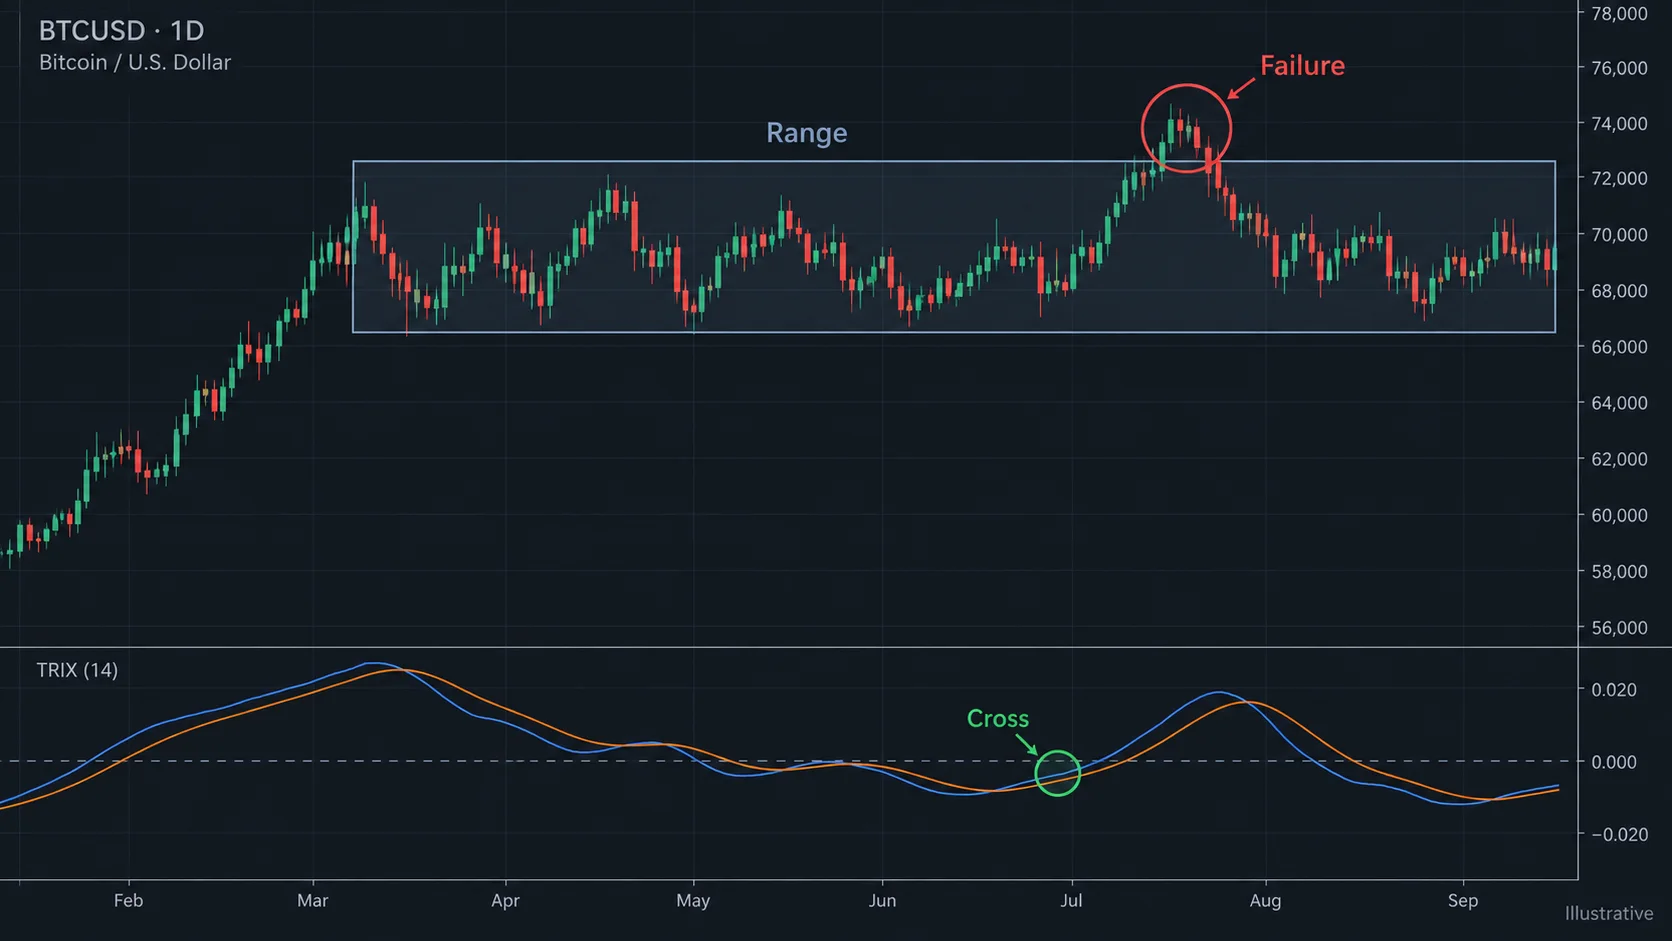
Imagine a fictional BTCUSD daily sample where TRIX crosses above zero while price remains between 66,000 and 72,000. Price briefly lifts, then returns to the range and TRIX rolls back below zero. The cross described a change in the smoothed series; it did not prove acceptance outside the range. A divergence can also disappear as older bars leave the calculation window.
Failure cases
- changing the smoothing period after seeing the outcome;
- treating a signal-line cross as an isolated entry trigger;
- comparing values built from different feeds or price fields;
- ignoring spread, gaps, news and the indicator’s lag;
- selecting only successful-looking examples and omitting failures.
A Repeatable Workflow and Limits
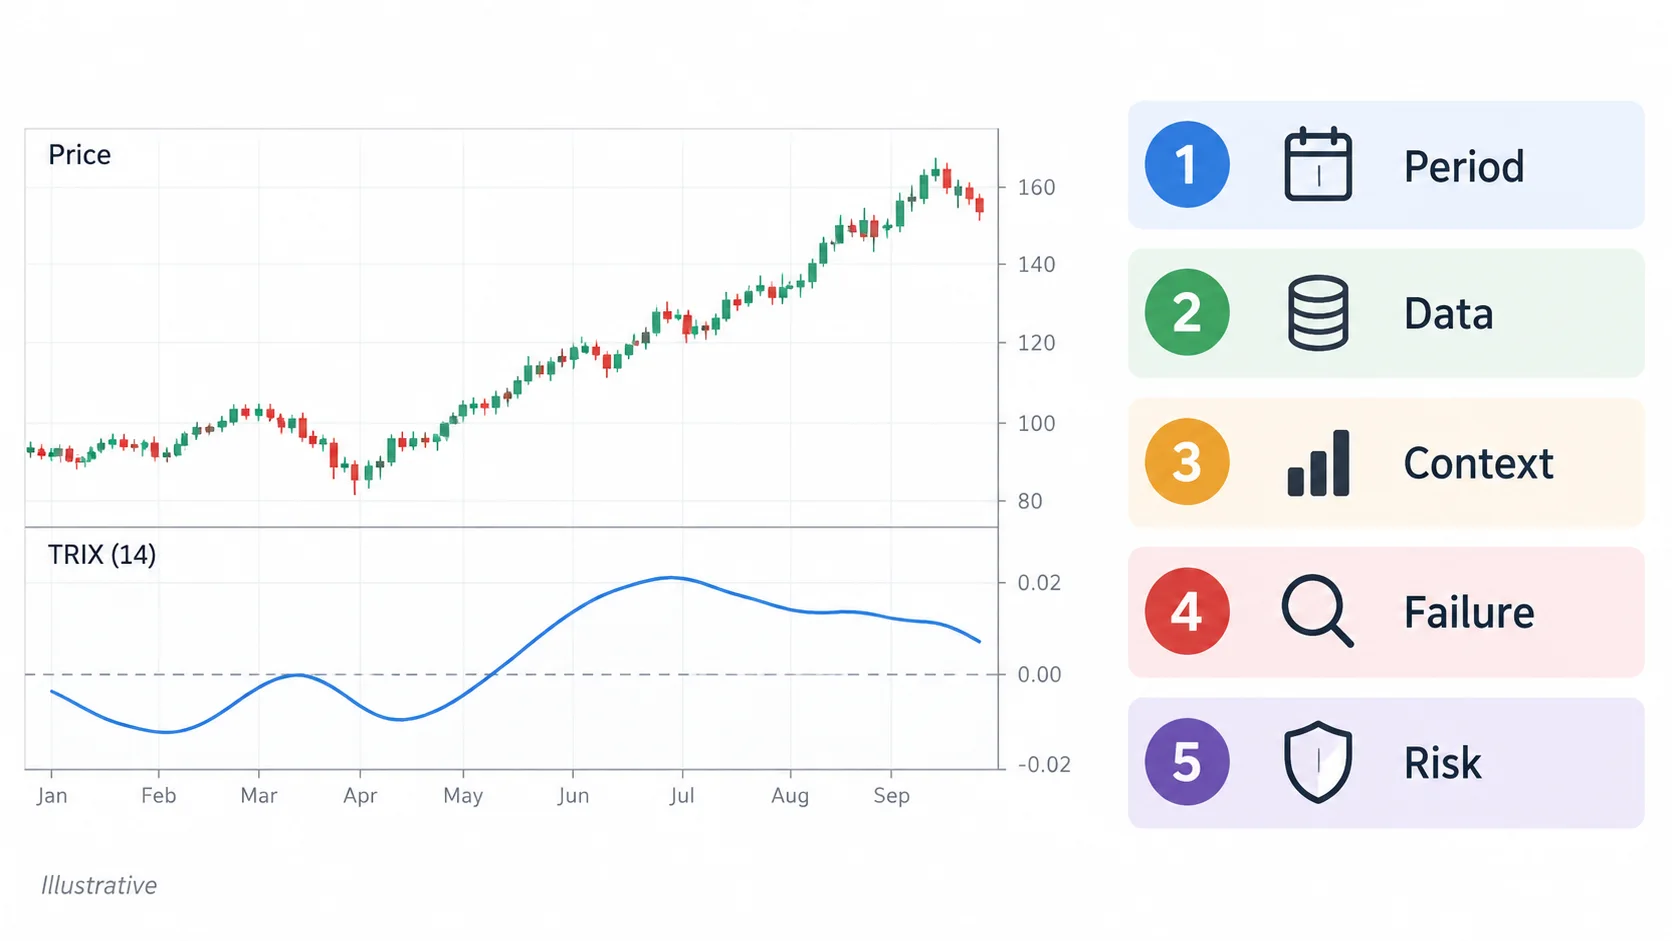
- write the price field, N, signal length, timeframe and feed before testing;
- compare TRIX with structure and nearby levels;
- separate trend conditions from range conditions;
- define what would invalidate the momentum hypothesis;
- document costs and position sizing using position-size calculations and risk–reward planning;
- log lagging and failed crosses as well as clean examples.
Limits
- triple smoothing hides intrabar timing;
- parameters change lag and signal frequency;
- divergence is not a probability estimate;
- TRIX does not provide volume or order-flow information;
- no oscillator replaces risk management.
Key takeaways
- TRIX is a triple-smoothed rate-of-change oscillator;
- zero and signal-line crosses are observations, not guarantees;
- period and data-feed choices materially change results;
- range conditions can produce repeated failures;
- test a written rule and manage risk before relying on it.
References
Risk note: This is educational content, not investment advice. Trading can result in losses; validate data, costs and risk limits independently.
Pingback: Bollinger Bands: Squeeze, Breakout And Mean Reversion