


buy-side and sell-side liquidity Buy-side liquidity is practitioner terminology for orders that may be triggered above visible highs; sell-side liquidity refers to orders that may be triggered below visible lows. The labels describe a hypothesis about order location, not a guaranteed reversal direction or proof of who placed the orders. The method should be treated as a testable chart-reading framework rather than a forecast. Before using it, define the market condition, confirmation event, invalidation price, transaction costs and maximum risk. This guide explains the rules, a repeatable workflow, common failure modes and the most relevant supporting concepts.
Definition: What Are Buy-Side and Sell-Side Liquidity?
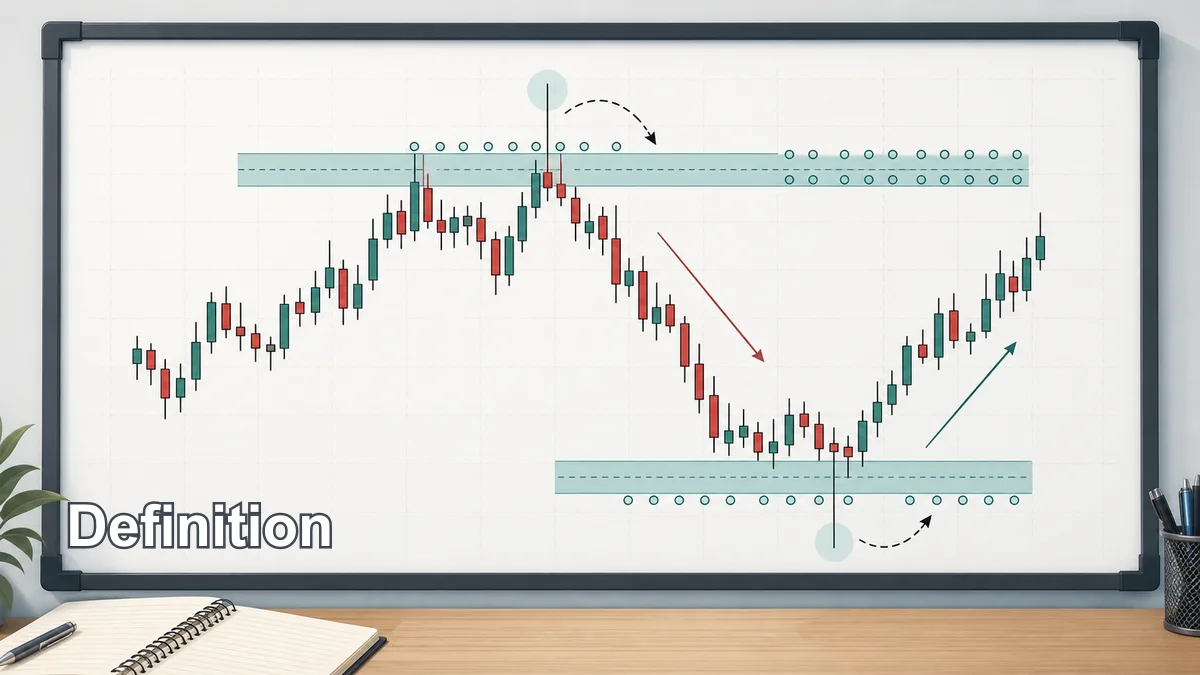
Buy-side liquidity refers to orders that may be triggered above a visible high. These orders can include stop losses from short sellers, buy stop entries from breakout traders, and pending orders from traders who want confirmation above resistance. Because many traders can see the same high, the area above it may become a pool of buy orders.
Sell-side liquidity is the opposite. It refers to orders that may be triggered below a visible low. These can include stop losses from long traders, sell stop entries from breakout sellers, and pending orders from traders waiting for a breakdown. The area below an obvious low can become a pool of sell orders.
The words buy-side and sell-side describe the type of orders likely to be triggered, not a guaranteed direction after the level is reached. Price can run above buy-side liquidity and continue higher if buyers accept the new prices. It can also sweep the high, reject, and reverse lower. Price can run below sell-side liquidity and continue lower, or sweep the low and reverse higher. The reaction after the liquidity event is what matters.
This idea connects with the basic market definition of liquidity. Investor.gov explains liquidity as how easily or quickly a security can be bought or sold in a secondary market. On a chart, Smart Money traders extend that thinking by asking where enough resting orders may exist for price to execute a larger move.
How to Identify Buy-Side and Sell-Side Liquidity
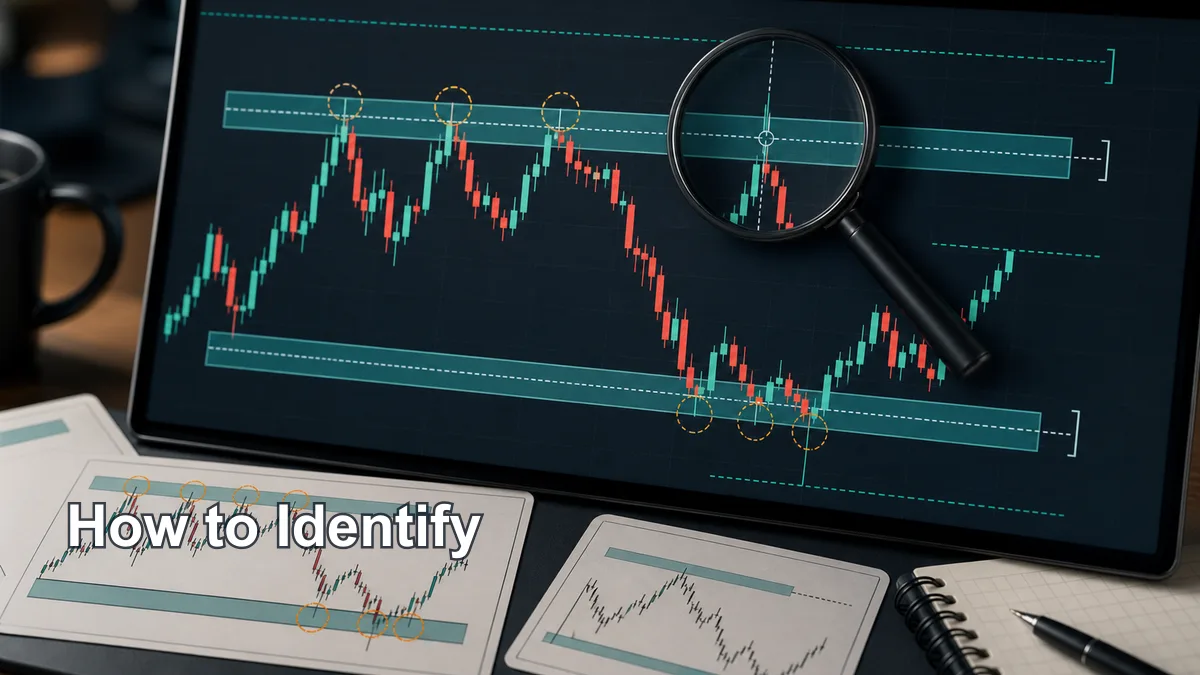
The easiest way to identify buy-side liquidity is to look above clear resistance points. Previous swing highs, equal highs, range highs, session highs, previous day highs, and weekly highs can all attract buy-side liquidity. If a level is so visible that many traders would use it for a breakout entry or a short stop, it is worth marking.
To identify sell-side liquidity, look below clear support points. Previous swing lows, equal lows, range lows, session lows, previous day lows, and weekly lows can all attract sell-side liquidity. Again, visibility matters. A tiny low inside a noisy candle cluster is less important than a clean low that defines the edge of a range or the last meaningful swing.
A practical routine is to start on the higher timeframe, mark the major highs and lows, then drop to the execution timeframe. This prevents the trader from treating every small wick as important. A five-minute liquidity pool becomes more useful when it lines up with a one-hour or four-hour level.
Equal highs and equal lows deserve special attention because they are visually obvious. Equal highs can attract breakout buyers and short stops. Equal lows can attract breakdown sellers and long stops. When price approaches these levels, do not assume a trade exists yet. Wait to see whether price accepts beyond the level or rejects after taking it.
Why Buy-Side and Sell-Side Liquidity Work
Buy-side and sell-side liquidity work as a trading concept because many market participants make decisions around the same visible levels. A short trader may place a stop above a recent high. A breakout trader may place a buy stop above that same high. A long trader may place a stop below a recent low. A breakdown trader may place a sell stop below that same low. The more visible the level, the more likely it is to matter.
This does not mean a large participant can simply move price anywhere at will. It means obvious levels can become areas where orders cluster. When price reaches those areas, execution becomes easier because there may be more opposing orders available. That is why liquidity is often described as a magnet. Price does not always go there immediately, but the level can become a natural target.
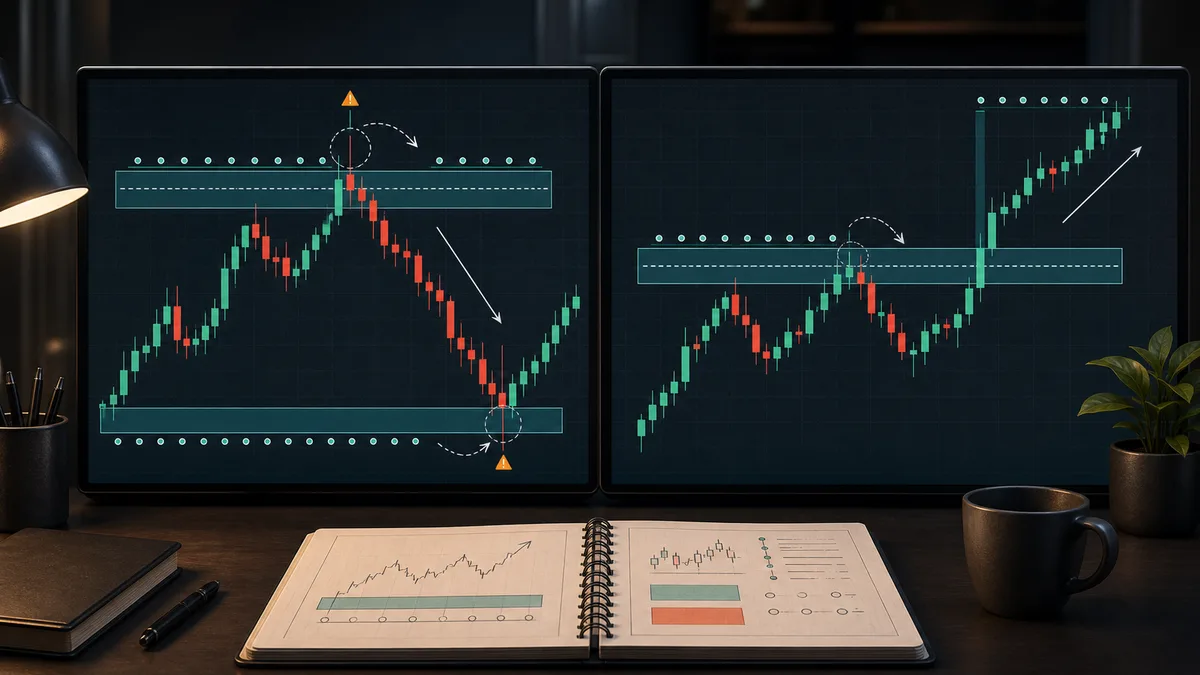
The concept also explains why breakouts sometimes fail. If many traders buy above a high, price may push through the high, fill those buy orders, and then fall back below the level if there is not enough continued demand. That failed breakout is often called a buy-side liquidity sweep. The same logic applies below lows. Price can push below support, trigger sell orders, and then reclaim the level if sellers cannot maintain control.
For a trader, the value is not prediction. The value is preparation. When you know where liquidity may sit, you can wait for price to reveal whether the market is sweeping, accepting, or rejecting. That shift from prediction to evidence is what makes liquidity analysis useful.
Step-by-Step Usage in a Trading Plan
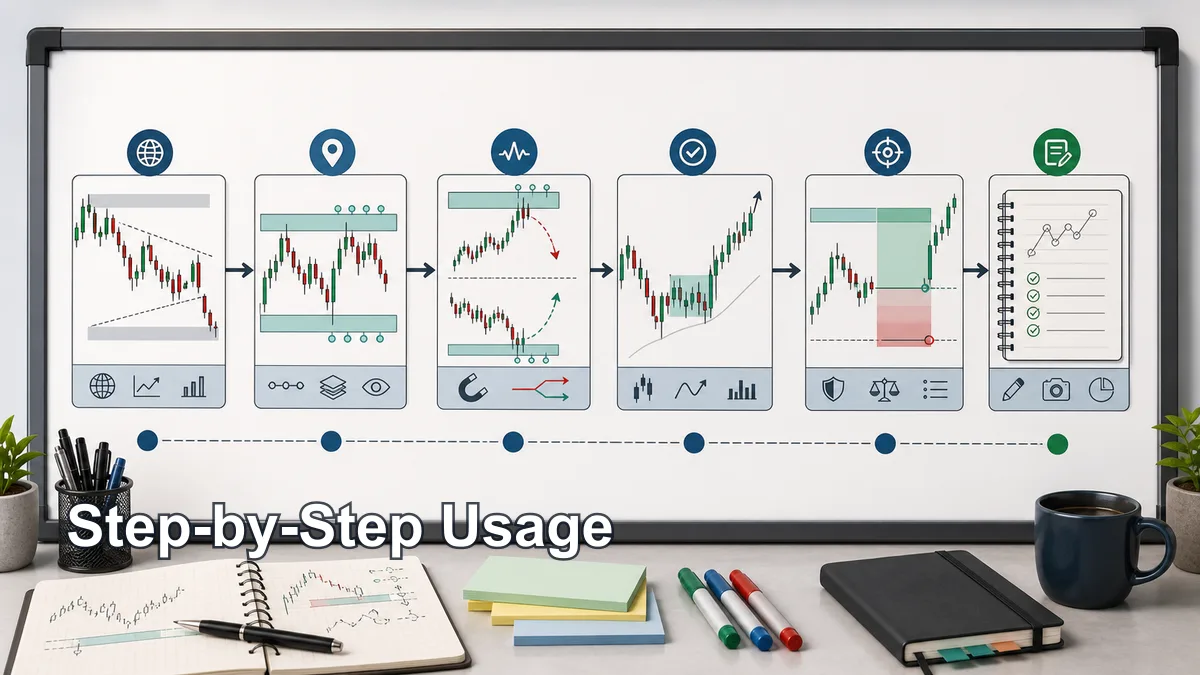
Step one is context. Decide whether the market is trending, ranging, reversing, or sitting near a higher-timeframe level. Buy-side liquidity above a range high means something different from buy-side liquidity in the middle of a strong uptrend. Sell-side liquidity below a higher-timeframe support area means something different from a random low inside a small pullback.
Step two is mapping the active liquidity pool. Choose the liquidity that price is currently approaching or reacting from. Do not mark every high and low on the chart. A clean plan usually focuses on one buy-side pool above price and one sell-side pool below price.
Step three is waiting for the event. Price may sweep the level and return, break and accept beyond it, or stall before reaching it. Each behavior tells a different story. A sweep followed by strong displacement may support a reversal idea. Acceptance beyond the level may support continuation. Choppy movement with no reaction may mean there is no trade.
Step four is confirmation. For a bullish idea after sell-side liquidity is taken, you may wait for price to reclaim the low, break short-term structure higher, and leave a clean point of interest for a retest. For a bearish idea after buy-side liquidity is taken, you may wait for rejection, displacement lower, and a lower-timeframe structure shift.
Step five is risk. Define where the liquidity idea is wrong before entry. If a bullish sweep depends on price reclaiming a low, then acceptance below the sweep can invalidate the idea. If a bearish sweep depends on price rejecting above a high, then acceptance above the high can invalidate the short idea. Step six is review. Save screenshots so you can compare clean sweeps, failed sweeps, and breakouts that continued.
Confirmation Rules Before Entering
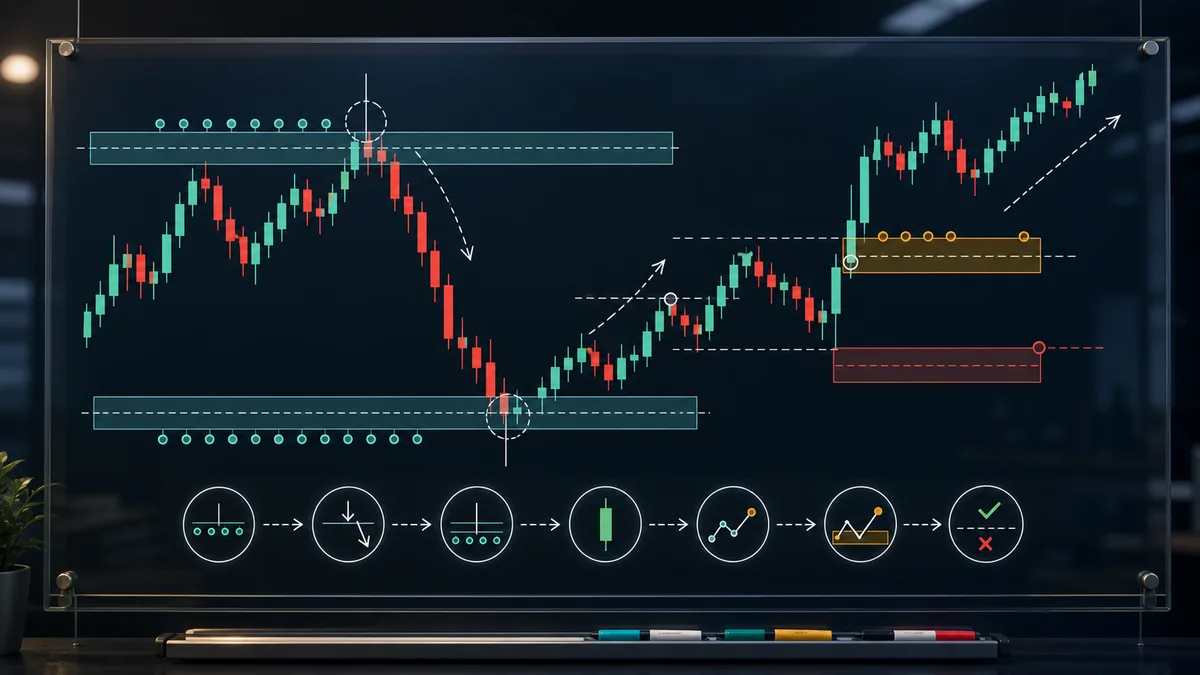
The first confirmation rule is location. A liquidity event is stronger when it happens at a meaningful level, such as a higher-timeframe support or resistance zone, a range boundary, a previous day high or low, or a clear session extreme. A sweep in the middle of nowhere is easier to ignore.
The second rule is rejection or acceptance. After buy-side liquidity is taken, does price close back below the old high or keep building above it? After sell-side liquidity is taken, does price reclaim the old low or continue accepting lower? The answer decides whether you are looking at a potential sweep or a potential breakout.
The third rule is displacement. A strong move away from the liquidity level shows urgency. For a bearish sweep, displacement lower after taking buy-side liquidity is more convincing than slow drift. For a bullish sweep, displacement higher after taking sell-side liquidity is more convincing than weak candles.
The fourth rule is structure. A lower-timeframe change of character or break of structure can help confirm that control is shifting. The fifth rule is invalidation. If your stop location is unclear, the setup is not ready. A liquidity idea without invalidation is only a story.
It also helps to check execution conditions. Wide spreads, major news, and thin sessions can distort liquidity behavior. Investor.gov notes that stop orders become market orders after the stop price is reached, which is one reason stop-heavy areas can move quickly when triggered.
Examples of Buy-Side and Sell-Side Liquidity
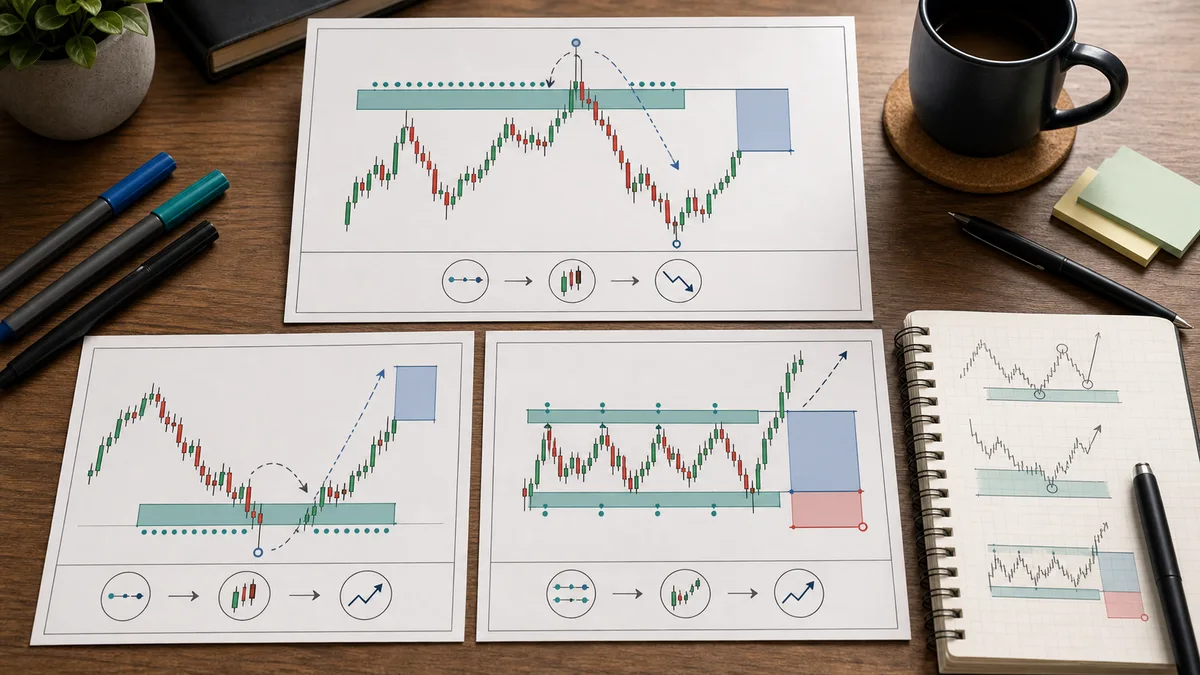
Example one: price forms equal highs inside a range. Breakout buyers place orders above the highs, while short sellers place stops there. Price pushes above the equal highs, triggers buy-side liquidity, fails to hold, and closes back inside the range. If price then breaks a short-term low with displacement, a bearish reversal idea may form.
Example two: price forms equal lows above a higher-timeframe demand area. Long traders place stops below the lows, and breakout sellers wait under support. Price pushes below the equal lows, takes sell-side liquidity, quickly reclaims the level, and breaks short-term structure higher. A bullish idea may form if the trader can define a clean entry and invalidation.
Example three: price breaks above a range high and does not reject. Instead, it consolidates above the old high and retests it as support. In this case, buy-side liquidity was not simply swept. The market accepted above the level. A continuation plan may be more logical than fading the breakout.
Example four: price drops below a previous low during a news event and spreads widen. The candle looks like a liquidity sweep, but execution conditions are poor and the reaction is unclear. A disciplined trader may skip the trade. A chart pattern is not enough when the market environment makes risk difficult to control.
Common Mistakes When Trading Liquidity
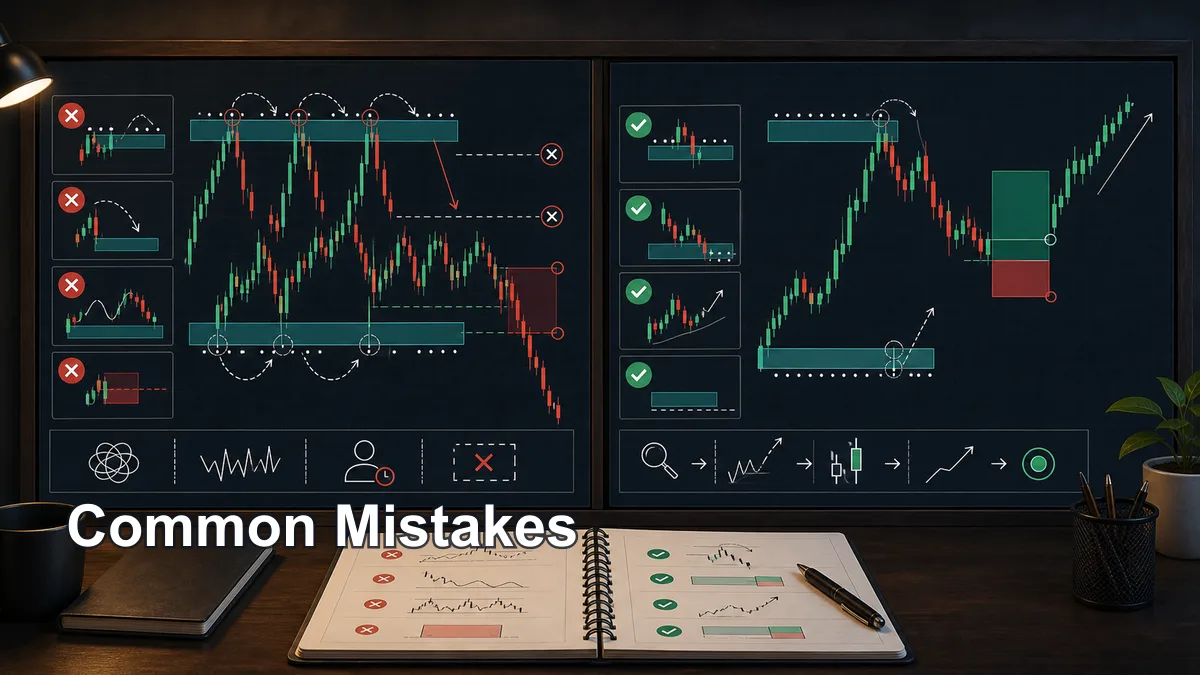
The first mistake is assuming every high will be swept and every low will reverse. Liquidity levels are important, but they are not guaranteed reversal points. Sometimes price sweeps and reverses. Sometimes it breaks and continues. The trader must watch the reaction.
The second mistake is entering on the sweep candle without confirmation. A wick beyond a high or low can be the beginning of rejection, but it can also be the first candle of a real breakout. Waiting for reclaim, rejection, displacement, or structure shift can reduce low-quality entries.
The third mistake is marking too many levels. If every candle is liquidity, nothing is liquidity. Focus on obvious highs, lows, equal levels, session extremes, and higher-timeframe references. Clean charts create cleaner decisions.
The fourth mistake is ignoring higher-timeframe context. A sell-side sweep on a small timeframe may be meaningful if it occurs at daily support. The same sweep in the middle of a bearish trend may be only a pause before continuation. Context decides how much weight the event deserves.
The fifth mistake is using liquidity as an excuse to avoid stops. A trade idea is only useful if you know where it is wrong. The clean way to use buy-side and sell-side liquidity is simple: mark the obvious pools, wait for price to interact with them, require confirmation, define invalidation, and target the next realistic liquidity area.
After marking buy-side or sell-side liquidity, use the liquidity sweep confirmation rules to evaluate rejection, acceptance and invalidation.
Key takeaways
- Buy-side liquidity is practitioner terminology for orders that may be triggered above visible highs; sell-side liquidity refers to orders that may be triggered below visible lows.
- The labels describe a hypothesis about order location, not a guaranteed reversal direction or proof of who placed the orders.
- Mark the level before price reaches it and distinguish rejection back through the level from acceptance and continuation beyond it.
- A valid plan separates location, trigger, invalidation, position size and exit logic.
A validation workflow you can reproduce
- Define the sample: choose the market, timeframe, session and date range before reviewing outcomes.
- Write the rule: Mark the level before price reaches it and distinguish rejection back through the level from acceptance and continuation beyond it.
- Record invalidation: identify the observable price event that disproves the setup.
- Include execution costs: account for spread, commission and slippage where relevant.
- Validate separately: test the finished rule on data that was not used to create it.
When this concept is unreliable
The concept is unreliable when every high or low is treated as a reversal target without testing the reaction that follows. Keep failed and skipped examples in the journal so the review is not limited to attractive winners.
Use this concept within a complete analysis
This method should remain connected to its parent framework and adjacent decision steps. Use Smart Money Concepts: Complete Trading Guide, Breaker Block Trading Guide, ICT Power of Three: Accumulation Manipulation Distribution, ICT Trading: Complete Beginner Guide, Liquidity in Trading: Complete Guide and Point of Interest in Trading: Complete Guide to compare definitions, establish context and avoid treating one signal as a complete trading system.
References and methodology
Terminology note: SMC, ICT and MSNR terms are practitioner conventions, not standardized exchange or regulatory definitions. This article defines the convention it uses and avoids inferring participant identity from candles alone.
Practise before considering real capital
Use historical charts or a demo account to test the written rules before considering live execution. Review the Exness account and demo information. Availability, protections and trading conditions depend on jurisdiction, so review the applicable legal documents yourself.
Affiliate disclosure: Học Làm Trader may receive a commission if you open an account through this link, at no additional cost to you. This relationship does not determine the educational conclusions.
Risk warning: This article is for education and general information only. It is not investment advice, a trade signal or an invitation to trade. Trading can result in loss of capital, and past examples do not guarantee future results. Assess your own circumstances and risk tolerance.