


Equal highs and equal lows trading is a practical way to study where liquidity may be resting on a chart. Equal highs form when price reacts from a similar high area more than once. Equal lows form when price reacts from a similar low area more than once. Because these levels are easy to see, many traders use them for breakout entries, stop placement, profit targets, or liquidity-sweep ideas.
The key is not to treat equal highs or equal lows as magic lines. They are visible decision areas. Price can break through them and continue, sweep through them and reverse, or keep ranging around them until the structure becomes clearer. A good trader watches the reaction, waits for confirmation, and defines invalidation before risking money.
This guide supports the Smart Money hub and the Liquidity category. For the parent pillar, read Liquidity in Trading: Complete Guide. For the previous related article, study Liquidity Sweep: How to Identify Stop Hunts.
Nothing here is financial advice, investment advice, or a trading signal. Equal-level analysis can fail in every market. The CFTC warns that forex and leveraged trading can be risky, and Investor.gov describes day trading as extremely risky. Use these concepts for chart education, testing, and risk-aware planning only.
Author and review note: Written by the HocLamTrader Editorial Team for educational chart study. Updated May 24, 2026. Examples are conceptual and should be tested with your own market, timeframe, spread, session, and execution rules.
Definition: What Are Equal Highs and Equal Lows?
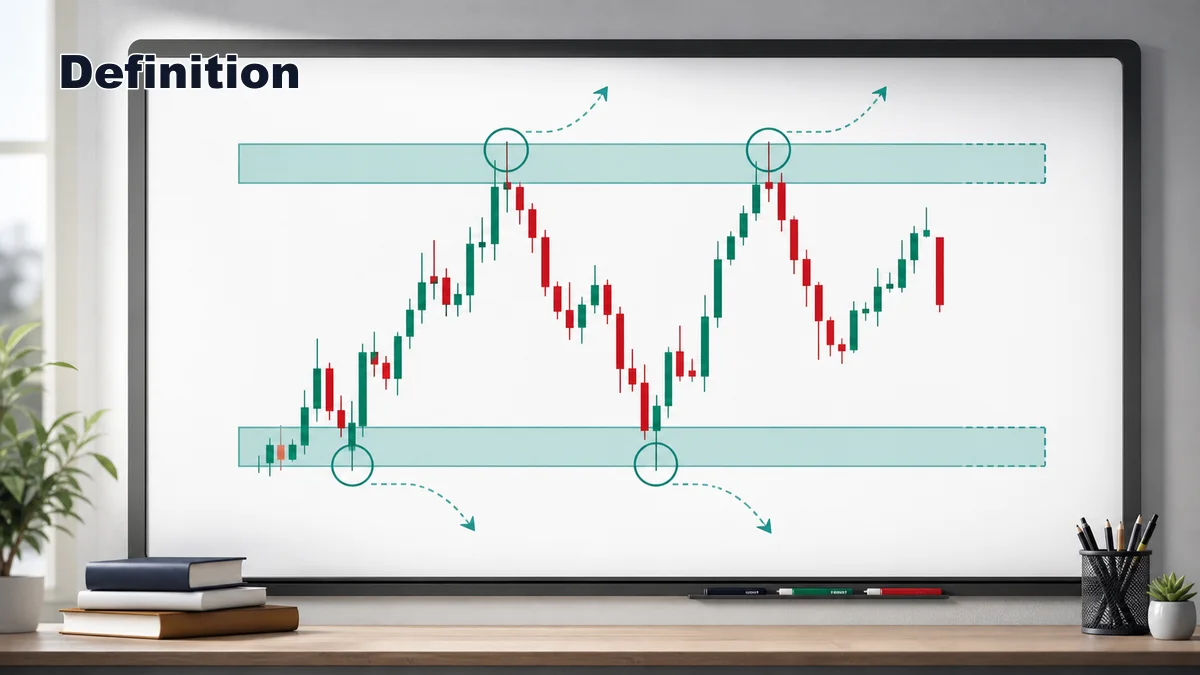
Equal highs are two or more swing highs that form around the same price area. They do not need to match tick for tick. In real markets, price often reacts within a small zone instead of an exact line. The practical question is whether the highs are close enough that many traders would see a clear resistance area or breakout trigger.
Equal lows are the opposite. They are two or more swing lows that form around a similar price area. Many traders see equal lows as support. Long traders may place stops below them. Breakout sellers may wait below them. Smart Money and liquidity traders often call the area below equal lows sell-side liquidity, while the area above equal highs is often called buy-side liquidity.
The equal level itself is not the trade. It is a location. A trader still needs context, reaction, confirmation, and risk. If price pushes above equal highs and holds above them, that may be breakout acceptance. If price pushes above the highs and quickly falls back below, that may be a liquidity sweep. If price keeps chopping through the level, the market may simply be unclear.
For beginners, the cleanest equal highs and lows usually appear inside ranges, near session extremes, around previous day highs or lows, or at obvious swing points on the higher timeframe. The best examples are visible without zooming in too much or forcing the chart.
How to Identify Equal Highs and Equal Lows

Start with the timeframe that controls your trade idea. A day trader may use the daily, four-hour, and one-hour charts for context before moving to a lower timeframe for execution. A swing trader may care more about the weekly and daily levels. Equal highs and lows on higher timeframes usually matter more than tiny equal levels in the middle of intraday noise.
Next, mark the obvious swing points. For equal highs, look for two or more peaks that reject from a similar area. For equal lows, look for two or more troughs that defend a similar area. Draw a zone that covers the reaction area instead of a razor-thin line. This keeps your analysis realistic because spreads, wicks, and volatility can vary.
Then ask whether other traders are likely to notice the level. A level becomes more useful when it is obvious. Equal highs near a range top are easier to read than equal highs hidden inside a messy consolidation. Equal lows near a previous day low or session low may attract more attention than a small double bottom in the middle of nowhere.
Finally, observe how price approaches the level. A slow drift into equal highs may show weakening pressure. A fast displacement into the level may create a different type of reaction. If price reaches the level during an active session, the reaction may be cleaner than during thin market conditions. Identification is not only about drawing the level. It is also about reading the approach.
Why Equal Highs and Equal Lows Work
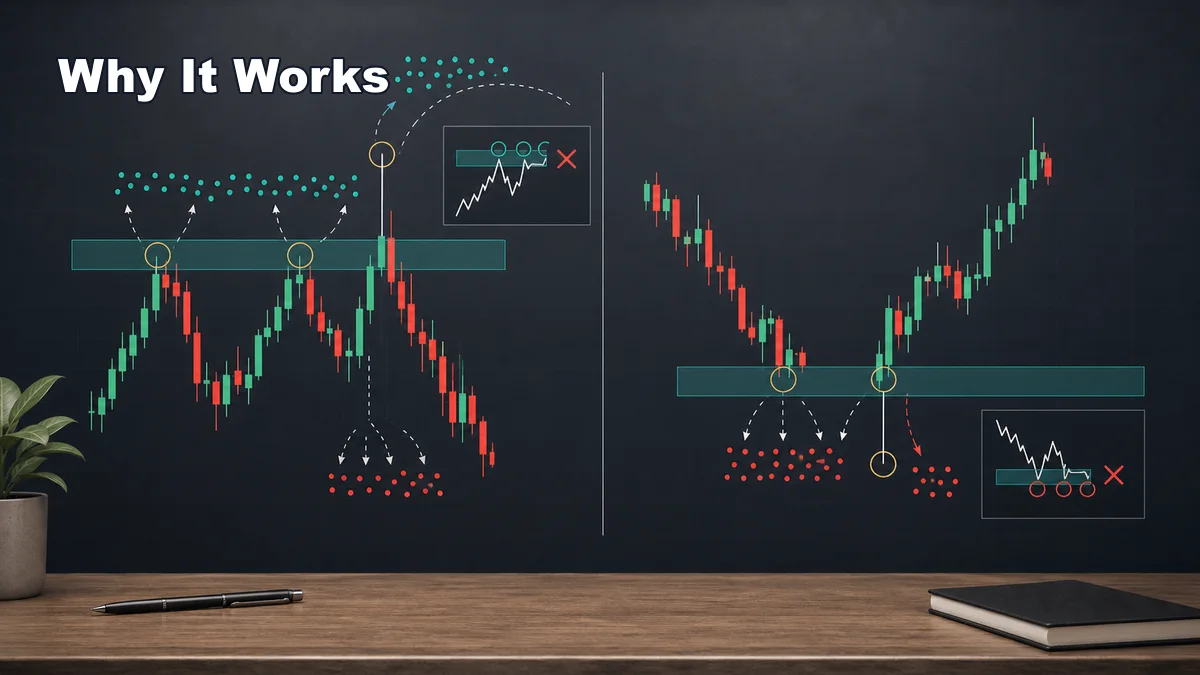
Equal highs and equal lows work because many traders make decisions around obvious levels. Short sellers may place protective stops above equal highs. Breakout traders may place buy orders above the same highs. Long traders may place stops below equal lows. Breakdown traders may place sell orders below those lows. That clustering of decisions can create liquidity around the level.
Liquidity does not guarantee reversal. It simply means the level may attract activity. When price trades above equal highs, it may trigger buy stops and breakout buys. If price cannot continue and falls back below the level, breakout buyers can become trapped. Their exits may add fuel to the move lower. This is the logic behind a bearish sweep of buy-side liquidity.
The same idea works below equal lows. A push below equal lows can trigger sell stops and breakout shorts. If price quickly reclaims the level, late sellers may be trapped, and the reclaim can support a bullish reaction. The sweep is stronger when it happens at a meaningful higher-timeframe location and is followed by displacement or a clear market structure shift.
Equal levels also help traders avoid random analysis. Instead of guessing where liquidity might be, the trader focuses on areas that many market participants can see. This does not make the setup certain. It makes the hypothesis clearer. Clear hypotheses are easier to test, journal, and improve.
Step-by-Step Usage in a Trading Plan
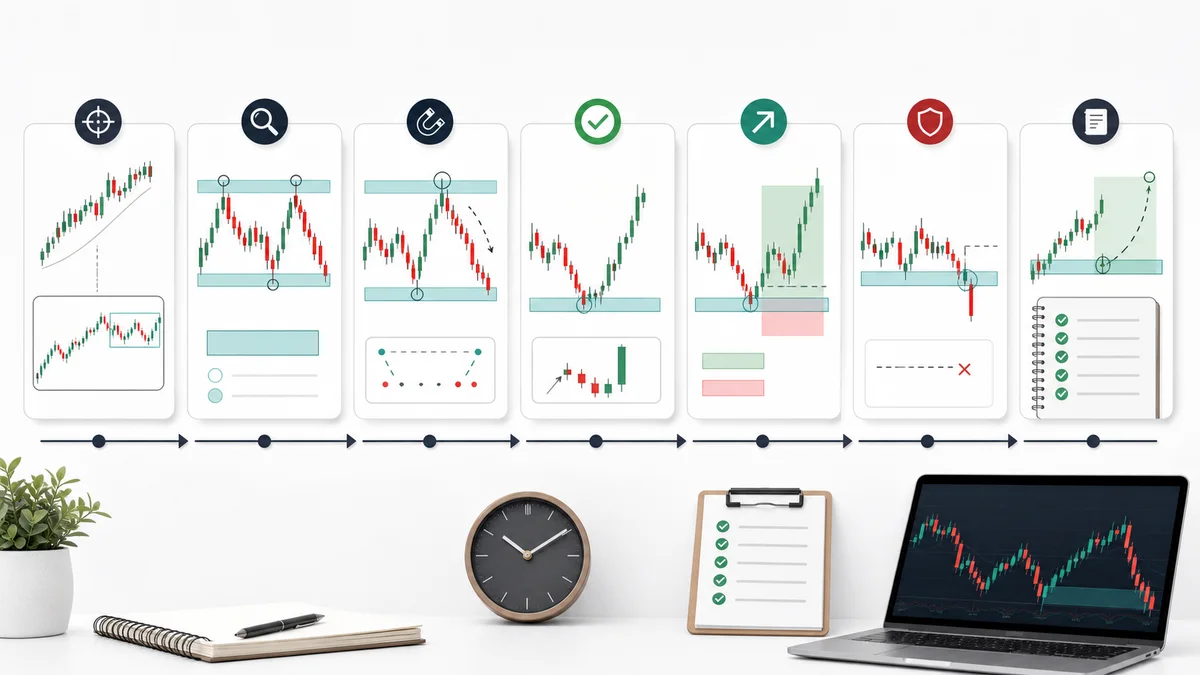
Step one is context. Decide whether the market is trending, ranging, reversing, or approaching a major higher-timeframe zone. Equal highs inside a strong uptrend may break and continue. Equal highs at a higher-timeframe premium area may be more likely to sweep and reject. Context stops you from treating every equal level the same way.
Step two is liquidity mapping. Choose the active level price is approaching now. If price is moving toward equal highs, mark the buy-side liquidity above them. If price is moving toward equal lows, mark the sell-side liquidity below them. Avoid marking every minor high and low because too many levels make decision-making worse.
Step three is the interaction. Wait for price to reach the level. Do not enter only because price is near equal highs or equal lows. Watch whether price sweeps, breaks and accepts, rejects before reaching the level, or chops through it. Each behavior tells a different story.
Step four is confirmation. After a bearish sweep above equal highs, a trader may wait for a close back below the zone, bearish displacement, a lower-timeframe break of structure, or a failed retest. After a bullish sweep below equal lows, a trader may wait for a reclaim, bullish displacement, a break of a short-term high, or a clean retest.
Step five is risk planning. Invalidation must be connected to the idea. If the trade depends on a sweep high holding, strong acceptance above that high can invalidate the short idea. If the trade depends on a sweep low holding, strong acceptance below that low can invalidate the long idea. Targets often use opposing liquidity, such as the other side of the range.
Confirmation Rules for Equal-Level Trades
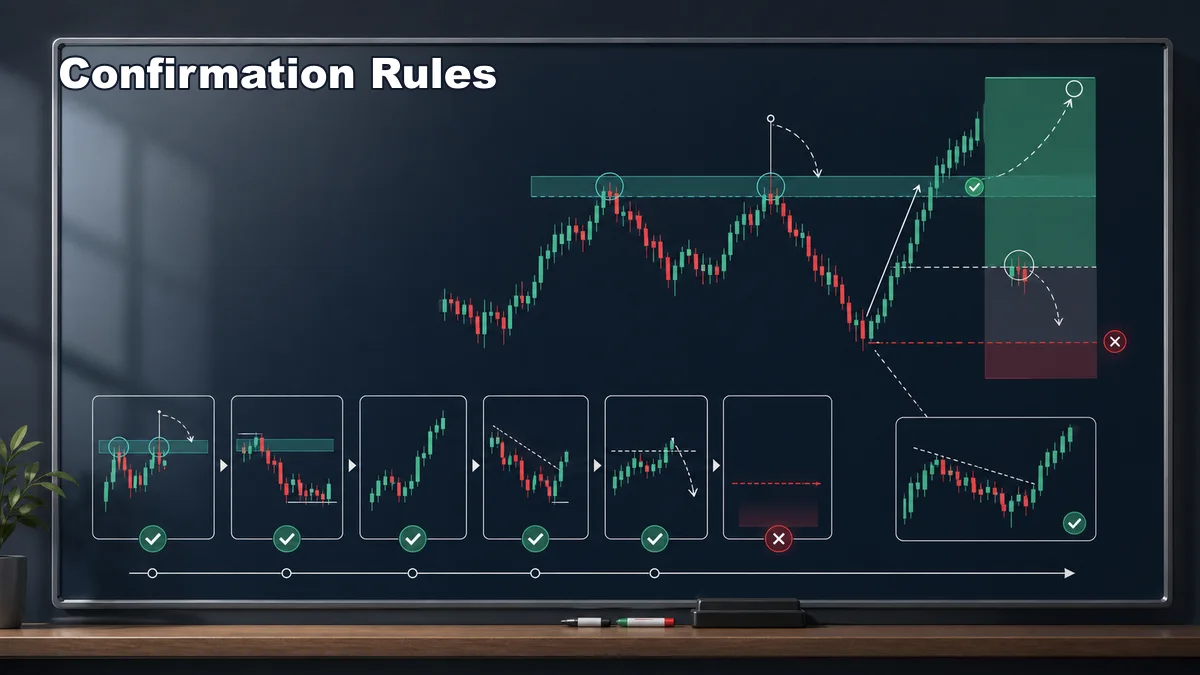
The first confirmation rule is location. Equal highs or equal lows near a meaningful support, resistance, session extreme, range boundary, or higher-timeframe point of interest deserve more attention than equal levels in the middle of noise. Location does not create a trade by itself, but it improves the quality of the question.
The second rule is reaction. A sweep needs a move through the level and a failure to accept beyond it. For a bearish idea, price should move above equal highs and then reject or close back below the zone. For a bullish idea, price should move below equal lows and then reclaim the zone. Without reaction, the move may simply be continuation.
The third rule is structure. A bearish equal-high sweep becomes more useful if price breaks a short-term low after the sweep. A bullish equal-low sweep becomes more useful if price breaks a short-term high after the sweep. Structure gives evidence that control may have shifted.
The fourth rule is displacement. Strong candles away from the swept level show urgency. Slow overlapping candles may show hesitation. Displacement can leave an imbalance or fair value gap, but the gap matters only if it fits the overall plan and provides a logical retracement area.
The fifth rule is risk. If you cannot define invalidation, skip the trade. A level can be interesting and still not be tradable. Good confirmation should make the stop, entry logic, and first target easier to explain in plain English.
Examples of Equal Highs and Equal Lows
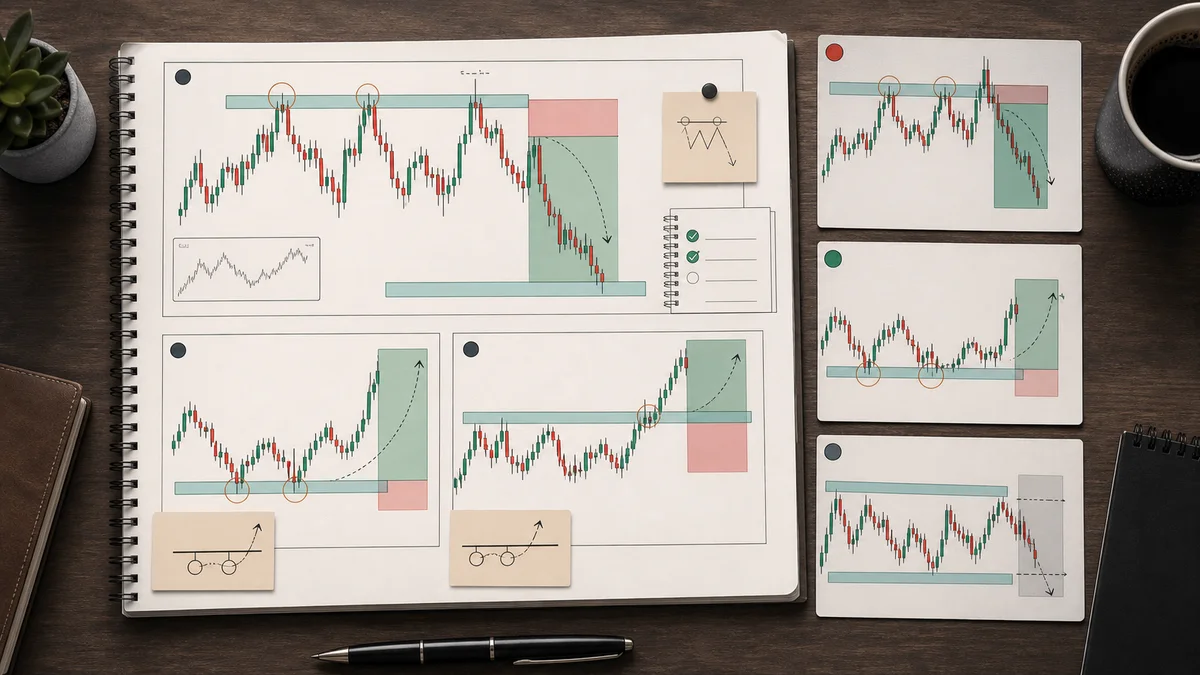
Example one: price forms equal highs near the top of a range. It trades above the highs during an active session, but the breakout fails. Price closes back inside the range, breaks a short-term low, and creates bearish displacement. A trader may view this as buy-side liquidity swept. Invalidation may sit above the sweep high, and a first target may be the range midpoint or sell-side liquidity near the range low.
Example two: price forms equal lows after a steady decline. It pushes below the lows into a higher-timeframe support zone, quickly reclaims the level, and then breaks a short-term high. A bullish trader may see this as sell-side liquidity swept. The idea still needs a planned entry, a stop connected to invalidation, and a target with enough room.
Example three: price breaks above equal highs and holds above them. It consolidates above the old resistance and retests the area as support. This is not a failed sweep. It may be breakout acceptance. A trader who automatically shorts every move above equal highs may fight a valid continuation move.
Example four: price forms equal lows inside a messy low-volume session. It dips below the lows, reclaims briefly, then returns to chop. There is no displacement, no structure shift, and no clean risk point. This is a weak example. The right decision may be to record the behavior and stand aside.
Example five: equal highs form directly below a major daily resistance zone. Price sweeps above them, fails to close above the daily zone, and then prints a lower-timeframe shift lower. This is stronger than a random intraday equal-high sweep because the liquidity event aligns with higher-timeframe location.
Common Mistakes When Trading Equal Highs and Equal Lows
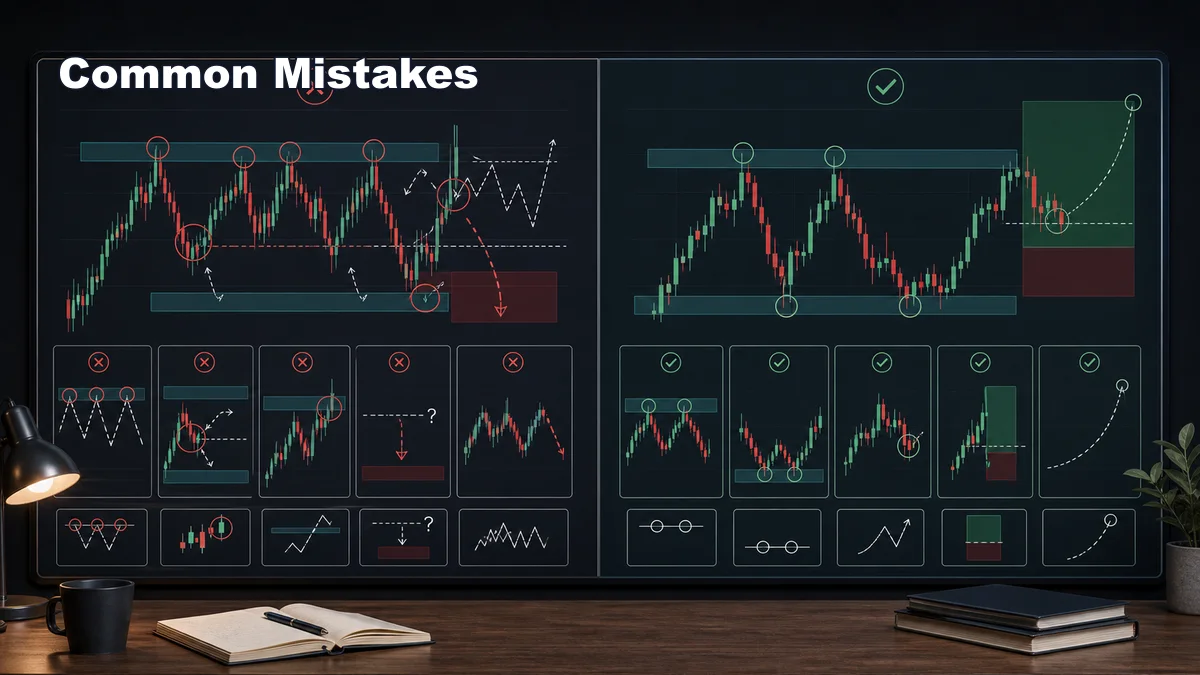
The first mistake is forcing equality. Real markets are not perfectly clean. If two highs are far apart in price or appear only after excessive zooming, the level may not be meaningful. Treat equal highs and equal lows as zones, but do not stretch every reaction into a liquidity pool.
The second mistake is entering before the reaction. Many traders short as soon as price touches equal highs or buy as soon as price touches equal lows. That can create poor entries because price may be breaking out, not sweeping. Let the market show rejection, reclaim, displacement, or structure shift first.
The third mistake is ignoring breakout acceptance. A level can attract liquidity and still break cleanly. If price holds above equal highs, builds structure there, and continues higher, the market may be accepting higher prices. If price holds below equal lows and continues lower, the market may be accepting lower prices.
The fourth mistake is using equal levels without higher-timeframe context. A five-minute equal low is more useful when it forms near a daily support or session extreme. Without context, equal levels can appear everywhere and create overtrading.
The fifth mistake is unclear risk. A trader should know exactly what invalidates the idea. If the stop is random, the position size is emotional, or the target is unclear, the trade is not ready. Equal highs and equal lows are useful only when they support a complete plan.
Read next: Continue with the Smart Money hub, the Liquidity category, and Liquidity Sweep: How to Identify Stop Hunts to connect equal-level liquidity with sweep confirmation and risk planning.
Frequently Asked Questions
Are equal highs and equal lows support and resistance?
They can act like support and resistance, but liquidity traders also treat them as areas where stops and breakout orders may collect. The reaction after price reaches the level decides whether the level is useful.
Do equal highs always cause a bearish reversal?
No. Equal highs can sweep and reverse, but they can also break and continue. Confirmation and invalidation are more important than the label.
Should I draw equal highs and equal lows as lines or zones?
Zones are usually more practical because real markets have spread, wicks, volatility, and imperfect reactions. A zone also reduces the temptation to overreact to a tiny break.