


A Wyckoff Spring is a temporary move below the support of a trading range followed by a return into the range. It tests whether meaningful supply remains near the lower boundary. A valid Spring is not defined by a lower wick alone. Traders should examine its position in the accumulation structure, the close back inside the range, the quality of the subsequent Test, and evidence of a Sign of Strength. If price accepts below support, the event is more consistent with a breakdown than a Spring.
Key takeaways
- A Spring occurs near the lower boundary of a possible accumulation range, commonly in Phase C.
- The reclaim of support matters more than the visual length of the wick.
- A Test should show reduced downside progress; it does not need to revisit the exact Spring low.
- A Sign of Strength adds evidence that demand can move price through resistance.
- Acceptance below the range invalidates the bullish Spring scenario.
Where Spring fits in the Wyckoff Method
The Wyckoff Method evaluates the relationship between price, volume, trading ranges and the apparent balance of supply and demand. In a potential accumulation, Phase A slows the prior decline, Phase B builds a cause within the range, Phase C tests remaining supply, and Phase D attempts to leave the range through a Sign of Strength and Last Point of Support. Not every accumulation contains a textbook Spring.
Read the Wyckoff Method beginner guide and Wyckoff schematics guide first if the phase model is unfamiliar. A Spring label without a credible trading range and prior context has little analytical value.
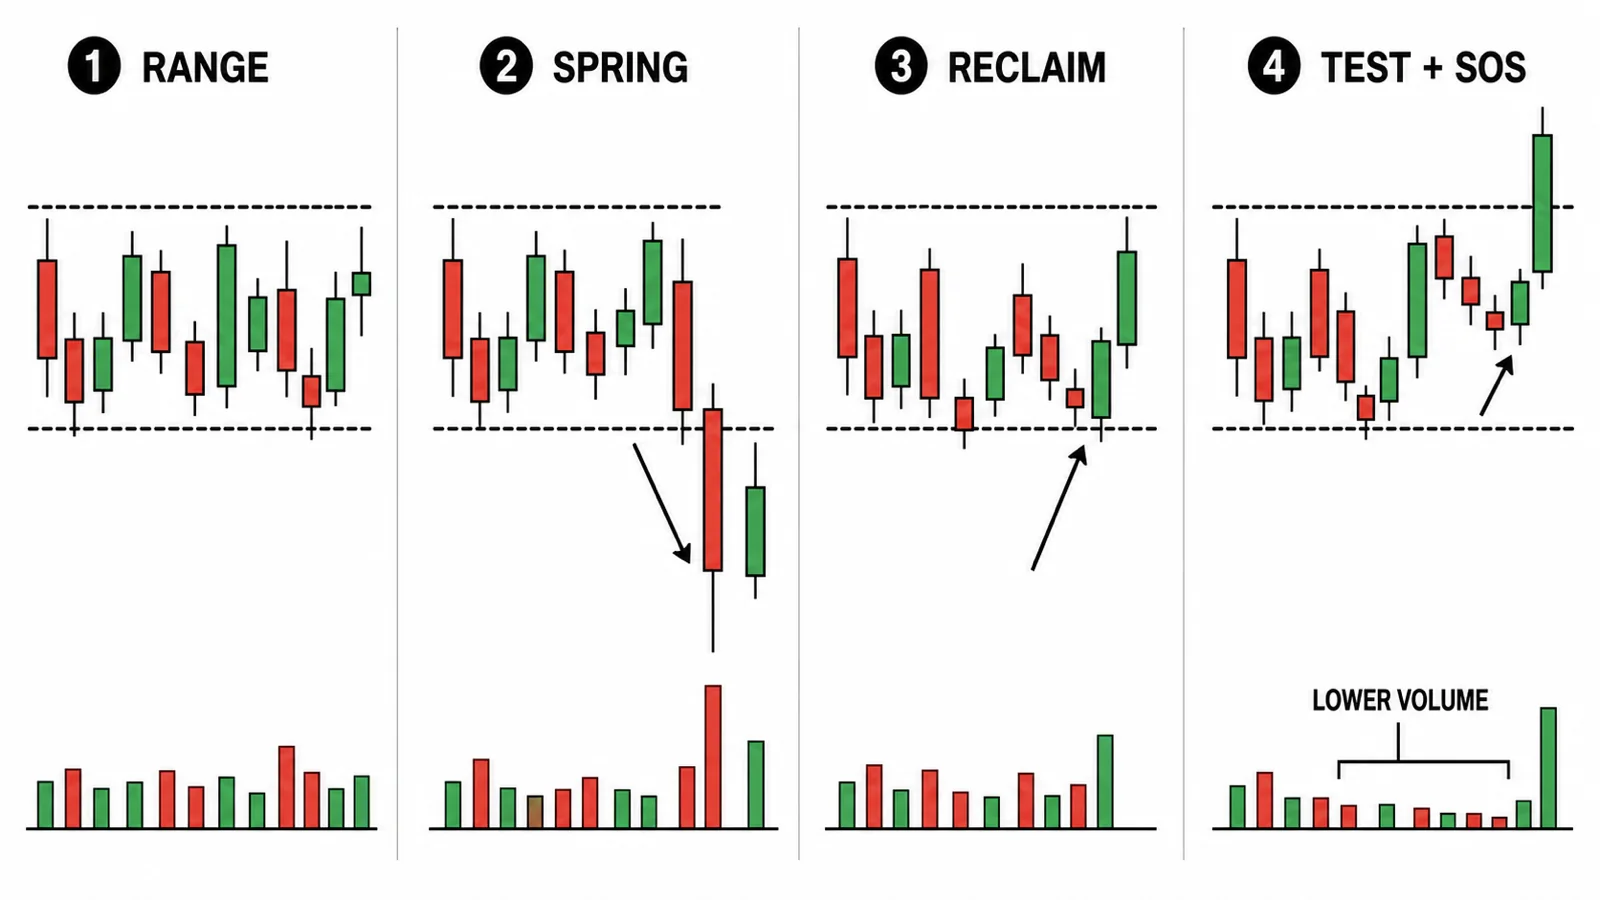
Four parts of a Spring setup
1. A defined support boundary
The market needs a visible area where previous selling was absorbed or rejected. Support should be based on several meaningful reactions, not a single precise line. A brief move below this area may reach stops and attract breakout selling, but the Wyckoff interpretation depends on what price does next.
2. The move below support
A Spring penetrates support and then fails to sustain lower prices. Depth varies. A shallow Spring may show immediate rejection, while a deeper penetration can still recover. The decisive clue is not depth by itself; it is the lack of acceptance below the range and the ability to close or move back inside.
3. The reclaim
A reclaim occurs when price returns above the broken support area and begins to hold inside the range. One close can be encouraging, but follow-through is stronger evidence. If the next candles immediately close back below support, the reclaim has failed and the Spring hypothesis should be reduced or rejected.
4. The Test
The Test revisits the lower area to evaluate whether supply has diminished. It may form a higher low, a narrow spread, reduced relative volume, or simply less downside progress. Markets do not owe traders a perfect low-volume Test. The central question is whether sellers can again drive and hold price below support.
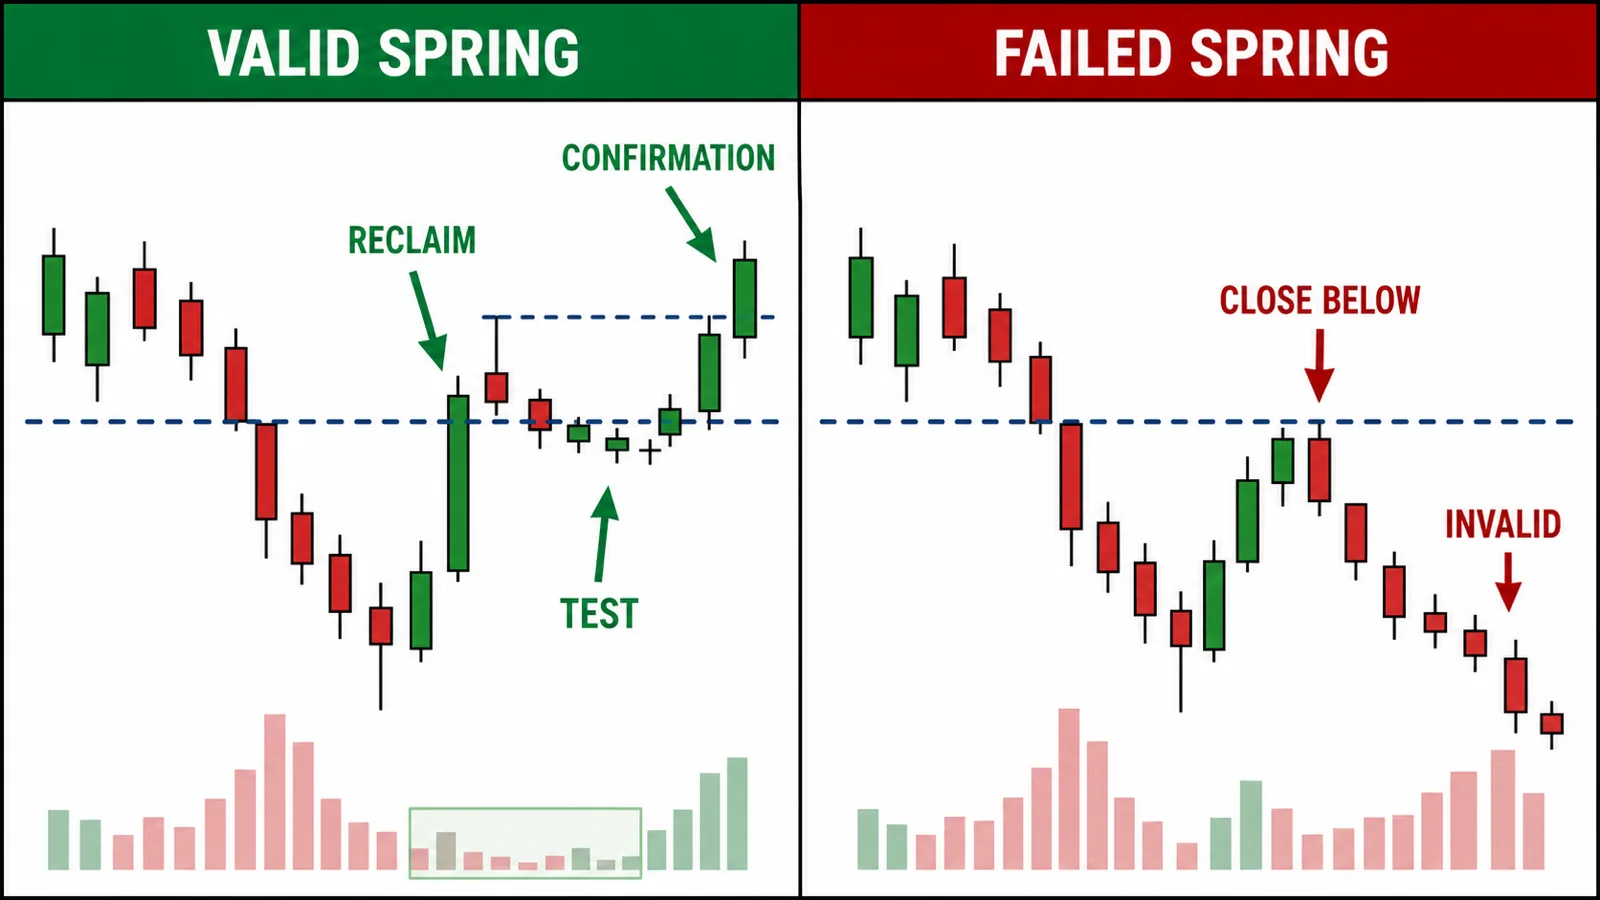
Spring versus genuine breakdown
| Observation | Spring scenario | Breakdown scenario |
|---|---|---|
| Close | Returns inside the range | Closes and holds below support |
| Retest | Reduced downside progress | Former support rejects as resistance |
| Structure | Higher low or bullish shift | Lower high and lower low |
| Follow-through | Moves toward range midpoint/resistance | Expands away from the range |
| Invalidation | Acceptance below Spring low | Reclaim and hold inside range |
How to use volume without overclaiming
Wyckoff analysis compares Effort and Result. High volume on a Spring with limited downside result can be consistent with absorption. Lower relative volume on a Test can be consistent with reduced supply. Neither observation identifies the exact participants or proves institutional buying. In decentralized Forex, tick volume represents activity from the data source rather than total global volume, so conclusions should be narrower.
A practical workflow
- Confirm the prior decline and a sufficiently developed trading range.
- Mark support as a zone using repeated reactions.
- Observe whether the penetration closes back inside the range.
- Wait for follow-through or a Test with reduced downside progress.
- Define the trigger, such as a minor structure break or demand response.
- Place invalidation where acceptance below the Spring would disprove the setup.
- Use the range midpoint, resistance or later SOS structure to evaluate targets.
Hypothetical example
Suppose gold declines into a six-week range. Price briefly trades below the established support, closes back inside, and rallies to the midpoint. The next pullback stops above the Spring low with narrower candles. Price then breaks a minor lower high and advances with wider spread. This sequence supports a Spring–Test–SOS hypothesis. If price instead closes below the Spring low for several sessions and rejects support from underneath, the bullish scenario is invalid. This example is educational, not a current recommendation.
Entry approaches and trade-offs
An aggressive trader may act after the reclaim, accepting a higher risk of another breakdown. A moderate approach waits for a Test and a local structure shift. A conservative approach waits for a Sign of Strength and a Last Point of Support, gaining confirmation but often entering farther from the low. No approach is universally best; the invalidation distance and target potential determine whether the setup is acceptable.
Use liquidity sweep concepts only as supporting language. A sweep is not automatically a Wyckoff Spring because the latter requires a larger accumulation context.
For boundary quality, compare the range with the guide to identifying support zones and the breakout-versus-fakeout checklist. The inverse Phase C behavior is covered in the Wyckoff Upthrust and UTAD guide.
Spring, shakeout and ordinary volatility
Wyckoff literature may distinguish a Spring from a deeper shakeout, but real charts rarely provide perfect labels in real time. A large move below support followed by a rapid recovery may represent a shakeout, news volatility or a failed breakdown. The practical decision remains the same: determine whether price has regained the range and whether later selling produces less result.
Volatile instruments can cross a narrow support line repeatedly. Use a zone based on closes and repeated reactions, then allow for the instrument’s normal range. If the definition of a Spring changes with every new wick, the support model is too precise or the timeframe is too low.
Applying the setup across markets and timeframes
The Spring concept can be applied to futures, equities, crypto and Forex, but volume quality and session structure differ. Daily equity volume is centralized by exchange, futures volume reflects the selected contract, and spot Forex tick volume comes from the broker or feed. Compare like with like and avoid presenting one venue’s activity as the whole market.
Higher timeframes usually provide a clearer range but require wider invalidation. Lower timeframes provide closer stops but more false penetrations. Choose the timeframe before identifying the Spring and do not switch to a smaller chart only to obtain a more convenient entry.
Common mistakes
- Buying every wick below support.
- Ignoring the prior trend and phase of the range.
- Assuming low volume is mandatory on every Test.
- Entering before price has reclaimed the range.
- Keeping the Spring label after sustained acceptance below support.
- Using a distant range high as a target without checking nearby resistance.
Risk management
A Spring can fail and become a genuine breakdown. Set risk from the invalidation logic, reduce size when the stop is wide, and avoid averaging down below a failed Spring. If the expected reward to the next meaningful resistance is insufficient, the chart may be educational but not tradable. Record whether you entered on reclaim, Test or LPS so performance can be reviewed by setup type.
Keep the initial risk constant across comparable tests. Increasing size because a Spring looks visually perfect makes review unreliable and can concentrate losses in the most convincing failures. A fixed risk framework allows the trader to compare aggressive reclaim entries with confirmed Test entries over a meaningful sample.
Do not judge the method from one outcome. A correctly identified Spring may still fail, while a poorly planned trade may win by chance. Evaluate a documented series of setups and separate pattern recognition from execution quality.
Affiliate disclosure: Học Làm Trader may receive a commission if you open an account through the XM link below. This does not increase your cost and does not affect the educational analysis in this article.
Practice the workflow with an Exness demo account before considering real-money execution. A demo result does not predict future performance.
Frequently asked questions
Does every Wyckoff accumulation have a Spring?
No. Some accumulations leave the range through strength without a clear Phase C Spring. Do not force one into every schematic.
Must the Test have lower volume?
Lower relative volume may support reduced supply, but price progress and the ability to hold inside the range are also important. Data quality differs by market.
Is a liquidity sweep the same as a Spring?
Not exactly. A Spring is a specific event within a potential Wyckoff accumulation. A liquidity sweep is a broader description that can occur in many contexts.
Sources and further reading
- Wyckoff Analytics — The Wyckoff Method
- CME Group — Technical Analysis
- CFTC — Foreign Currency Trading Advisory
Risk warning: This material is for education and general information only. It is not investment advice, a trade signal, or an invitation to trade. Trading can result in loss of capital. Past performance does not guarantee future results. Test every idea, assess your risk tolerance, and remain responsible for your decisions.
Connect this setup to the wider framework
A spring should also be compared with the site’s complete Wyckoff framework so the event is not interpreted outside its trading-range context.