


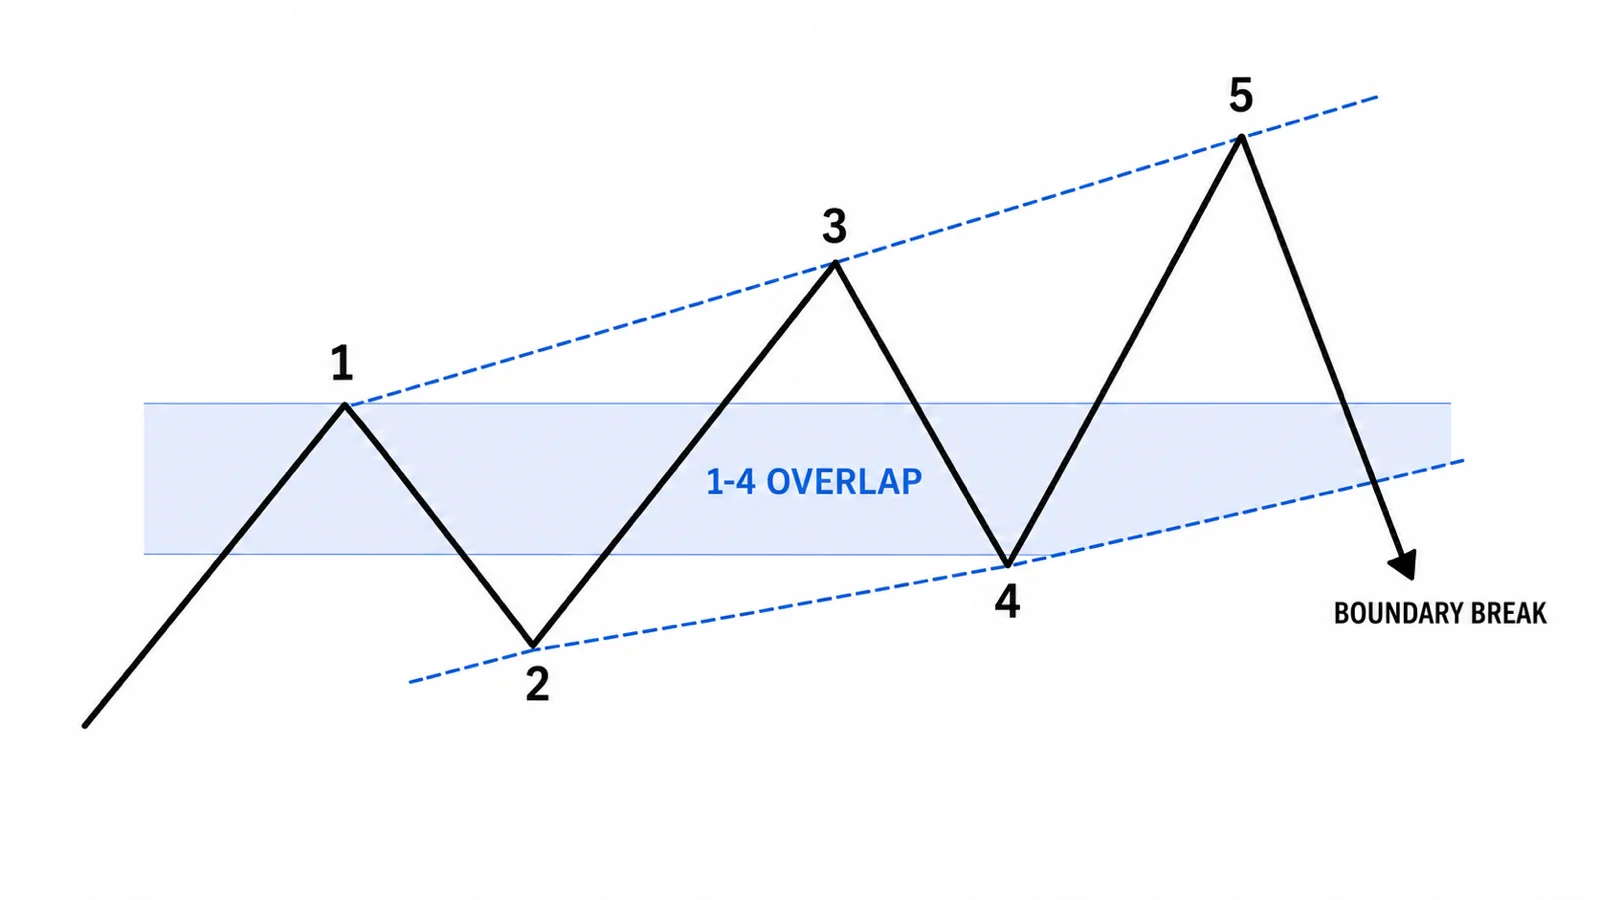
Leading and Ending Diagonals are five-wave Elliott structures that often look like wedges and allow overlap between waves 1 and 4. Their meaning depends on position. A Leading Diagonal appears at the beginning of a larger move, usually in wave 1 or wave A. An Ending Diagonal appears near the end, usually in wave 5 or wave C. The wedge shape is only a starting clue: analysts must verify five legs, internal subdivisions, boundary behavior and a clear invalidation level before using the label.
Key takeaways
- Leading Diagonals begin a larger actionary move; Ending Diagonals complete one.
- Both contain five labeled waves and commonly show wave 1–4 overlap.
- Contracting boundaries are common, but an attractive wedge is not proof of a diagonal.
- A break of the boundary has different implications depending on the diagonal position.
- Confirmation should come from price structure, not from divergence alone.
What is an Elliott Wave Diagonal?
A Diagonal is an actionary five-wave pattern in which the market behaves less cleanly than a standard impulse. Momentum may weaken, waves overlap, and the two boundary lines form a contracting or occasionally expanding shape. Diagonals can reflect a transition: either an emerging trend that has not yet developed impulse characteristics, or an exhausted trend approaching completion.
Review the Elliott Wave foundation article before using diagonals. If the larger count is unclear, the same wedge can be labeled as a correction, Triangle, ordinary channel, or Diagonal. Position within the larger sequence is therefore the first filter.
Leading Diagonal
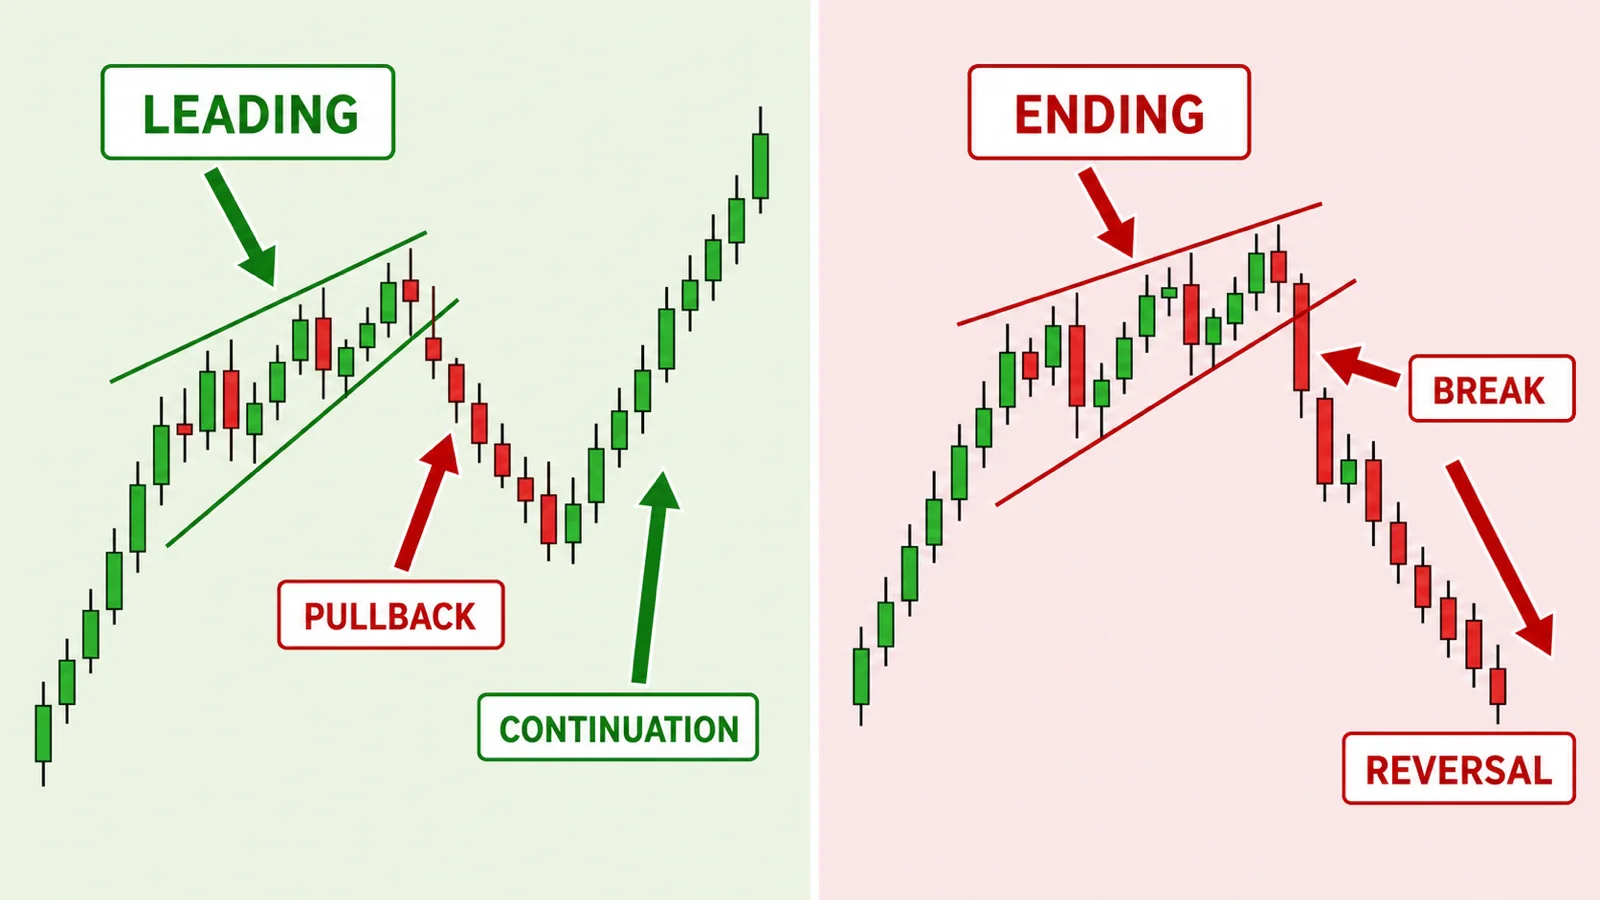
A Leading Diagonal most often appears in wave 1 of an impulse or wave A of a Zigzag. Its location implies that a larger directional move may still be developing. After the pattern completes, price often corrects part of the diagonal before continuing in the original direction. Continuation is a scenario, not a guarantee.
Leading Diagonal checklist
- The pattern occupies wave 1 or wave A in the working count.
- Five legs labeled 1-2-3-4-5 are visible.
- Wave 4 overlaps the territory of wave 1 without invalidating the origin.
- Wave 3 is not the shortest actionary wave under the chosen interpretation.
- Price breaks the boundary and later shows continuation after a corrective pullback.
Subdivision conventions for Leading Diagonals differ among Elliott practitioners. Some accept 5-3-5-3-5, while others also recognize 3-3-3-3-3 behavior in specific cases. State the convention you use and avoid presenting a disputed subdivision as universal fact. The chart should still provide a coherent five-leg sequence and a testable invalidation.
Ending Diagonal
An Ending Diagonal appears in wave 5 of an impulse or wave C of a correction. It represents a late-stage advance or decline where price continues to make progress but the structure becomes overlapping and often loses momentum. When the boundary breaks after completion, price can reverse sharply toward the origin of the diagonal. The reversal must be confirmed; selling or buying merely because a wedge has formed is premature.
Ending Diagonal checklist
- The structure occupies wave 5 or wave C in a mature sequence.
- Five overlapping legs are complete rather than only three swings.
- Boundaries generally converge and each actionary leg makes diminishing progress.
- Momentum divergence may support the count but is not required proof.
- Price exits the boundary and invalidates the last internal trend sequence.
Leading vs Ending Diagonal
| Feature | Leading Diagonal | Ending Diagonal |
|---|---|---|
| Typical position | Wave 1 or A | Wave 5 or C |
| Narrative | Trend initiation or transition | Trend exhaustion |
| Expected next phase | Correction, then possible continuation | Potential reversal of the diagonal |
| Confirmation | Pullback holds and trend resumes | Boundary break and structural reversal |
| Main risk | Mistaking a correction for trend start | Calling the top or bottom too early |
How to analyze a suspected Diagonal
- Start from the higher-degree count and identify the only positions where a Diagonal is allowed.
- Mark five completed legs without relying on micro-swings that disappear on a higher timeframe.
- Check wave 1–4 overlap, the origin of wave 1 and the relative length of wave 3.
- Draw boundaries through meaningful swing extremes; do not redraw them repeatedly to preserve the wedge.
- Define what price action would confirm continuation or reversal after completion.
- Write an alternative interpretation such as a Triangle, channel or unfinished correction.
- Plan entry only after a separate trigger and calculate size from the invalidation distance.
Hypothetical chart scenario
Suppose EUR/USD has already completed four higher-degree waves and begins a fifth advance. Price forms five rising but overlapping legs inside converging boundaries. The final leg briefly exceeds wave 3, then price closes below the lower boundary and breaks the last internal higher low. This sequence supports an Ending Diagonal interpretation. If price instead reclaims the wedge, forms a new high and holds above it, the reversal scenario is invalidated. This is an illustration, not a live trade signal.
Boundary behavior and confirmation quality
A diagonal boundary is useful only when it connects meaningful wave extremes. A contracting structure should generally show decreasing distance between the two lines. If the analyst must ignore several obvious pivots or redraw the boundary after every candle, the pattern may be an ordinary channel rather than a diagonal. Expanding volume or momentum on the boundary break can support confirmation, but price must still hold outside the pattern.
For a Leading Diagonal, confirmation quality improves when the correction after wave 5 remains above the origin and the next advance breaks the corrective structure. For an Ending Diagonal, confirmation improves when price breaks the boundary, fails to reclaim it and removes the prior internal swing. These conditions make the scenario testable without claiming certainty.
Momentum and Fibonacci: supporting evidence only
Ending Diagonals often display momentum divergence because price makes a marginal new extreme while an oscillator fails to confirm. Divergence also appears in strong trends and ranges, so it cannot identify the pattern alone. Fibonacci relationships between waves may help organize targets, but ratios vary and should not override a clear structural violation.
Use indicators to answer a narrow question, such as whether momentum is expanding or contracting. Do not collect RSI, MACD and several Fibonacci levels until one happens to agree with the preferred count. More indicators do not repair an incorrect wave position.
Diagonal, Triangle or ordinary wedge?
A Triangle is corrective and labeled A-B-C-D-E, while a Diagonal is actionary and labeled 1-2-3-4-5. Both may overlap and form converging boundaries, which makes position and internal structure essential. An ordinary chart-pattern wedge does not require Elliott subdivisions. If you cannot establish the degree and labels, describe the observable wedge and breakout conditions rather than claiming an Elliott pattern.
The chart patterns guide provides a non-Elliott framework. Comparing both approaches can prevent a trader from inventing small waves simply to satisfy a preferred count.
If the wedge is part of a larger sideways structure, compare it with the Zigzag, Flat and Triangle guide. The step-by-step process in How to Count Elliott Waves Correctly can then be used to document the primary and alternative labels.
Common mistakes
- Calling any contracting channel a Diagonal.
- Ignoring position and labeling an Ending Diagonal in wave 3.
- Treating RSI divergence as confirmation without a structure break.
- Entering before all five legs are complete.
- Moving boundaries or changing degree after invalidation.
- Assuming an Ending Diagonal guarantees an immediate full reversal.
Risk and execution
The cleanest label can still fail as a trade. Use the price level that disproves the post-diagonal scenario, then calculate position size. A Leading Diagonal continuation setup and an Ending Diagonal reversal setup have different targets and failure modes. Avoid using the same entry rule for both. When the stop is too wide relative to a realistic target, skipping the setup is a valid decision.
Before entry, save a screenshot with the five wave labels, both boundaries and the higher-degree position. After the trade, review whether the pattern was genuinely complete when the decision was made. This prevents hindsight from turning an unfinished wedge into a textbook Diagonal after price has already moved.
For execution discipline, combine the count with multi-timeframe analysis and a written risk–reward assessment.
Affiliate disclosure: Học Làm Trader may receive a commission if you open an account through the XM link below. This does not increase your cost and does not affect the educational analysis in this article.
Practice the workflow with an Exness demo account before considering real-money execution. A demo result does not predict future performance.
Frequently asked questions
Can wave 4 overlap wave 1 in a Diagonal?
Yes. Wave 1–4 overlap is a common Diagonal characteristic, unlike a standard impulse. The overlap alone is not sufficient to confirm the pattern.
Does every Ending Diagonal reverse sharply?
No. A sharp reversal is a common expectation, not a certainty. Wait for the boundary break and a structural trigger, then maintain an invalidation plan.
Can a Diagonal expand instead of contract?
Expanding Diagonals are recognized by some Elliott frameworks but are less common and easier to force. Apply stricter evidence and keep an alternative count.
Sources and further reading
- Elliott Wave International — Waveopedia
- CME Group — Technical Analysis
- CFTC — Foreign Currency Trading Advisory
Risk warning: This material is for education and general information only. It is not investment advice, a trade signal, or an invitation to trade. Trading can result in loss of capital. Past performance does not guarantee future results. Test every idea, assess your risk tolerance, and remain responsible for your decisions.