


A Donchian Channel plots the highest high and lowest low over a selected lookback, often 20 periods. The middle line is commonly the average of those boundaries. A breakout method waits for price to exceed or close beyond the upper channel for a bullish condition, or below the lower channel for a bearish condition. The indicator does not predict whether the breakout will continue. Range conditions can create repeated false breaks, while delayed exits can return open profit. A usable strategy therefore needs exact close rules, trend filters, invalidation, exit logic, costs, and a backtest across different market states.
Key takeaways
- The upper and lower lines are rolling extremes.
- A wick and a candle close are different breakout definitions.
- Trend-following systems accept many small failures to capture occasional sustained moves.
- Entry, stop, and exit lookbacks must be tested together.
- Changing the period changes signal frequency and noise.
How Donchian Channels are calculated
For a 20-period channel, the upper boundary is the highest high of the lookback and the lower boundary is the lowest low. The middle line is often (upper + lower) / 2. Because the boundaries update only when a new extreme enters the window or an old extreme leaves it, the channel forms visible steps.
Richard Donchian is closely associated with trend following, but the indicator itself is only a calculation. Study it within the technical-indicators framework and the market-structure guide rather than presenting one default period as universally optimal.
A shorter lookback reacts faster and produces more signals; a longer lookback reacts slower and may filter smaller moves. Neither setting is automatically better. Instrument, timeframe, costs, and execution constraints determine whether a rule is practical.
Close, hold and retest definitions
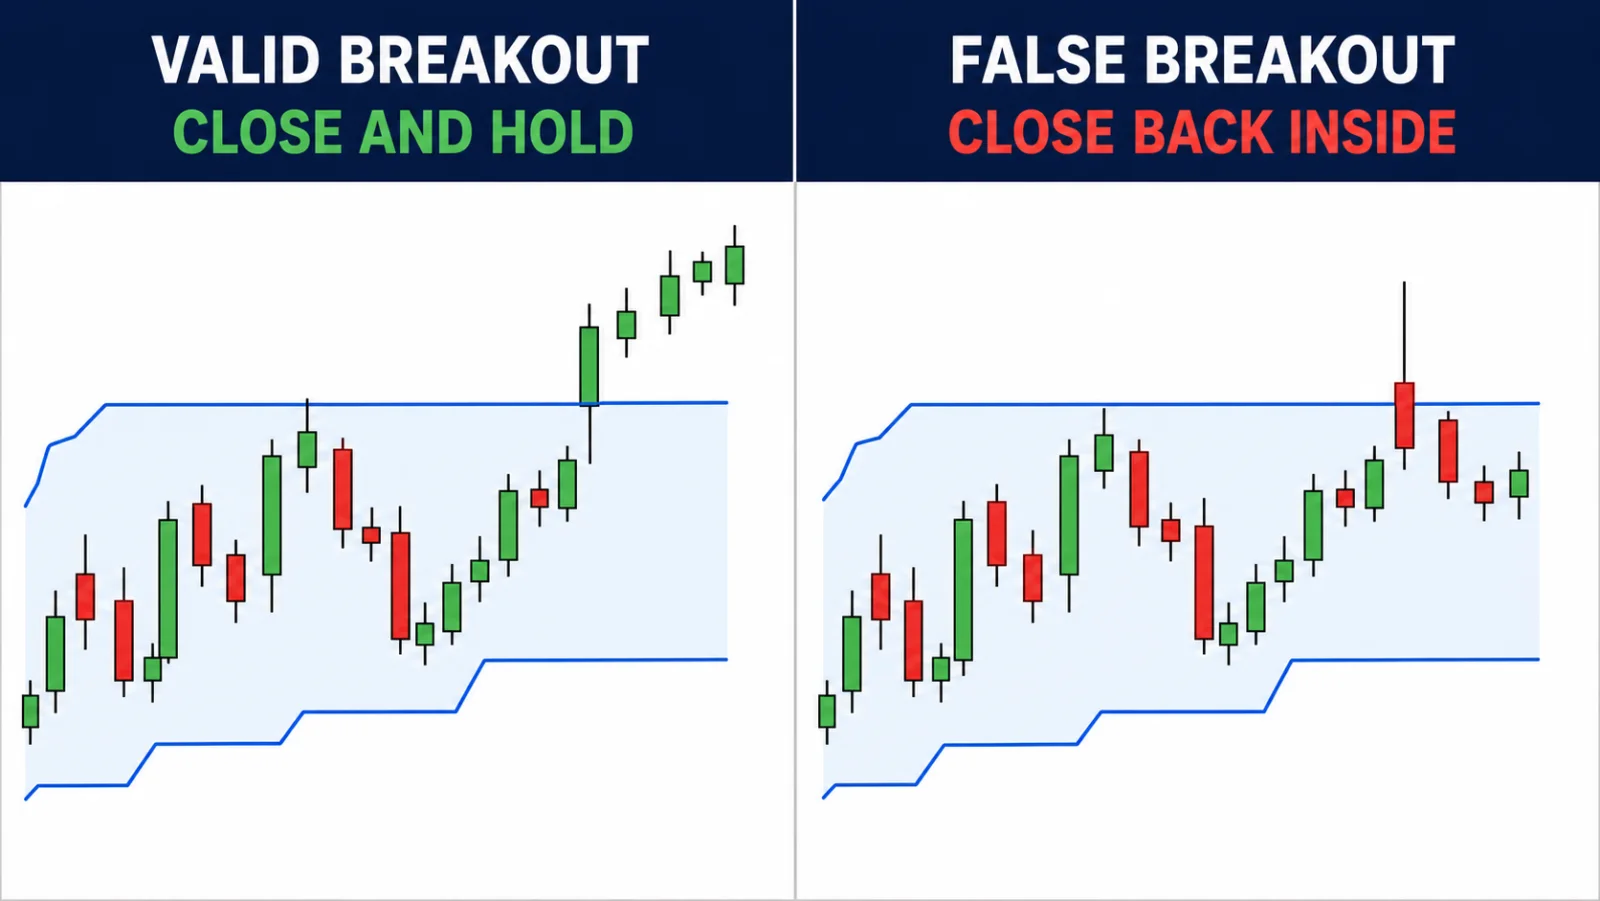
The simplest rule can trigger when price trades beyond a channel. A stricter rule requires the candle body to close beyond it. Another waits for the new side to hold or for a retest. Each version produces a different strategy and must have separate statistics.
A wick beyond the upper boundary followed by a close inside shows that the breakout was not accepted under a close-based rule. It is not automatically a short signal. Review the breakout and fakeout checklist for close, hold, and retest logic.
Confirmation reduces some false signals but enters later and can miss fast trends. The trade-off should be measured through expectancy, maximum adverse excursion, missed moves, and execution difficulty—not selected from a few attractive charts.
Trend filters and exit logic
A Donchian breakout is easier to interpret when the higher timeframe already shows aligned highs and lows, the channel is expanding, and an independent trend measure is supportive. ADX trend strength can be tested as a filter, but it also lags and may remove early winners.
Exit rules are part of the same system. Examples include an opposite-channel break, a shorter exit channel, a moving-average close, or structural invalidation. A tight exit reduces giveback but may cut trends early; a wide exit tolerates more fluctuation and larger open-profit drawdown.
Avoid choosing an entry rule from one source and an exit that looks best on the same historical sample. Define the full model, then test it on unseen data.
A step-by-step reading workflow
- Choose the channel lookback and bar-close rule.
- Define the higher-timeframe trend or range filter.
- Wait for a completed close beyond the chosen boundary.
- Apply the hold or retest rule if required.
- Mark structural invalidation before entry.
- Select the exit channel or exit event.
- Calculate position size from stop distance.
- Record slippage, gaps, missed entries, and every false break.
Donchian breakout rule choices
| Decision | Faster rule | Stricter rule | Trade-off |
|---|---|---|---|
| Entry | Intrabar break | Candle close | Speed versus false breaks |
| Confirmation | No retest | Hold or retest | Earlier price versus evidence |
| Filter | None | Structure or ADX | More signals versus selectivity |
| Exit | Short channel | Long channel | Less giveback versus early exit |
| Lookback | Short | Long | Responsiveness versus noise |
Every combination is a separate model; do not mix outcomes.
Worked chart example
Assume a daily 20-period upper channel is 114.00. Price wicks to 114.40 but closes at 113.70. Under a close-based model, no breakout has occurred. The next candle closes at 114.20 and the following pullback remains above 114.00.
The plan may now label a confirmed close and hold. Invalidation could be a close back inside combined with a break of the confirming swing, while the exit follows a shorter lower channel. These rules are chosen before the outcome.
If price immediately closes back inside, the trade is a failed breakout. The trader accepts the predefined loss rather than widening the stop and hoping that the channel will update in favor of the position.

Why range conditions are difficult
In a range, the rolling high and low sit close to repeated rejection points. Price may briefly exceed one side, return inside, and then break the other side. A trend-following method can accumulate several losses before a sustained move appears.
Use higher-high and higher-low structure and multi-timeframe context to distinguish an expansion attempt from ordinary range noise. The filter must be objective enough for another person to apply.
If the strategy cannot tolerate the expected sequence of false breaks, it is not suitable merely because one historical trend looks impressive.
Common mistakes
- Treating a wick as a close-based breakout.
- Changing the lookback after a loss.
- Using a trend method in congestion without measuring whipsaws.
- Testing entry while ignoring exit and costs.
- Adding a filter only because it removes past losses.
- Assuming channel breakout means price is overbought and must reverse.
Write the breakout event in one sentence. If the sentence cannot be tested candle by candle, the rule is too vague.
Risk management and invalidation
Donchian boundaries are not stop-loss instructions. A close beyond the opposite channel may be too far for the allowed risk, while an arbitrary stop inside normal noise may be too tight. Define structural invalidation and the exit rule separately, then size for the more immediate loss condition.
An indicator condition does not determine position size. Define the chart condition that invalidates the setup, measure the actual distance to that point, and only then calculate exposure. The position-sizing formula and the limits of the risk–reward ratio should be applied after the technical thesis is clear. If the coherent invalidation point creates more risk than the plan allows, reduce size or skip the trade.
Spread, slippage, gaps, data-feed differences, and fast conditions can change execution. The CFTC warns that leverage amplifies both gains and losses and that OTC forex customers trade through a dealer-controlled platform rather than a live exchange. A correct chart observation can still lead to a loss, poor fill, or missed trade.
Pre-trade checklist
- Lookback and close rule are fixed.
- Trend or range condition is defined.
- The breakout candle is complete.
- Retest or hold rule is satisfied if required.
- Stop and exit rules are distinct and written.
- Costs and gap risk fit the instrument.
How to backtest without hindsight
Test the complete system across trend, range, high-volatility, and quiet periods. Count clusters of losses, not only average win rate.
- Freeze entry, filter, stop, and exit settings.
- Advance one bar at a time.
- Record every valid breakout.
- Include overnight gaps and realistic slippage.
- Measure consecutive losses and drawdown.
- Validate on unseen markets and periods.
Save a screenshot before the signal and another after the scenario is complete. Record the instrument, timeframe, settings, market state, trigger, invalidation, maximum adverse excursion, maximum favorable excursion, spread, slippage, and whether the order could realistically have been filled. Keep failed and ambiguous cases. Removing them creates survivorship bias.
Score process separately from outcome. A profitable trade taken outside the rules is poor process, while a losing trade that followed a tested plan can still be a valid sample. Use the same definitions for at least 30–50 examples before changing a rule. When parameters change, date the revision and start a separate data group.
When not to use this tool
Stand aside when the channel is narrow and repeatedly crossed, the higher timeframe is balanced, the breakout candle is abnormally extended relative to the coherent stop, or liquidity is too poor for realistic execution.
Do not chase a breakout after several bars have already moved beyond the channel. The original entry, invalidation, and reward space have changed.
Frequently asked questions
Why is 20 periods common?
It is a popular convention, not a universal optimum. The period must be tested for the instrument and timeframe.
Is a Donchian breakout overbought?
A new high can represent trend strength. The label does not by itself predict reversal.
Should I wait for a retest?
A retest provides more evidence but can enter later or miss the move. Test it as a separate model.
Can Donchian Channels be used for exits?
Yes. An opposite or shorter channel can define an exit, but it should be tested with the entry rule.
Conclusion
Donchian Channels turn rolling extremes into objective boundaries. The value comes from a complete, consistent model—close rule, context, invalidation, exit, costs, and acceptance of false breakouts.
Sources and limitations
- TradingView — Donchian Channels, accessed August 2, 2026.
- CME Group — Technical Analysis, accessed August 2, 2026.
- CFTC — Eight Things You Should Know Before Trading Forex, accessed August 2, 2026.
Indicator documentation explains the calculation. It does not establish that a particular lookback, filter, or breakout rule will be profitable.
Affiliate disclosure: If you need a practice environment, you may review an Exness demo account. This is a sponsored affiliate link, and Học Làm Trader may receive a commission if you register. The link is not a recommendation to open an account. Check costs, product terms, legal availability in your jurisdiction, and suitability before using any service.
Risk warning: This article is for education and general information only. It is not investment advice, a trade signal, or an invitation to trade. Indicators summarize historical price or volume data and can produce late, conflicting, or false signals. Leveraged trading can cause rapid losses, and past performance does not guarantee future results. Test every rule independently, include realistic costs, assess your ability to bear loss, and take responsibility for your decisions.