


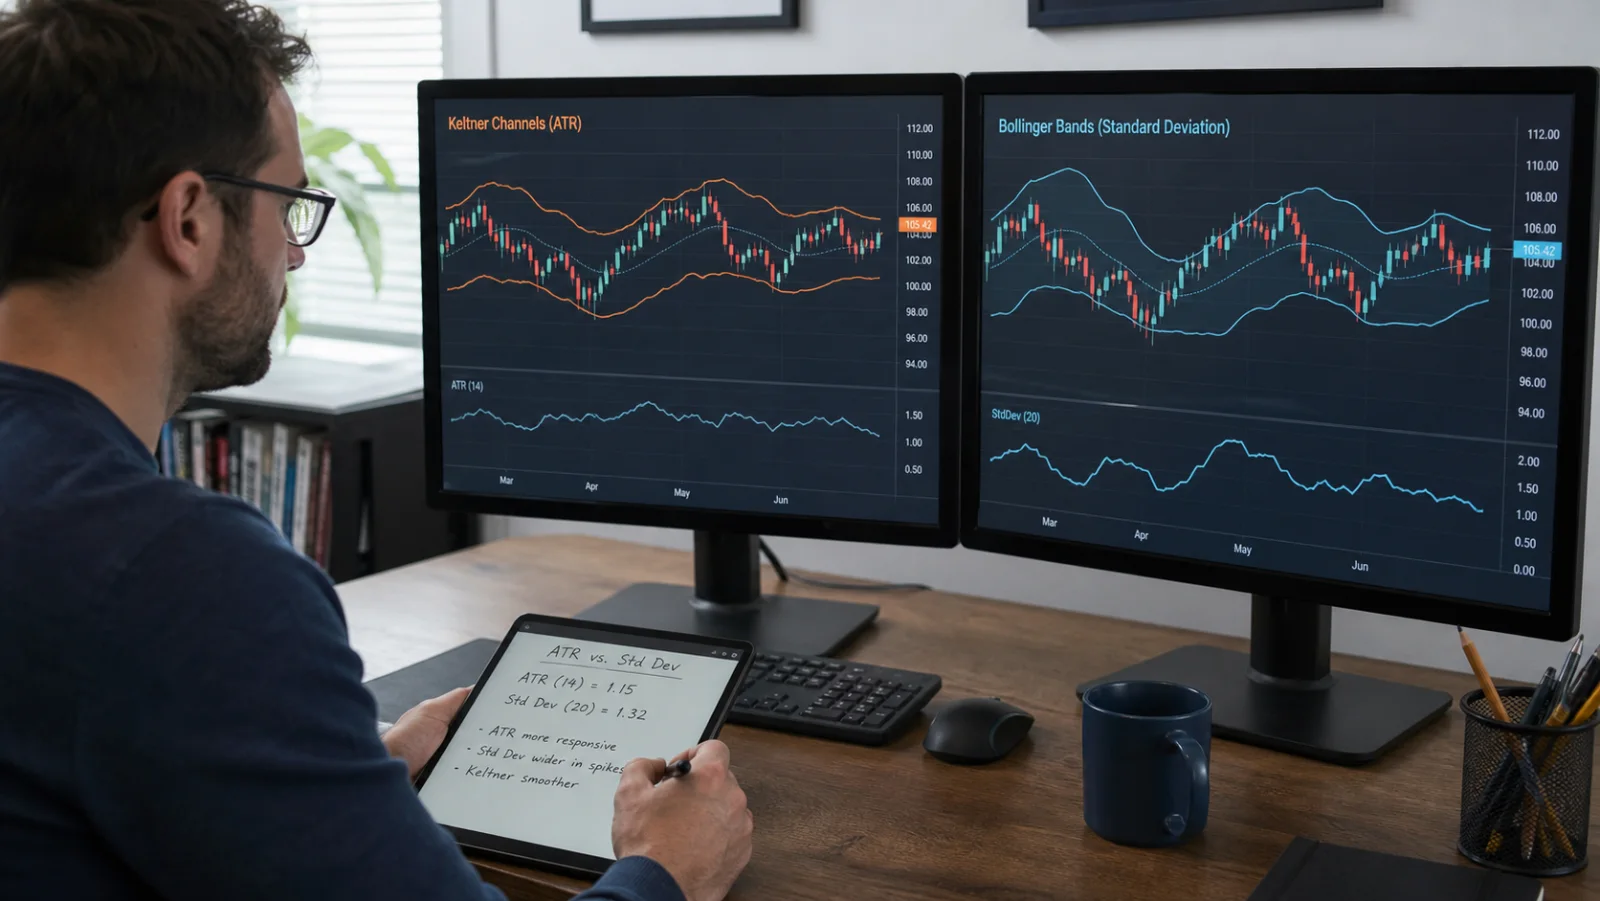
Keltner Channels and Bollinger Bands are volatility envelopes, but they measure volatility differently. A common modern Keltner Channel uses an EMA center line with bands placed a multiple of Average True Range (ATR) above and below it. Bollinger Bands commonly use an SMA center line with bands based on standard deviation. Keltner envelopes are often smoother; Bollinger Bands can expand more sharply when price dispersion increases. Neither tool identifies direction by itself. Outer-band touches may show trend strength or range extension, depending on structure, slope, and market state.
Key takeaways
- Keltner width commonly uses ATR; Bollinger width uses standard deviation.
- The center-line average may also differ.
- Outer-band touches can mean strength in a trend.
- Mean reversion is more plausible in a defined range, not guaranteed.
- A Bollinger-inside-Keltner squeeze is a volatility condition, not a direction forecast.
Formula differences that matter
A common modern Keltner setup uses a 20-period EMA plus and minus two ATR. Bollinger Bands commonly use a 20-period SMA plus and minus two standard deviations. Platforms may offer different sources, lengths, multipliers, and band styles, so confirm the exact implementation.
ATR measures true range and includes gaps; standard deviation measures dispersion around an average. They react differently to the same sequence. Review the Bollinger Bands guide and moving-average guide before comparing signals.
The fact that Keltner is often smoother does not make it more accurate. It simply produces a different envelope. A strategy must define why that response matches the intended market behavior.
Trend band rides versus range rotation
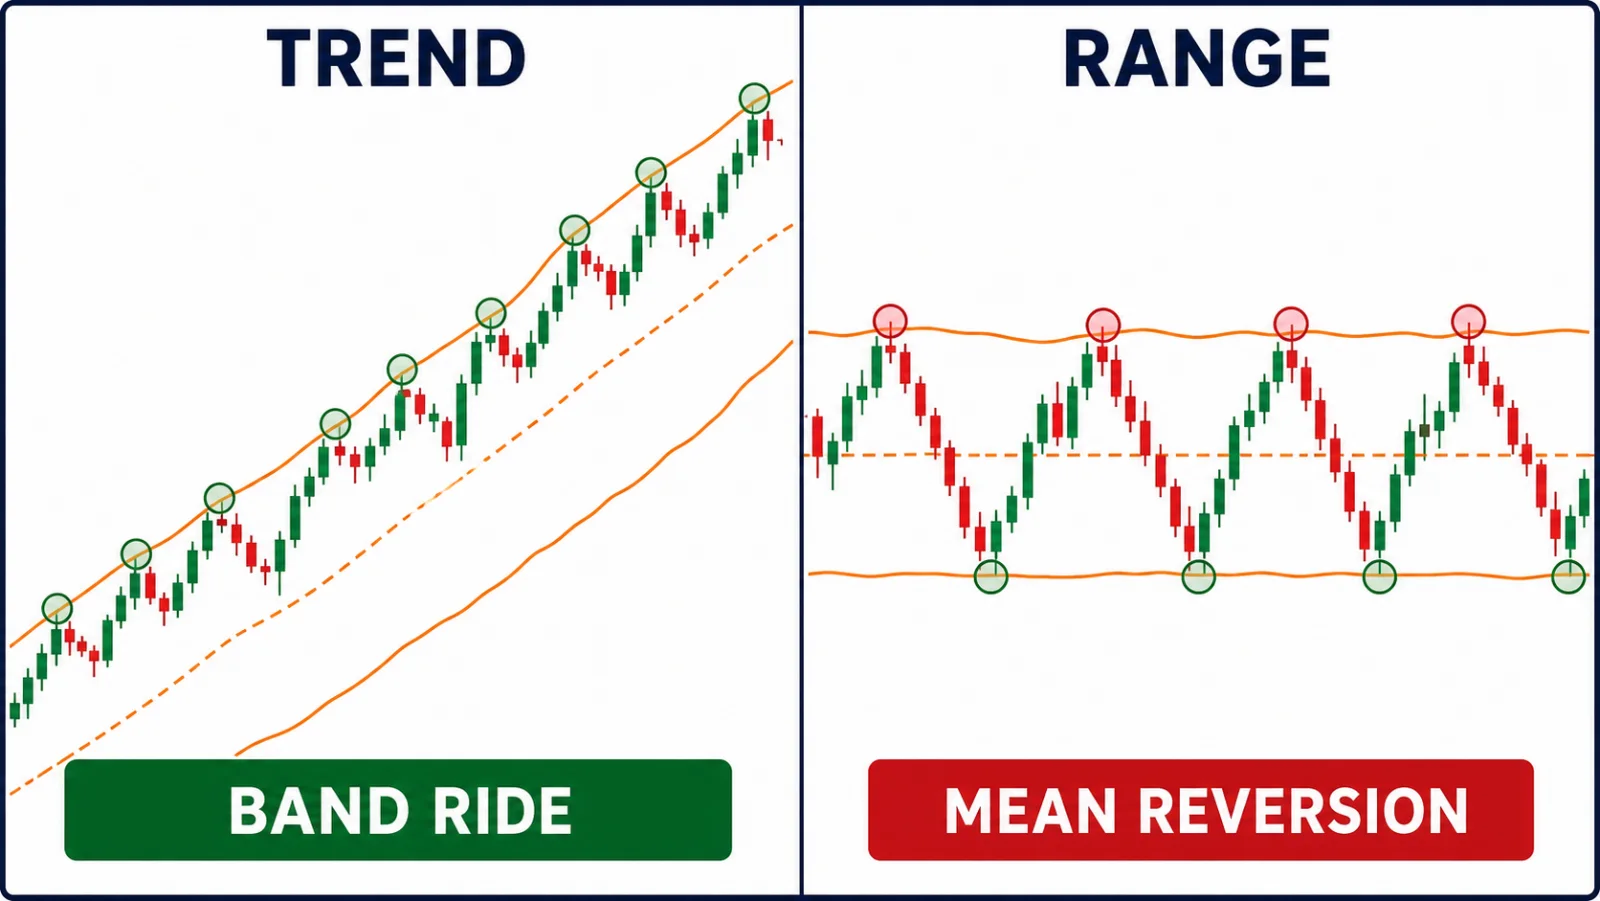
During a strong uptrend, price can repeatedly touch or close above an upper envelope while pullbacks hold near the center line. Calling every upper-band touch “overbought” can lead to repeated countertrend entries. In a downtrend, repeated lower-band interaction can show the same directional strength.
In a stable range with a flat center line, outer-band rejection may support a mean-reversion hypothesis. The range boundary, candle close, and structure shift matter more than the touch alone.
Use ADX trend strength or an explicit market-structure definition to separate trend and range samples. Do not classify the state after seeing whether the trade won.
The Bollinger–Keltner squeeze
A common squeeze definition occurs when Bollinger Bands contract inside Keltner Channels. It suggests that measured dispersion is relatively compressed compared with the ATR envelope. It does not reveal which direction a later expansion will take.
Direction still needs independent evidence: a break and close, higher-timeframe structure, support or resistance, or a tested momentum rule. A squeeze can persist longer than expected and can release into a false breakout.
Compare the squeeze with the Donchian breakout workflow. The tools measure different things, but both require a completed breakout definition and invalidation rather than an anticipated move.
A step-by-step reading workflow
- Confirm each platform’s formula and defaults.
- Use the same price series and timeframe for comparison.
- Define trend, range, and squeeze before viewing outcomes.
- Read center-line slope and price structure.
- Classify the outer-band event as ride, rejection, or unresolved.
- Wait for the required close and structure trigger.
- Define invalidation outside normal noise.
- Test Keltner, Bollinger, and combined rules as separate models.
Keltner Channels and Bollinger Bands compared
| Feature | Keltner Channels | Bollinger Bands |
|---|---|---|
| Center line | Often EMA | Often SMA |
| Band width | ATR or true range | Standard deviation |
| Typical response | Smoother envelope | More reactive dispersion |
| Trend use | Band ride and pullback context | Expansion and band walk |
| Range use | Outer-band rejection | Outer-band rejection |
| Squeeze use | Reference envelope | Contracts inside Keltner |
Defaults differ by platform; always document the actual settings.
Worked chart example
Assume price forms higher highs and higher lows, the Keltner center line slopes up, and candles repeatedly close near the upper band. Bollinger Bands expand during the impulse. The evidence describes trend strength, not an automatic short.
A pullback holds above the rising center line and breaks a minor high. A trend-following plan may use that structure as activation, with invalidation below the pullback swing. The bands provide context rather than setting the stop by themselves.
Later, the center lines flatten and price rotates between stable boundaries. The same outer-band touch now belongs to a range sample. Combining those regimes in one statistic would hide the difference.
Which envelope should you choose?
Choose the tool that corresponds to a written question. Keltner Channels may suit a smoother ATR-based trend envelope. Bollinger Bands may suit analysis of changing dispersion and band expansion. Using both is reasonable only if the comparison changes a decision, such as a squeeze rule.
Avoid optimizing multipliers until historical signals look perfect. A multiplier that removes past losses may remove future winners or simply fit one volatility regime. Keep train and validation periods separate.
Both tools belong to the technical-indicators cluster; neither replaces price-action context.
Common mistakes
- Assuming every outer-band touch is overbought or oversold.
- Comparing tools with different timeframes or price sources.
- Calling a squeeze a directional prediction.
- Optimizing multipliers on the same sample used for evaluation.
- Using both envelopes when they do not change a decision.
- Ignoring center-line slope and structure.
Classify market state before interpreting the band event. The same shape can mean something different in a trend and a range.
Risk management and invalidation
Bands do not define risk automatically. Invalidation should follow the structure and scenario: failure of a center-line hold, a close back inside after a breakout, or a break of the confirming swing. A stop placed exactly on a dynamic band can move with the indicator and create inconsistent risk.
An indicator condition does not determine position size. Define the chart condition that invalidates the setup, measure the actual distance to that point, and only then calculate exposure. The position-sizing formula and the limits of the risk–reward ratio should be applied after the technical thesis is clear. If the coherent invalidation point creates more risk than the plan allows, reduce size or skip the trade.
Spread, slippage, gaps, data-feed differences, and fast conditions can change execution. The CFTC warns that leverage amplifies both gains and losses and that OTC forex customers trade through a dealer-controlled platform rather than a live exchange. A correct chart observation can still lead to a loss, poor fill, or missed trade.
Pre-trade checklist
- Formulas and settings are documented.
- Market state was classified before the outcome.
- Center-line slope agrees with the scenario.
- The outer-band event has a close-based definition.
- A squeeze has a separate directional trigger.
- Invalidation is structural, not a moving visual target.
How to backtest without hindsight
Separate trend band rides, range reversions, and squeeze releases. Pooling them creates an average that may describe none of the individual setups.
- Freeze both indicators’ settings.
- Label regime from information available at the time.
- Capture the pre-signal chart.
- Record band position, slope, close, and structure.
- Include false breaks and prolonged squeezes.
- Validate the rule on unseen volatility regimes.
Save a screenshot before the signal and another after the scenario is complete. Record the instrument, timeframe, settings, market state, trigger, invalidation, maximum adverse excursion, maximum favorable excursion, spread, slippage, and whether the order could realistically have been filled. Keep failed and ambiguous cases. Removing them creates survivorship bias.
Score process separately from outcome. A profitable trade taken outside the rules is poor process, while a losing trade that followed a tested plan can still be a valid sample. Use the same definitions for at least 30–50 examples before changing a rule. When parameters change, date the revision and start a separate data group.
When not to use this tool
Stand aside when the two envelopes conflict but the plan has no rule for the conflict, center lines are flat inside noisy overlap, or a sudden event makes the coherent stop larger than the risk limit.
Do not add a second envelope merely to confirm the first. Correlated indicators can create the appearance of confluence while repeating similar price information.
Frequently asked questions
Which is better, Keltner or Bollinger?
Neither is universally better. They use different volatility measures and must be matched to a tested question.
Does an upper-band touch mean sell?
No. In a strong uptrend it can show strength; in a range it may support a reversal hypothesis only with confirmation.
What is a Bollinger–Keltner squeeze?
It commonly describes Bollinger Bands contracting inside Keltner Channels. It is a compression condition, not a direction signal.
Can I use the default 20 and 2 settings?
They are a starting convention. Document and test settings for the instrument and timeframe.
Conclusion
Keltner Channels and Bollinger Bands differ primarily in how they calculate volatility. Use the formula difference intentionally, classify trend or range first, and require a testable trigger and structural invalidation.
Sources and limitations
- TradingView — Keltner Channels, accessed August 2, 2026.
- TradingView — Keltner Channels Strategy, accessed August 2, 2026.
- Fidelity — Keltner Bands, accessed August 2, 2026.
- CME Group — Technical Analysis, accessed August 2, 2026.
- CFTC — Eight Things You Should Know Before Trading Forex, accessed August 2, 2026.
Platform formulas can vary. Indicator documentation and examples do not establish performance or suitability for a specific person.
Affiliate disclosure: If you need a practice environment, you may review an Exness demo account. This is a sponsored affiliate link, and Học Làm Trader may receive a commission if you register. The link is not a recommendation to open an account. Check costs, product terms, legal availability in your jurisdiction, and suitability before using any service.
Risk warning: This article is for education and general information only. It is not investment advice, a trade signal, or an invitation to trade. Indicators summarize historical price or volume data and can produce late, conflicting, or false signals. Leveraged trading can cause rapid losses, and past performance does not guarantee future results. Test every rule independently, include realistic costs, assess your ability to bear loss, and take responsibility for your decisions.