


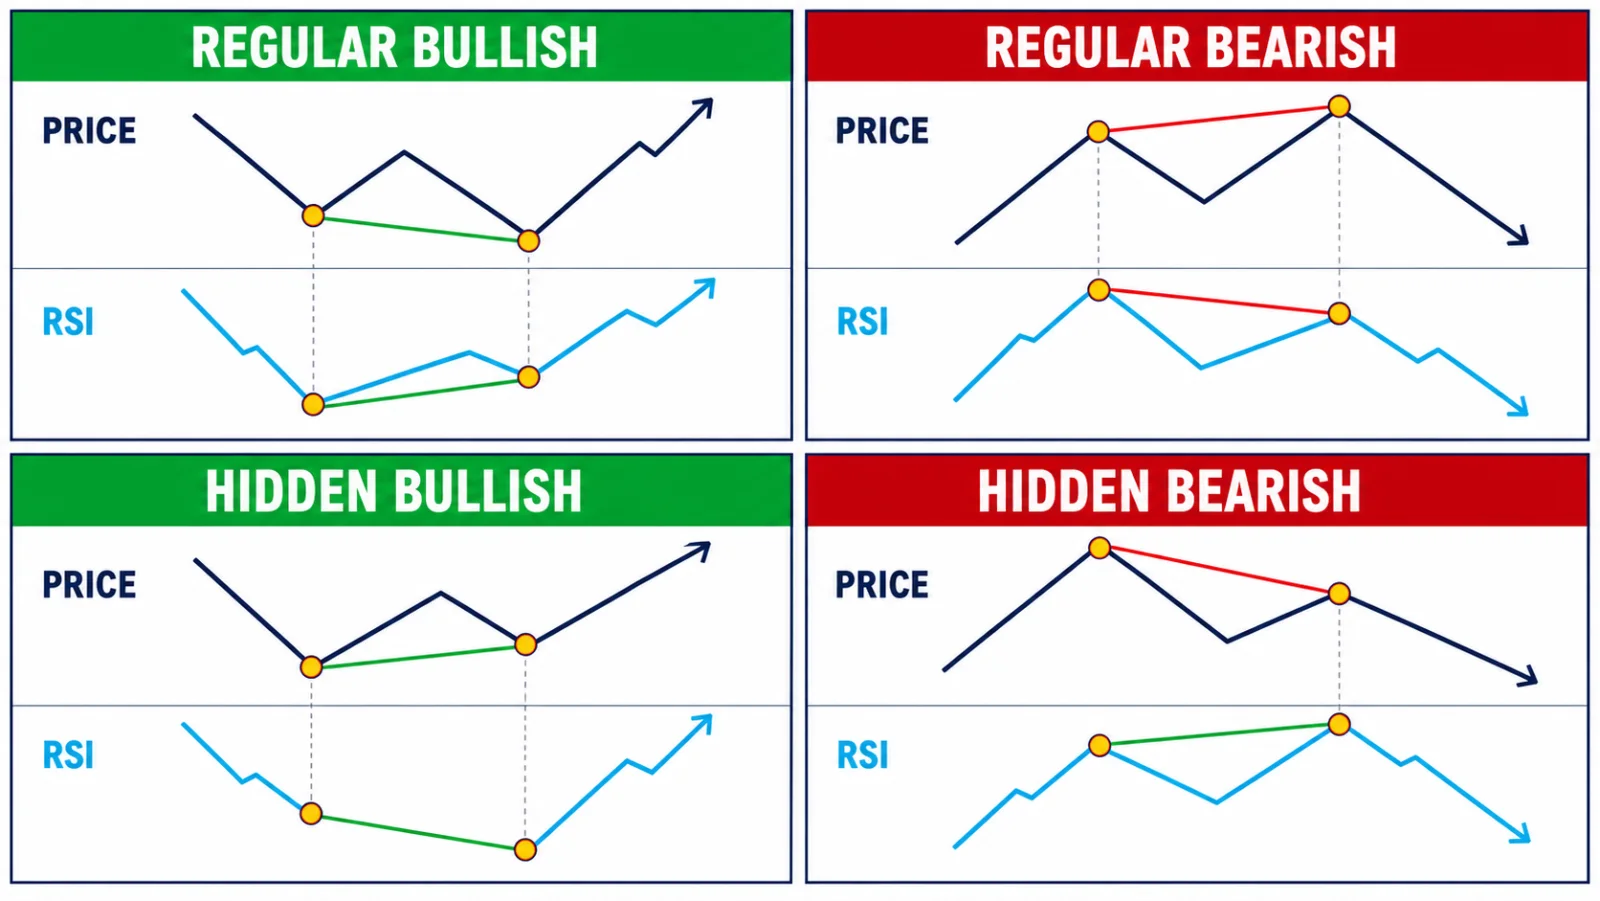
RSI divergence occurs when comparable price pivots and RSI pivots move in different directions. Regular bullish divergence is price making a lower low while RSI makes a higher low; regular bearish divergence is price making a higher high while RSI makes a lower high. Hidden bullish divergence is price making a higher low while RSI makes a lower low; hidden bearish divergence is price making a lower high while RSI makes a higher high. Regular divergence is usually treated as a reversal hypothesis, while hidden divergence is usually treated as a continuation hypothesis. Neither confirms a trade without structure, a trigger, and invalidation.
Key takeaways
- Connect comparable pivots at matching times.
- Regular divergence suggests weakening momentum, not a guaranteed reversal.
- Hidden divergence is interpreted within an existing trend.
- RSI settings and pivot rules change signal frequency.
- Wait for price confirmation instead of entering from oscillator lines alone.
Start with the RSI calculation and context
RSI is a bounded momentum oscillator commonly calculated over 14 periods. It compares average gains and losses to produce a value between 0 and 100. Overbought and oversold labels describe oscillator conditions; they do not prove that price must reverse.
Read the complete RSI guide before adding divergence. Divergence is not a separate market force; it is one way of comparing price swings with changes in calculated momentum.
Use the same source, period, timeframe, and completed candles throughout a test. Changing the RSI length can create or remove divergence. That sensitivity is a parameter issue, not proof that one version has found hidden intent.
The four divergence relationships
Regular bullish: price lower low, RSI higher low. Regular bearish: price higher high, RSI lower high. These patterns suggest that momentum did not confirm the new price extreme, so traders may watch for a reversal. Price can continue to make extremes despite divergence.
Hidden bullish: price higher low, RSI lower low. Hidden bearish: price lower high, RSI higher high. These patterns are commonly interpreted as trend-continuation hypotheses because price structure remains intact while the oscillator retraces more deeply.
The labels are meaningful only when the price pivots are structurally comparable. Review higher highs and higher lows and lower highs and lower lows before drawing oscillator lines.
How to match pivots correctly
Connect the two price highs or lows first, then inspect RSI at the same timestamps. Do not connect a price swing low with an unrelated oscillator dip several candles away. Both pivots should be visible from information available at the time.
Pivot confirmation introduces delay. A swing is only known after later candles form, so a divergence indicator that marks historical pivots can look earlier and cleaner than a live decision. Record when the signal became knowable, not where the software later drew the label.
Use multi-timeframe analysis carefully. A small M5 divergence cannot override an intact H4 trend unless the plan defines how lower-timeframe evidence changes the higher-timeframe thesis.
A step-by-step reading workflow
- Set RSI period, source, and timeframe.
- Mark confirmed price pivots without looking ahead.
- Match RSI values at the same timestamps.
- Classify regular or hidden, bullish or bearish.
- Check whether the higher-timeframe trend supports the interpretation.
- Wait for the written candle-close or structure trigger.
- Place invalidation beyond the price structure that supports the idea.
- Record when the divergence became visible in real time.
Regular and hidden RSI divergence
| Type | Price | RSI | Usual hypothesis |
|---|---|---|---|
| Regular bullish | Lower low | Higher low | Potential bullish reversal |
| Regular bearish | Higher high | Lower high | Potential bearish reversal |
| Hidden bullish | Higher low | Lower low | Potential uptrend continuation |
| Hidden bearish | Lower high | Higher high | Potential downtrend continuation |
The word potential is essential: divergence is not confirmation.
Worked chart example
Assume H1 price makes a lower low at support while RSI makes a higher low. This is regular bullish divergence. The trader does not buy immediately because the H1 sequence still contains lower highs.
Price then closes above the nearest lower high and retests it without making a new low. The structure event activates the reversal hypothesis. Invalidation remains below the low that completed the setup.
If price makes another lower low before the break, the first trigger never occurred. The trader records continued divergence rather than moving the entry or claiming that the market is “more oversold.”

Confirmation, invalidation and repeated divergence
A practical confirmation may require price to close above the nearest lower high after bullish divergence or below the nearest higher low after bearish divergence. A rejection candle can help, but the structure event makes the rule more reproducible.
Price can produce double or triple divergence while continuing in the original direction. Adding another line does not make reversal inevitable. If price has not confirmed, the condition remains an observation.
Combine divergence with candlestick context and market structure, not with several momentum oscillators that repeat similar information.
Common mistakes
- Connecting pivots from different timestamps.
- Entering before the price trigger.
- Treating regular divergence as guaranteed reversal.
- Using hidden divergence without an established trend.
- Ignoring pivot-confirmation delay and repaint-like historical labels.
- Adding MACD or another oscillator as duplicate confirmation.
Draw the price relationship first. If the price pivots are not comparable, the RSI line has no reliable structural meaning.
Risk management and invalidation
RSI does not provide a price-based stop. Invalidation belongs beyond the price structure that supports the divergence thesis. If a bullish reversal depends on a specific low holding, a confirmed break of that low invalidates the idea even if RSI still shows divergence.
An indicator condition does not determine position size. Define the chart condition that invalidates the setup, measure the actual distance to that point, and only then calculate exposure. The position-sizing formula and the limits of the risk–reward ratio should be applied after the technical thesis is clear. If the coherent invalidation point creates more risk than the plan allows, reduce size or skip the trade.
Spread, slippage, gaps, data-feed differences, and fast conditions can change execution. The CFTC warns that leverage amplifies both gains and losses and that OTC forex customers trade through a dealer-controlled platform rather than a live exchange. A correct chart observation can still lead to a loss, poor fill, or missed trade.
Pre-trade checklist
- RSI settings are fixed.
- Pivots are confirmed and time-aligned.
- The divergence type is correctly classified.
- Higher-timeframe context supports the interpretation.
- A price trigger has completed.
- Invalidation is defined from price, not oscillator level.
How to backtest without hindsight
Backtest regular and hidden divergence separately. Use a fixed pivot rule and record the bar on which each pivot and trigger became knowable.
- Freeze RSI and pivot settings.
- Hide future candles.
- Mark price pivots first.
- Match RSI at identical timestamps.
- Advance until confirmation or invalidation.
- Record repeated divergence and no-trigger cases.
- Validate on unseen trend and range samples.
Save a screenshot before the signal and another after the scenario is complete. Record the instrument, timeframe, settings, market state, trigger, invalidation, maximum adverse excursion, maximum favorable excursion, spread, slippage, and whether the order could realistically have been filled. Keep failed and ambiguous cases. Removing them creates survivorship bias.
Score process separately from outcome. A profitable trade taken outside the rules is poor process, while a losing trade that followed a tested plan can still be a valid sample. Use the same definitions for at least 30–50 examples before changing a rule. When parameters change, date the revision and start a separate data group.
When not to use this tool
Stand aside when the pivots are ambiguous, the oscillator and price points do not align, the signal forms against a strong trend without a structural trigger, or news volatility makes the coherent stop unacceptable.
Do not force divergence onto every two highs or lows. If the lines require selective pivots or different time windows to create the pattern, the observation is not reproducible.
Frequently asked questions
Is regular divergence a reversal signal?
It is a reversal hypothesis. Price structure and a trigger are still required.
What does hidden divergence mean?
It is commonly interpreted as a continuation hypothesis when price structure already shows a trend.
Does divergence work below 30 or above 70 only?
No universal rule requires those thresholds. If used as filters, they must be tested separately.
Can divergence keep forming while price continues?
Yes. Double or triple divergence can occur without a completed reversal.
Which timeframe is best?
There is no universal best timeframe. Higher timeframes may reduce noise but produce fewer and later signals.
Conclusion
RSI divergence is a structured comparison between price and momentum pivots. Match timestamps, classify the four relationships correctly, and wait for price confirmation before treating the observation as a setup.
Sources and limitations
- TradingView — Relative Strength Index, accessed August 2, 2026.
- CME Group — Technical Analysis, accessed August 2, 2026.
- CFTC — Eight Things You Should Know Before Trading Forex, accessed August 2, 2026.
RSI and divergence definitions describe an indicator relationship. They do not prove predictive value or eliminate the risk of continued trend movement.
Affiliate disclosure: If you need a practice environment, you may review an Exness demo account. This is a sponsored affiliate link, and Học Làm Trader may receive a commission if you register. The link is not a recommendation to open an account. Check costs, product terms, legal availability in your jurisdiction, and suitability before using any service.
Risk warning: This article is for education and general information only. It is not investment advice, a trade signal, or an invitation to trade. Indicators summarize historical price or volume data and can produce late, conflicting, or false signals. Leveraged trading can cause rapid losses, and past performance does not guarantee future results. Test every rule independently, include realistic costs, assess your ability to bear loss, and take responsibility for your decisions.