


Fibonacci trading tools divide a selected price swing into ratios such as 38.2%, 50%, 61.8% and 78.6%, then project possible retracement or extension areas. These levels are measurements, not automatic support, resistance, entries or profit targets. Their usefulness depends on choosing a clear swing, keeping the same anchor points and comparing the level with observable structure. This guide explains how retracements and extensions are drawn, what confluence means, where invalidation belongs and why a candle touching 61.8% is insufficient evidence for a trade.
What Is Fibonacci in Trading?
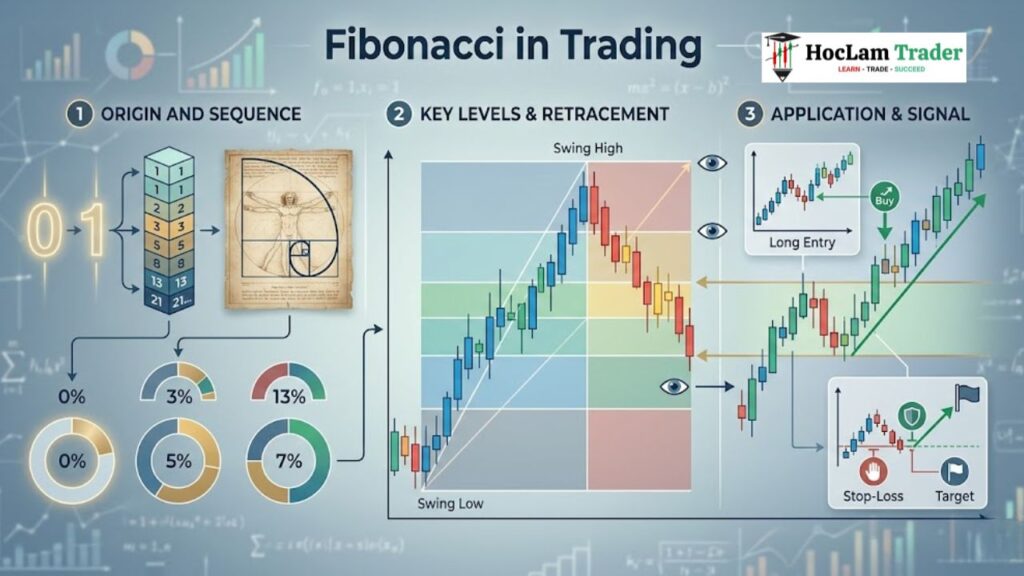
In trading, Fibonacci is a tool that applies a specific set of mathematical ratios to a price chart. These ratios mark reference levels where a trader can evaluate whether price pauses, continues or invalidates the selected swing interpretation.
Traders use the tool in two specific ways:
- Fibonacci Retracements: These measure how far a price has pulled back from the main trend. Use this to measure a pullback area.
- Fibonacci Extensions: These project how far the price might travel once the trend resumes. Use this to evaluate projection areas.
Why do traders monitor these ratios?
You don’t need a math degree to trade Fibs, but you do need to know why they show up on charts:
- Market Rhythm: Markets don’t move in straight lines; they move in waves (impulse, correction, impulse). Fibonacci ratios provide a consistent way to measure the proportions of a selected price swing; they do not prove that the swing follows a natural law.
- Self-Fulfilling Prophecy: Some market participants monitor common retracement ratios, but a price chart cannot establish how many orders are placed at a specific level. A reaction at the level must be observed rather than assumed, and the chart cannot identify the size or owner of resting orders.
When to Use Fibonacci (And When to Put It Away)
This distinction prevents the tool from being applied to price movement with no clear anchor swing.
Fibonacci retracement measures a completed swing. It answers a narrower question: “How far has price retraced relative to the selected move?” It does not determine whether continuation will occur.
Inside a tight, overlapping range, anchor selection becomes ambiguous. In that condition, range boundaries may provide a clearer measurement than multiple Fibonacci drawings.
- Clear Higher Highs / Higher Lows? Draw your Fibs.
- Choppy, overlapping candles going nowhere? Put the tool away and trade standard support/resistance (or stay out completely).
Fibonacci Retracement Levels Explained
Here is what each major level actually tells you about the market’s psychology.
- 0.382: A shallow retracement measurement. It may appear during strong directional movement, but the level does not confirm continuation.
- 0.500: The midpoint of the selected swing. It is widely displayed even though it is not a Fibonacci ratio.
- 0.618: The golden-ratio retracement. Treat it as a reference area and require price confirmation.
- 0.705–0.786: A deep retracement zone. A deeper pullback does not automatically create a better reward-to-risk profile because invalidation and target distance still depend on structure.

How to Draw Fibonacci Levels Correctly
A Fibonacci measurement depends entirely on its anchor points. Ambiguous or inconsistent anchors make results difficult to test.
Drawing in a Uptrend (Looking for a Buy)
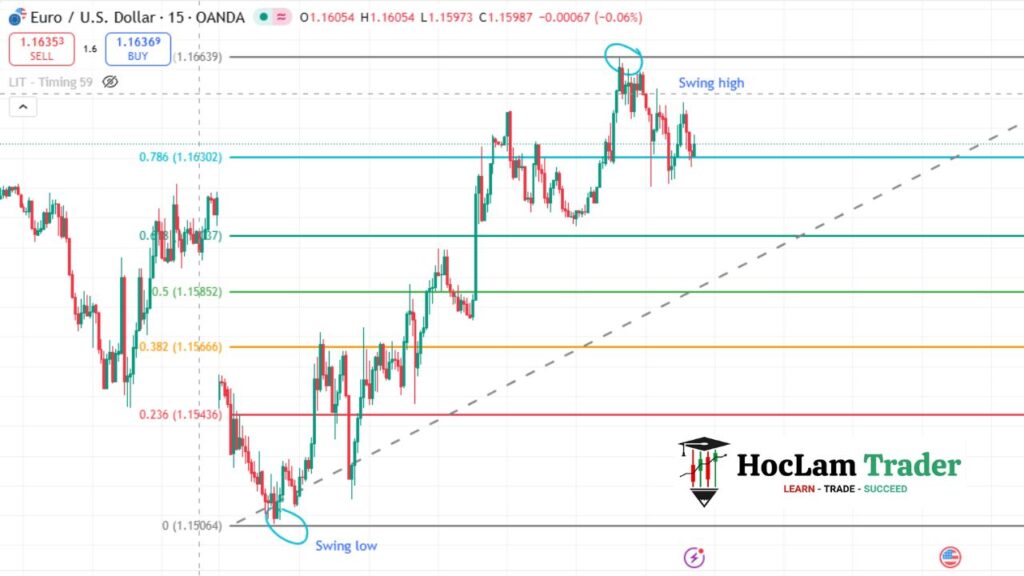
- Find the Swing Low (where the bullish impulse started).
- Find the Swing High (where the bullish impulse topped out).
- Click your Retracement tool on the Low and drag it up to the High.
- The levels will appear below the current price, showing you where to look for support.
Drawing in a Downtrend (Looking for a Sell)
- Find the Swing High (where the bearish drop started).
- Find the Swing Low (where the drop temporarily bottomed out).
- Click your Retracement tool on the High and drag it down to the Low.
- The levels will appear above the current price, showing you where to look for resistance.
Wicks record the visible swing extremes, while closes can be used to study accepted closing prices. Choose one convention before testing, document the rule and apply it consistently. Do not switch anchors after seeing the outcome.
Evaluating the 0.618–0.65 area and price triggers
Now that you have your zones drawn, you need an execution plan.
The 0.618–0.65 measurement area
This is the tight cluster between the 61.8% and 65% retracement. It is commonly monitored as a deep retracement zone. The ratio does not identify who traded there or confirm that the broader structure will continue.
Never Enter Blind (Wait for a Trigger)
A limit order placed only because price touched 0.618 has no defined confirmation condition. After price reaches a predefined retracement area, require an observable trigger rather than entering from the ratio alone:
- Candlestick Reversals: Look for a bullish hammer, an engulfing candle, or a pin bar with a long wick rejecting the Fib level.
- Lower Timeframe Shifts: If you draw your Fib on the 4-Hour chart, drop down to the 15-Minute chart when price hits your zone. Wait for the 15M structure to shift in your favor (e.g., breaking a lower high) before entering.
- Momentum Divergence: Price hits the 0.618, making a lower low, but the RSI makes a higher low. This may show that downside momentum is weakening near the measured area; price confirmation is still required.
Fibonacci Extensions: Knowing When to Take Profit
Retracements get you into the trade; Extensions get you out.
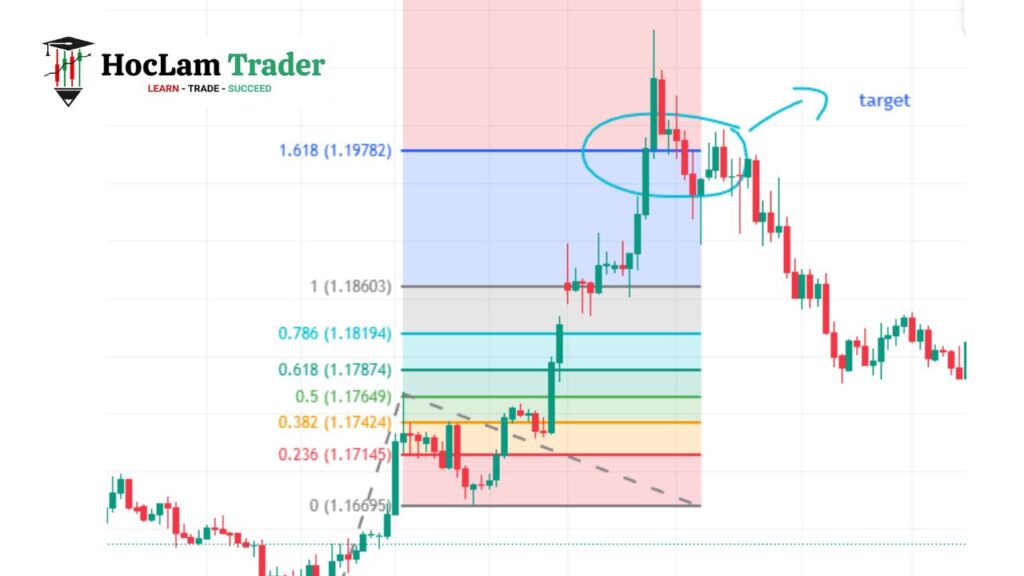
Unlike the retracement tool, the Trend-Based Fibonacci Extension tool requires three anchor points:
- Point A: The start of the impulse move.
- Point B: The end of the impulse move.
- Point C: The end of the pullback (your entry zone).
Key Target Levels:
- 1.272: Your conservative first target. This is where you should consider taking partial profits (scaling out) and moving your stop loss to breakeven.
- 1.618 (The Golden Extension): The primary target for most trend-following strategies.
- 2.618: An extreme target. Price usually hits exhaustion around this level.
The Real Edge: Fibonacci Confluence
Trading a Fibonacci level in isolation is average. Trading a Fibonacci level with confluence is how you build a real edge. Confluence means stacking multiple, independent technical reasons that all point to the same price area.
- Fib + Historical Support/Resistance: If 0.618 overlaps with a prior horizontal reaction area, document the overlap and wait for the predefined trigger. The market has a memory for horizontal levels.
- Fib + Moving Averages: When a dynamic support like the 50 EMA or 200 EMA overlaps with a Fibonacci retracement zone, the overlap creates an area that can be tested for a price response.
- Fib + Trendlines: A trendline intersecting a Fibonacci level creates an overlap to evaluate, not an independent confirmation by itself.
If several measurements overlap, define which observation provides the trigger and which price level invalidates the setup. Do not treat the number of annotations as a substitute for testing.
Risk Management: Where Does the Stop Loss Go?
- Stop placement: Place invalidation beyond the price structure that disproves the setup. A fixed pip buffer or Fibonacci ratio is not universally suitable, and a wick does not prove that a specific participant hunted stops.
- Trade Invalidation: The setup is officially dead if a candle closes firmly beyond the 1.0 level (meaning the market has retraced 100% of the impulse move). At that point, the trend is broken. Take the loss and move on. Do not widen your stop.
5 Rookie Fibonacci Mistakes to Avoid
- Measuring micro-swings: If you have to zoom in closely to find the swing, it’s irrelevant. Only use major, obvious swings that every other trader can clearly see.
- Cluttering the chart: Drawing 5 different Fibs over the top of each other creates a mess where every single price looks like support. Keep it clean: one major Fib per timeframe.
- Ignoring market structure: If the 1.618 extension target is at $150, but there is a massive weekly resistance wall at $145, take your profit at $145. Observable structure takes priority over a projected ratio in this framework.
- Trading chop: Again, do not draw Fibonacci levels in ranging, sideways markets.
- Catching falling knives: Entering without a candlestick confirmation or lower-timeframe structural shift. Let the market prove it wants to reverse before you risk your capital.
For a complete decision process, use Price Action Trading: Structure, Setups and Risk to connect the signal with structure, context and invalidation rather than reading the indicator or pattern alone.
A reproducible Fibonacci process
- Choose the timeframe and the completed impulse leg before drawing the tool.
- Record the exact swing high and swing low; do not move anchors after the outcome is known.
- Treat a ratio as an area to investigate alongside market structure.
- Use multi-timeframe analysis to avoid mixing unrelated swing degrees.
- Place invalidation beyond the price structure that disproves the setup, not a fixed number of pips from a ratio.
- Backtest each market and timeframe separately; results from one instrument do not transfer automatically.
Confluence without double counting
A Fibonacci ratio and a moving average may both be derived from the same price history. Their overlap is not necessarily two independent pieces of evidence. Stronger confluence combines different observations—for example, a clear higher-timeframe swing, a prior reaction zone and a lower-timeframe structure change—while retaining one objective invalidation level.
Sources and methodology
- Fidelity Learning Center — Technical Indicator Guide
- CME Group — MACD, RSI and Stochastics
- CFTC — Foreign Currency Trading Advisory
Practise the rules before using real capital
If you decide to practise these chart rules, start in a demo environment and record each setup before considering a live account. Open the XM account information page. Products, availability and trading conditions vary by jurisdiction; review the applicable terms and regulatory information yourself.
Affiliate disclosure: Học Làm Trader may receive a commission if you open an account through this link, at no additional cost to you. The relationship does not change the educational analysis or remove trading risk.
Risk warning: This article is for education and general information only. It is not investment advice, a trade signal, or an invitation to trade. Technical-analysis tools are based on historical market data and can fail. Trading can result in loss of capital; test rules, define invalidation, and size risk before using real money.
Related guides in this topic
- Technical Indicators Trading: A Practical Guide to Reading Markets With Clarity
- Moving Averages in Trading: SMA vs EMA, Crossovers, and Dynamic Support/Resistance
- Bollinger Bands Strategy: Squeeze, Breakout & Trend Guide