


MSNR close and open levels MSNR close and open levels use candle-body prices to construct zones while treating wicks as evidence about extremes and rejection. This is a drawing-convention article, not a general MSNR definition or a complete entry strategy. The method should be treated as a testable chart-reading framework rather than a forecast. Before using it, define the market condition, confirmation event, invalidation price, transaction costs and maximum risk. This guide explains the rules, a repeatable workflow, common failure modes and the most relevant supporting concepts.
What MSNR Close Open Levels Means in MSNR
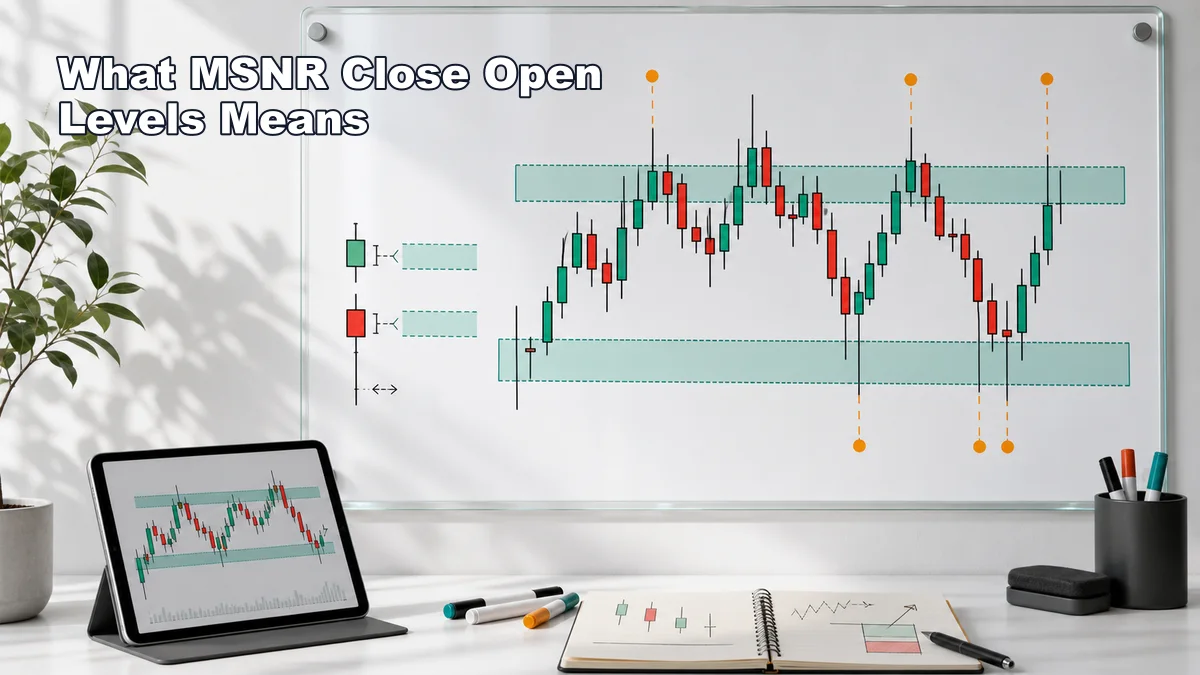
In an MSNR context, close and open levels mean the zones built around candle bodies rather than the absolute wick extremes. A candle opens at one price, moves during its life, and closes at another price. The distance between the open and close forms the body. That body is important because it shows where the market accepted the candle’s final outcome for that timeframe.
A wick tells a different story. A long upper wick may show that buyers pushed price higher but could not keep it there. A long lower wick may show that sellers pushed price lower but could not hold it there. Those are useful clues, but they are not always the cleanest place to draw the main level. If a trader anchors every support or resistance line to the most extreme wick, the level may be based on a brief spike rather than a meaningful area of agreement.
Body-based support resistance is usually drawn as a zone around clustered opens and closes. For example, if several candles repeatedly close near the same area before price moves away, that area may become a useful MSNR level. If an old resistance zone later becomes support, the opens and closes around the breakout and retest may matter more than the single highest wick that appeared during the move.
This approach is not about ignoring wick information. It is about separating the main decision area from the outer evidence. In practical chart reading, you can mark the body area as the core level and treat the wick area as the tolerance zone, rejection zone, or invalidation reference. That gives the chart structure without pretending that markets respect exact lines to the tick, pip, or cent.
A simple way to think about it is this: candle bodies show acceptance, and wicks show attempted rejection. MSNR close open levels start with acceptance because accepted prices often create cleaner support and resistance zones. Wicks still matter, but they usually need context before they become tradeable information.
Why It Matters Before Taking a Trade
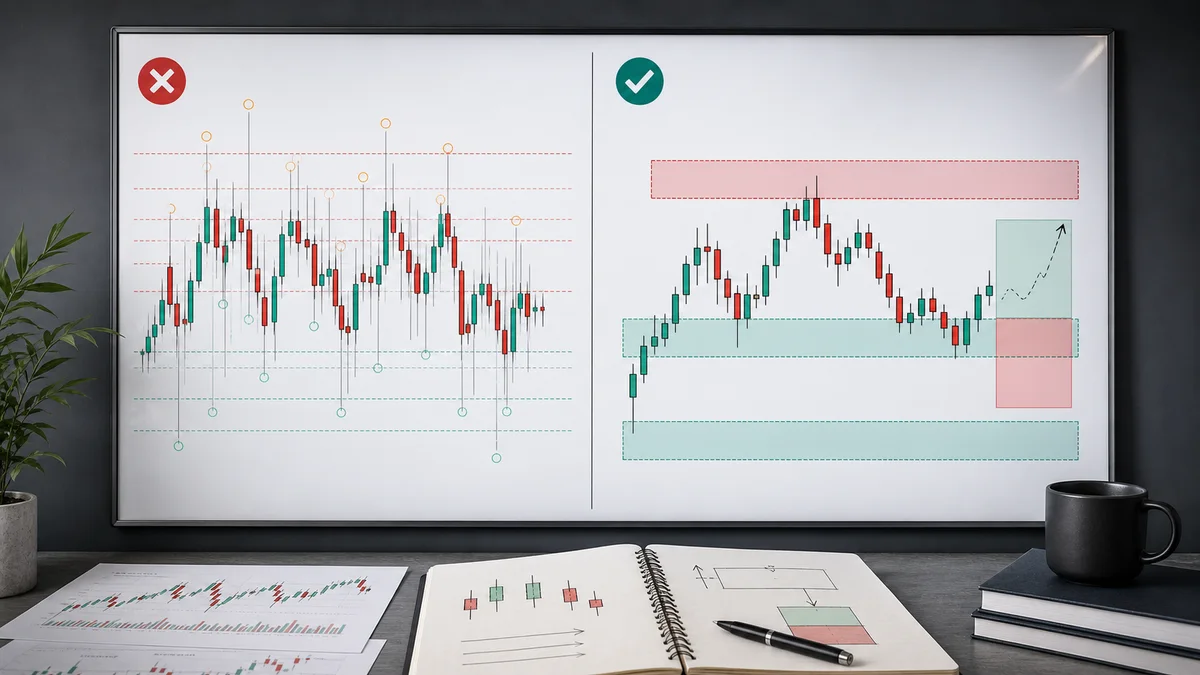
MSNR close open levels matter because many weak trades begin with poor line placement. A trader sees a wick, draws a thin line at the extreme, and then treats the next touch as a trade signal. The level looks precise, but the logic may be fragile. If the wick was only a brief stop run or low-liquidity spike, the line may not represent a strong area of market agreement.
Candle bodies can make the decision area more stable. When several opens and closes cluster around the same zone, the market is repeatedly accepting that area as important. That does not guarantee the level will hold, but it gives the trader a more reasonable place to watch for reaction. In live trading, that difference matters because the trader must decide where the idea is valid, where it is wrong, and whether the trade has enough room before the next obstacle.
Body-based levels also reduce chart clutter. If every wick becomes a level, the chart turns into a fence of horizontal lines. A beginner can then find a reason for any buy or sell idea. MSNR is more useful when the trader marks fewer, clearer zones: major swing body areas, range boundaries, breakout bodies, retest bodies, and repeated closes around support or resistance.
The method also improves risk discussion. If a long idea depends on price holding above a body-based support zone, the wick area below it may become a place to observe possible rejection or define invalidation. If a short idea depends on resistance rejecting, closes above the body-based resistance may be more important than a tiny wick above it. In other words, close and open prices can help separate normal probing from real acceptance beyond the level.
Wicks still matter before a trade, especially when they appear at obvious liquidity areas. A wick through support followed by a strong close back above the body zone may suggest rejection. A wick above resistance followed by a bearish close back below the body zone may show failed breakout pressure. But the wick becomes useful because of its relationship to the body-based level, not because every spike deserves its own trade.
For the full framework around location, reaction, and risk, read the MSNR trading strategy guide. For deeper risk planning, connect this concept with the MSNR risk management guide.
Step-by-Step Chart-Reading Workflow
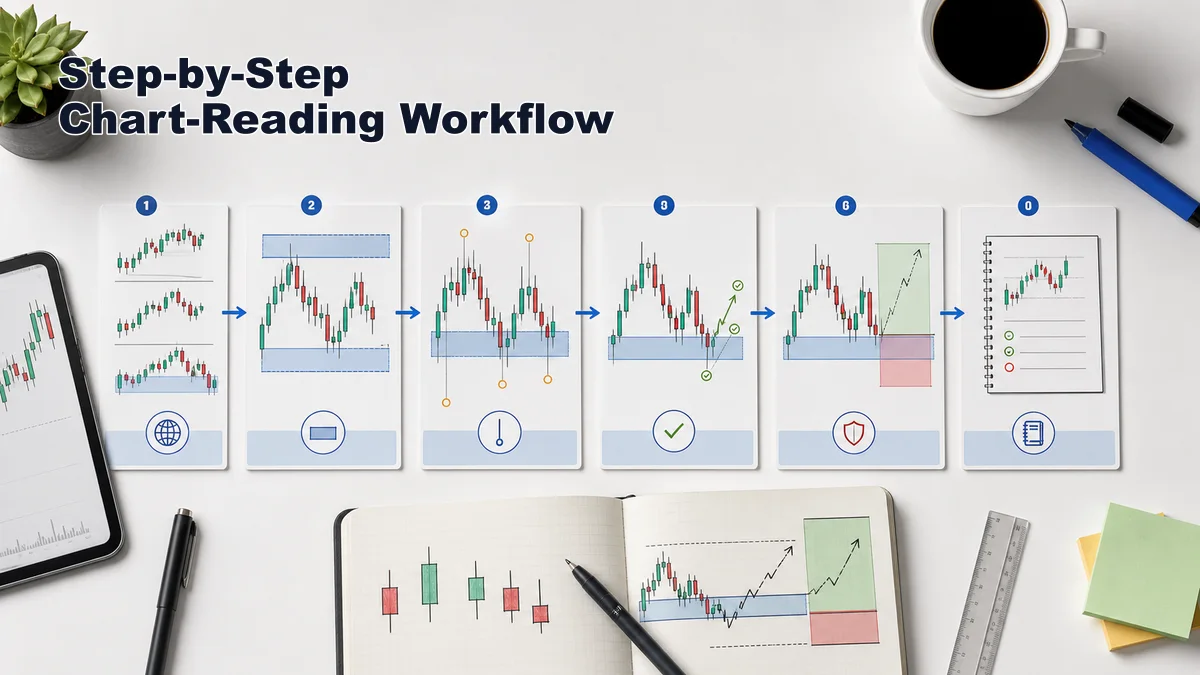
The best way to use MSNR close open levels is to follow the same chart-reading workflow every time. The goal is not to find the perfect line. The goal is to build a decision area that can be tested, reviewed, and connected to risk.
Step 1: Start With the Higher Timeframe
Begin on a higher timeframe than your entry chart. If you trade from the 15-minute chart, check the 4-hour or daily chart first. Look for major swing areas, range highs, range lows, and strong breakout zones. At this stage, mark only the most obvious areas where candle bodies repeatedly opened, closed, or shifted direction.
Step 2: Mark the Body Zone First
Instead of drawing the first line at the farthest wick, mark the area where candle bodies cluster. This may include several candle opens and closes around a prior reaction. Use a zone rather than a razor-thin line. A zone better reflects how price actually behaves, especially in forex, crypto, and index markets where spread, liquidity, and volatility can create small variations.
Step 3: Add Wick Context Second
After the body zone is clear, look at the wicks. Are they short and balanced? Are there repeated rejection wicks? Did one wick sweep a previous high or low before price closed back inside the zone? Wicks can help you understand whether the market is probing liquidity, rejecting a level, or building pressure for a breakout.
Step 4: Read the Current Approach
When price returns to the zone, study how it approaches. A slow pullback into support after an uptrend is different from a fast selloff into the same area. A weak rally into resistance is different from a strong displacement candle closing above it. The approach helps you decide whether to watch for rejection, breakout, retest, or no trade.
Step 5: Wait for Close-Based Evidence
For body-based support and resistance, closes are especially important. A wick through support with a close back above the zone may not be the same as a strong close below it. A wick above resistance with a close back under the zone may not be the same as acceptance above resistance. MSNR traders should be careful about reacting to intra-candle movement before the candle closes.
Step 6: Build the Trade Plan
Before entry, define the reason, invalidation, stop-loss area, and likely target. A clean statement may sound like this: “I am considering a long because price is at a higher-timeframe body-based support zone and has rejected the wick area with a close back above support.” Then define what would make that idea wrong. If you cannot write that sentence clearly, the setup may not be ready.
Step 7: Screenshot and Review
Save the chart before and after the trade. Mark the body zone, the wick zone, the reaction, and the result. Over time, review whether your body-based levels are too wide, too narrow, too late, or too close to random noise. That feedback is more valuable than memorizing another perfect hindsight example.
Entry, Invalidation and Stop-Loss Logic
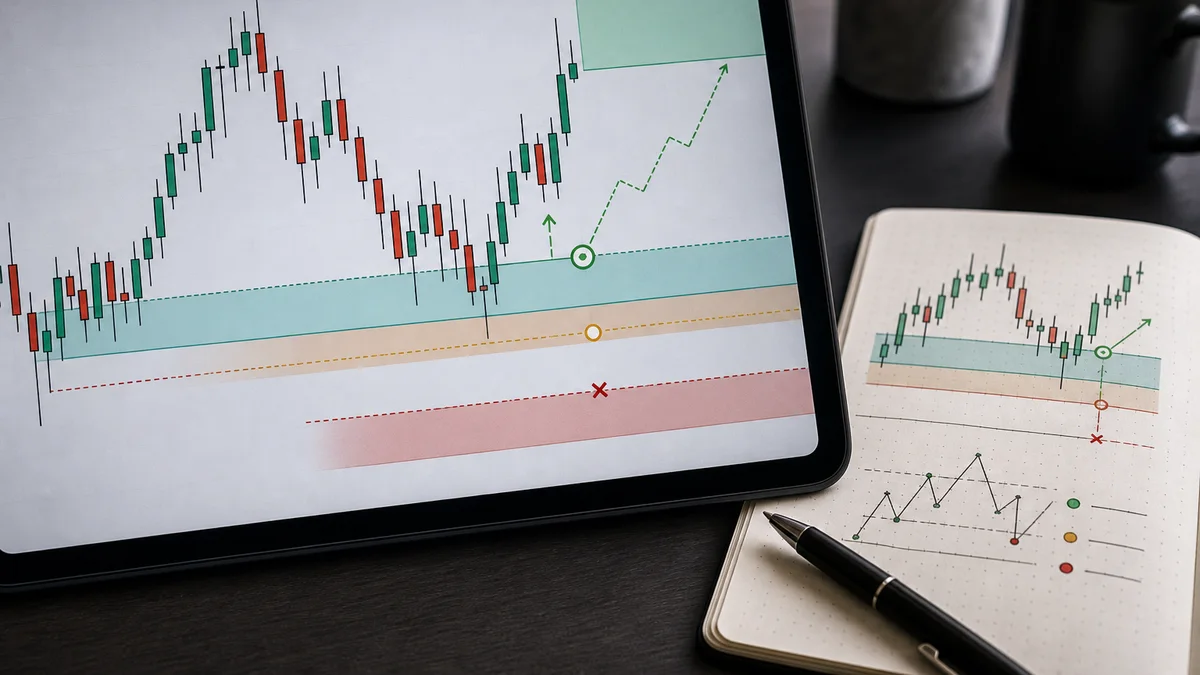
Entry should come after the level, not before it. With MSNR close open levels, the body zone defines the area of interest. The wick area provides extra context. The entry trigger comes from how price behaves when it reaches that area.
One entry style is a rejection entry. Price reaches a body-based support zone, pushes slightly into the wick area, then closes back above support with follow-through. A trader may consider that evidence that sellers attempted to break lower but failed. The opposite version can happen at resistance: price pushes above the zone, fails to close with acceptance, and returns below the body-based level.
Another entry style is a breakout-and-retest. Price closes beyond a body-based resistance zone, returns to the area, and holds it as support. In that case, the close beyond the level matters more than the wick alone. A wick above resistance without a strong close may be only a failed attempt. A body close and retest can suggest stronger acceptance, though it still needs risk control.
Invalidation should match the trade idea. If a long setup depends on the body zone holding, invalidation may be a decisive close below that zone or a break below the rejection low, depending on the timeframe and rules. If a short setup depends on resistance rejecting, invalidation may be a strong close above the zone or a hold above the wick area after retest.
Stop-loss placement should follow invalidation, not emotion. A stop placed directly inside a body zone may be too tight if the strategy expects some wick probing. A stop placed far beyond every wick may be too wide for the account risk. The trader must balance market structure with position sizing. If the logical stop makes the trade too large or the target too close, skipping the setup is a valid decision.
Targets should be based on the next meaningful area, such as the next body-based resistance for longs, the next body-based support for shorts, a range boundary, or a prior swing. A body-based entry does not remove the need to respect nearby obstacles. If the next obstacle is too close, the trade may not offer enough room after spread and fees.
A simple rule helps: use candle bodies to define the main level, use wicks to understand rejection and noise, use closes to judge acceptance, and use invalidation to decide whether the trade still belongs in your plan.
Common Mistakes and Checklist
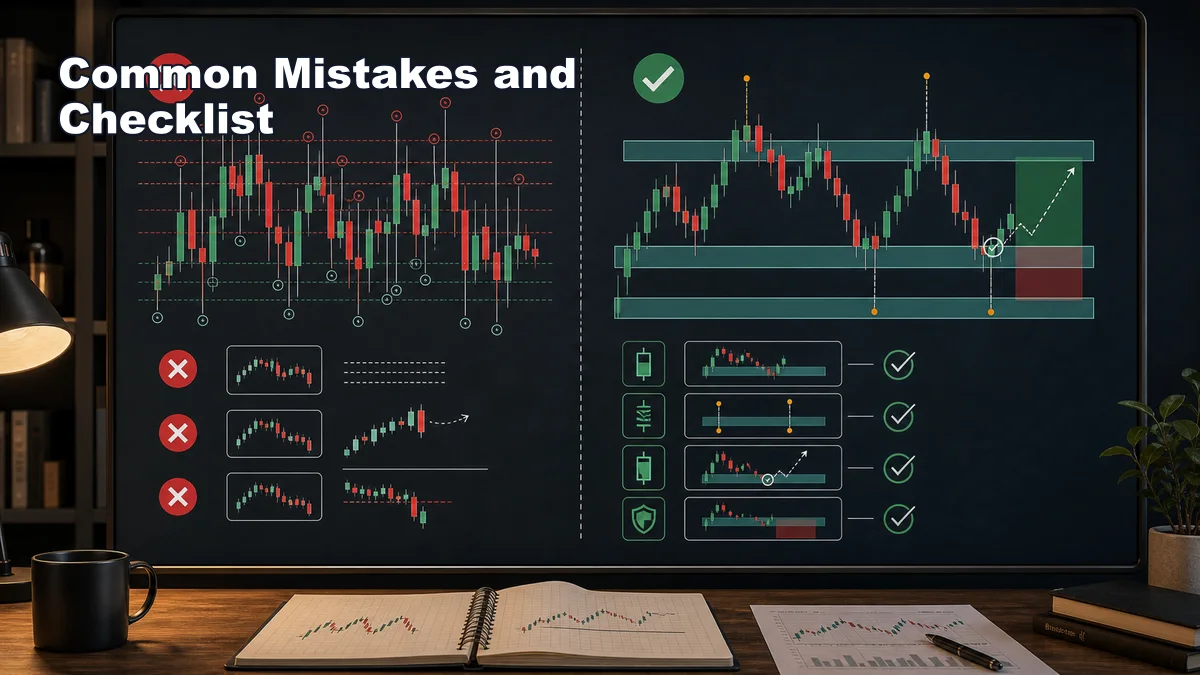
The first mistake is thinking candle bodies are always better than wicks. Bodies are often cleaner, but context decides. A liquidity sweep wick at a major higher-timeframe level can be important. A rejection wick after a failed breakout can be meaningful. The point is not to delete wicks from your analysis. The point is to stop drawing every main level from a random spike.
The second mistake is using exact lines instead of zones. Open and close prices help define the body area, but markets do not always return to a single exact price. Use a practical zone that covers the body cluster and gives room for normal movement. The zone should be clear enough to plan risk and narrow enough to avoid becoming meaningless.
The third mistake is entering before the candle closes. If your logic depends on close-based acceptance or rejection, acting before the close can create false confidence. A candle that looks like a rejection during its formation can close weak. A breakout that looks strong mid-candle can fade back into the zone.
The fourth mistake is ignoring higher-timeframe levels. A lower-timeframe body zone may look clean, but it can sit directly inside higher-timeframe resistance or support. Always check whether the trade has room before the next major decision area.
The fifth mistake is placing stops randomly. Body-based levels do not remove the need for invalidation. A stop should answer a logical question: if price reaches this area, is my reason for the trade gone? If not, the stop may be too arbitrary. If the logical stop is too wide, reduce size or skip the trade.
Use this checklist before trading MSNR close open levels:
- Have I checked the higher timeframe?
- Is the level based on obvious opens and closes, not a random wick?
- Have I marked a zone rather than a thin exact line?
- Do the wicks add useful rejection or liquidity context?
- Has price reached the zone, or am I chasing in the middle?
- Am I waiting for close-based evidence before acting?
- Do I know where the idea is invalid?
- Does the stop loss sit beyond the invalidation logic?
- Is the next target realistic after spread, fees, and nearby zones?
- Will I screenshot and review the trade afterward?
Read the Full MSNR Guide: Continue with the full MSNR trading strategy guide and connect this topic with MSNR risk management. The safest habit is to treat every level as a question, not a command: what did price accept, what did it reject, and where is the trade idea wrong?
Frequently Asked Questions
What are MSNR close open levels?
MSNR close open levels are support and resistance zones built around candle open and close prices. They focus on body-based acceptance instead of drawing every main level from a random wick extreme.
Should MSNR traders ignore wicks?
No. Wicks can show rejection, liquidity sweeps, and failed breakouts. The body zone can define the main level, while wicks help explain context, tolerance, and possible invalidation.
Is a body-based level a trading signal?
No. A body-based level is only an area to watch. A complete trade still needs context, reaction, entry rules, invalidation, stop-loss logic, position sizing, and review.
Key takeaways
- MSNR close and open levels use candle-body prices to construct zones while treating wicks as evidence about extremes and rejection.
- This is a drawing-convention article, not a general MSNR definition or a complete entry strategy.
- Choose body, wick or hybrid boundaries before testing and do not switch conventions after seeing the reaction.
- A valid plan separates location, trigger, invalidation, position size and exit logic.
A validation workflow you can reproduce
- Define the sample: choose the market, timeframe, session and date range before reviewing outcomes.
- Write the rule: Choose body, wick or hybrid boundaries before testing and do not switch conventions after seeing the reaction.
- Record invalidation: identify the observable price event that disproves the setup.
- Include execution costs: account for spread, commission and slippage where relevant.
- Validate separately: test the finished rule on data that was not used to create it.
When this concept is unreliable
The method is unreliable when opens, closes and wicks are selected inconsistently to make historical levels appear precise. Keep failed and skipped examples in the journal so the review is not limited to attractive winners.
Use this concept within a complete analysis
This method should remain connected to its parent framework and adjacent decision steps. Use What Is MSNR Trading? Meaning, Logic and Beginner Rules, MSNR Terminology: SNR, Fresh Level, Storyline, Rejection and Confluence, MSNR Chart Setup: What Tools, Timeframes and Templates You Need, How to Practice MSNR Without Risking Real Money, MSNR vs Random Support and Resistance: The Key Differences and Malaysian Support and Resistance: The Core MSNR Zone Framework to compare definitions, establish context and avoid treating one signal as a complete trading system.
References and methodology
Terminology note: SMC, ICT and MSNR terms are practitioner conventions, not standardized exchange or regulatory definitions. This article defines the convention it uses and avoids inferring participant identity from candles alone.
- CME Group — Technical Analysis
- CFTC — Eight Things to Know Before Trading Forex
- CME Group — Chart Types: Candlestick, Line and Bar
Practise before considering real capital
Use historical charts or a demo account to test the written rules before considering live execution. Review the Exness account and demo information. Availability, protections and trading conditions depend on jurisdiction, so review the applicable legal documents yourself.
Affiliate disclosure: Học Làm Trader may receive a commission if you open an account through this link, at no additional cost to you. This relationship does not determine the educational conclusions.
Risk warning: This article is for education and general information only. It is not investment advice, a trade signal or an invitation to trade. Trading can result in loss of capital, and past examples do not guarantee future results. Assess your own circumstances and risk tolerance.