


EQH (equal highs) and EQL (equal lows) in an MSNR context are near-matching swing points outside the zone. They are potential liquidity pools for a scenario, not standalone entries. This guide stays focused on how those pools behave around one mapped MSNR zone rather than teaching generic SMC terminology.
Definition in an MSNR context
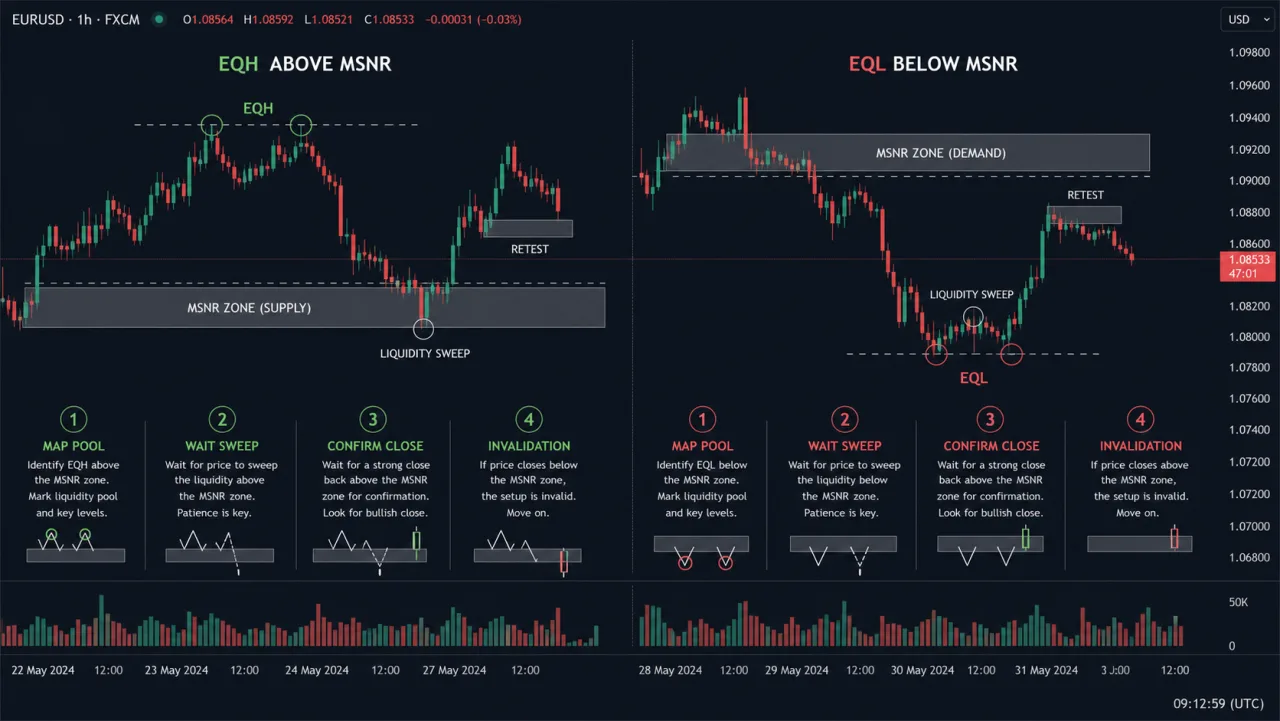
EQH means two or more swing highs close to one another under the tolerance defined by your system; EQL is the equivalent for swing lows. They become a pool when their location can attract stops or resting orders, usually just above or below an MSNR boundary. There is no universal requirement for exact equality.
Map the zone first with the MSNR strategy framework and apply the anti-overfitting zone rules. EQH/EQL does not replace the zone.
Reading EQH above a zone
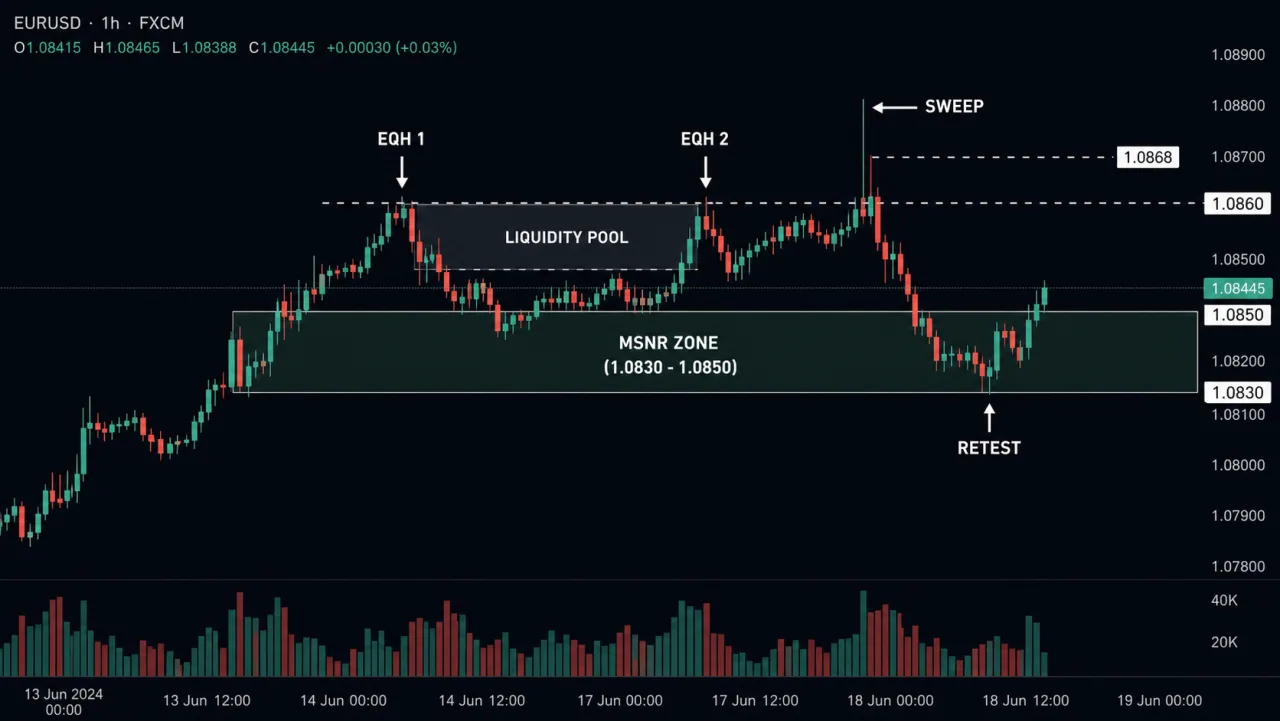
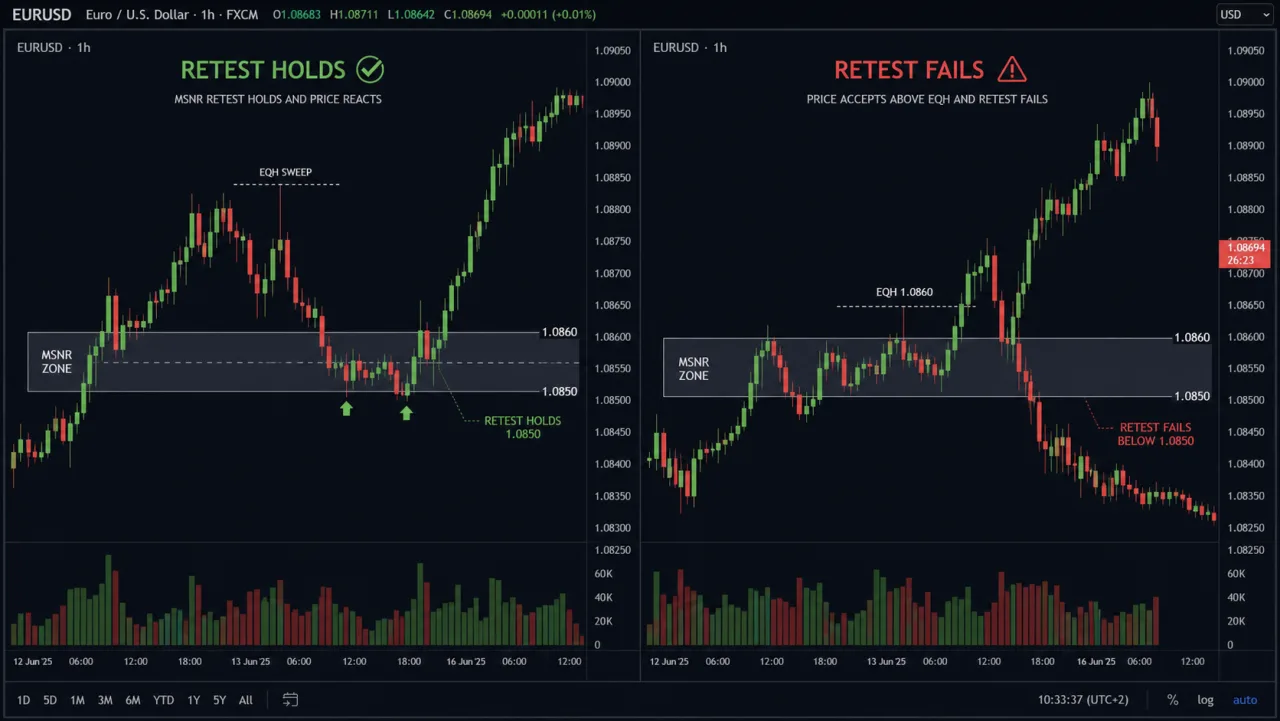
When an MSNR supply area or upper boundary is being tested, EQH above it marks a place where price may run liquidity. Record the EQH price, number of touches, distance to the zone and whether candles accept above it. A wick to 1.0868 followed by a 1.0847 close is only an observation; wait for a later close or retest.
- Pool: two highs near 1.0860, about 10 pips above the 1.0850 upper boundary.
- Sweep: a wick trades above EQH but closes back below 1.0860.
- Retest: price tests 1.0850–1.0858 and rejects, or closes and holds above the area to invalidate the fade.
Reading EQL below a zone
EQL is the mirror image. Two lows near 1.0815 below a 1.0830–1.0850 demand zone can form a pool. If price wicks to 1.0808, closes back above 1.0815 and reclaims the zone, an EQL-sweep scenario exists. If an H1 candle closes and holds below 1.0808, do not buy simply because the low was taken.
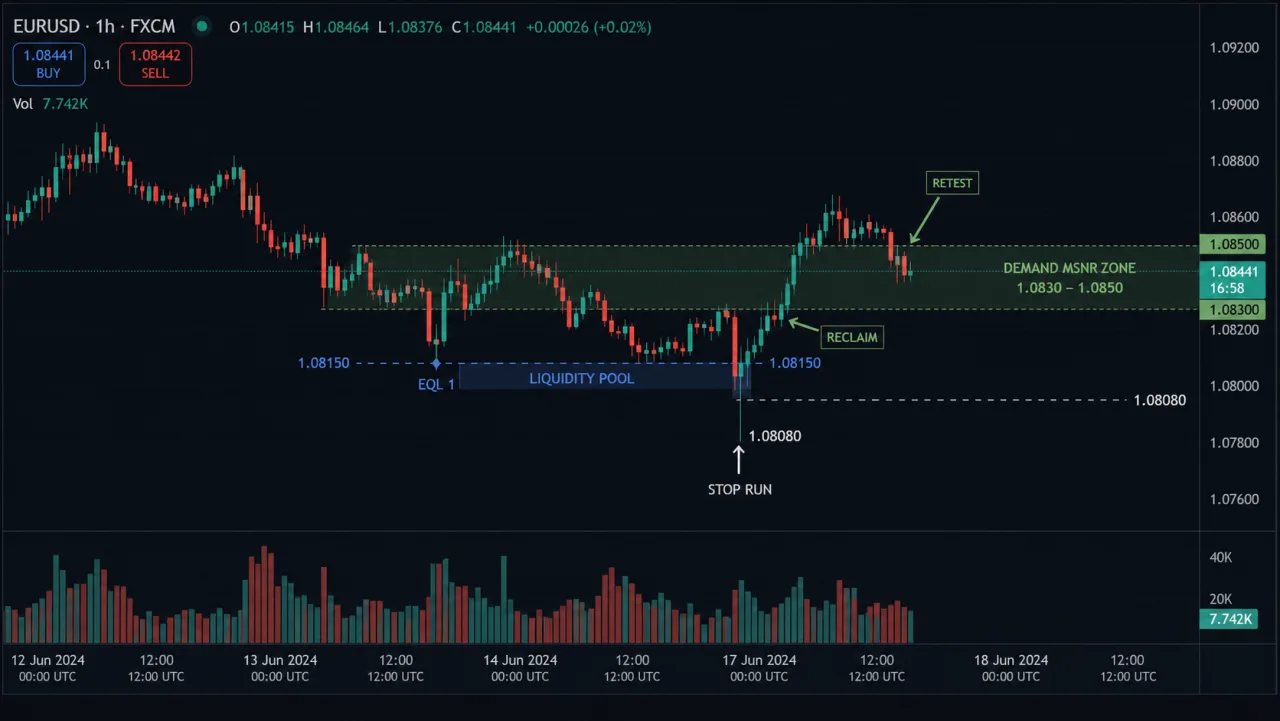
Volume in this illustration is feed-specific tick volume. Treat it as context, not proof; see Fidelity’s technical-indicator guide for the broader limitation of indicators.
EURUSD example: from pool to retest
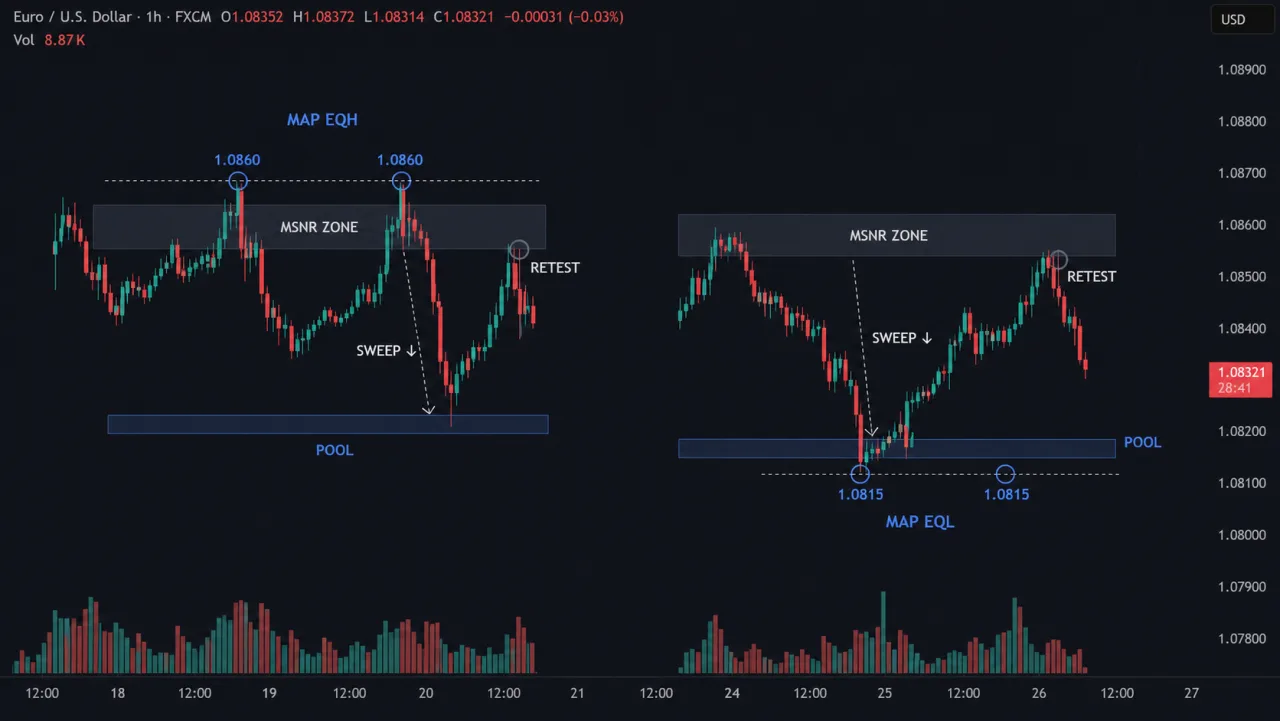
Assume EURUSD H1: zone 1.0830–1.0850; EQH printed twice at 1.0860 at 14:00 and 20:00 the prior day; EQL printed twice at 1.0815. The next day at 14:00, price sweeps EQH to 1.0868, with 12.4K tick volume versus a 6.9K 20-bar median, and closes at 1.0847. At 15:00 it closes at 1.0858; at 16:00 the 1.0850 retest holds and price trades to 1.0862. This is a hypothetical training example, not a tested performance claim.
Practical rules
- Define “near equal” tolerance before looking at the chart and keep it constant.
- Mark pools outside the zone; do not label every internal swing.
- Wait for a close and retest; EQH/EQL alone is not an entry.
- Write invalidation first: a close holding outside the pool or zone.
- Log price, time, session and feed volume so tests can be grouped.
For higher-timeframe context, combine the map with the multi-timeframe analysis guide and use market-structure context as a secondary condition.
FAQ
How equal do EQH/EQL need to be?
There is no universal number. Set tolerance for spread, volatility and timeframe, then keep it fixed in your journal and backtest.
Must a pool be swept?
No. A pool is potential liquidity; price can break out and accept outside it.
Does high volume confirm EQH/EQL?
No. Volume is feed-dependent. Closing price, location and retest determine the interpretation.
Editorial: Học Làm Trader Editorial Team · Professional review: examples are explicitly hypothetical and require independent testing. Risk note: educational content only, not trading advice.