


Elliott Wave Theory is a technical-analysis framework that classifies price movement into motive and corrective structures across multiple degrees. The familiar model contains five waves in the direction of the larger trend followed by a three-wave correction. It is a scenario framework, not proof that markets repeat with certainty. A valid analysis must respect structural rules, identify the wave degree, keep at least one alternate count and state the price level that invalidates each interpretation. This guide introduces the 5–3 model, the three core impulse rules and a practical method for avoiding constant relabeling after price moves.
What is Elliott Wave Theory? The Short Answer
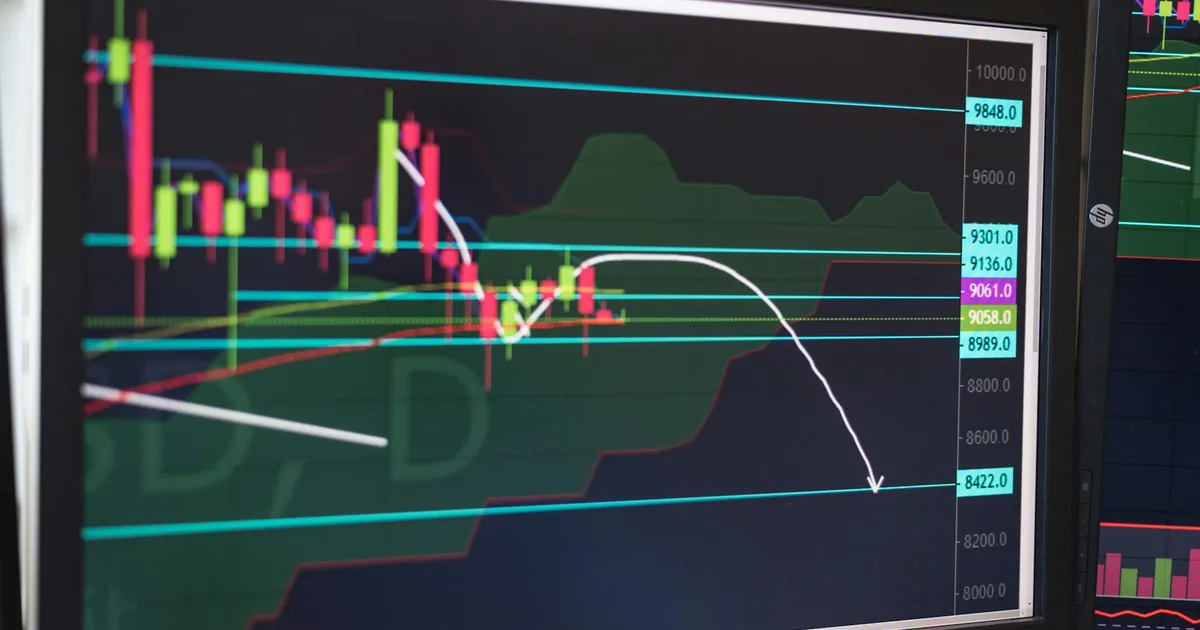
Elliott Wave Theory is a method of technical analysis that visualizes market structure as a series of repeating psychological cycles. Originally developed by Ralph Nelson Elliott in the 1930s, the theory posits that crowd psychology moves between optimism and pessimism in natural sequences.
These psychological shifts print on the price charts as specific wave patterns. Instead of viewing price movement as random noise, Elliott Wave allows you to map out the market’s current context. Are the buyers aggressively in control? Is the market simply pausing to take a breath? Or is a major reversal imminent? A wave count can organize possible next structures, but accuracy must be measured and alternate counts retained.
The 5-3 Wave Cycle: How Markets Actually Move
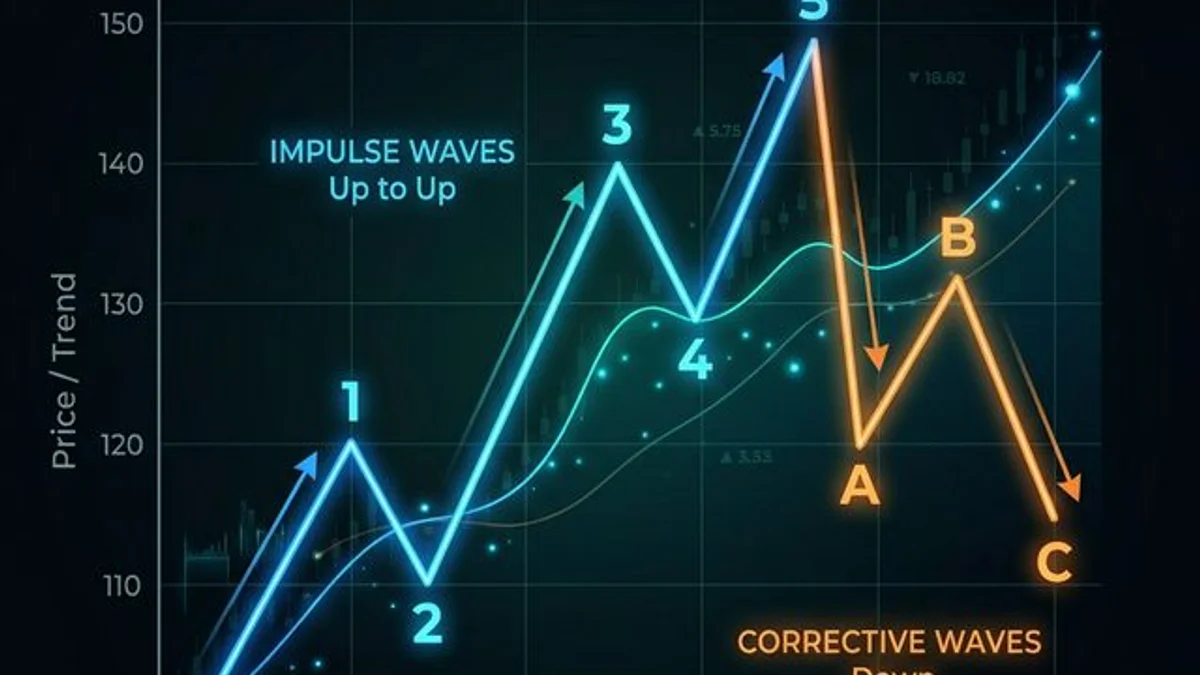
The entire foundation of the theory rests on the 5-3 wave cycle. Every complete market movement consists of an eight-wave sequence: five waves acting in the direction of the dominant trend, followed by three waves correcting that trend.
The Motive Phase (Impulse Waves 1, 2, 3, 4, 5)
This phase aggressively pushes the market in the direction of the primary trend. It is commonly characterized by expanding price progress and momentum; the chart does not identify the participants.
- Wave 1: The initial move. Often difficult to spot as it looks like a standard pullback in the previous trend.
- Wave 2: A correction of Wave 1. It retests the lows but never entirely retraces Wave 1, shaking out early buyers.
- Wave 3: The strongest, longest, and most powerful wave. This is where the retail crowd catches on, and momentum surges.
- Wave 4: A complex, frustrating consolidation phase. It is often choppy as early buyers take profits.
- Wave 5: The final push. Momentum is usually weaker here compared to Wave 3, often forming a divergence on indicators like the RSI or MACD.
The Corrective Phase (Waves A, B, C)
Once the five-wave sequence is complete, the market enters a corrective phase against the main trend.
- Wave A: The beginning of the correction. Traders often mistake this for a standard pullback.
- Wave B: A trap. The market bounces back, making traders think the main trend is resuming, but it fails to break the previous high (the top of Wave 5).
- Wave C: A strong, aggressive move opposite to the main trend, trapping those who bought Wave B. It often targets the price zone of the previous Wave 4.
The 3 Unbreakable Rules of Elliott Wave

Many traders get lost in the nuances of complex corrections (zigzags, flats, triangles), but you can eliminate 90% of bad wave counts simply by adhering strictly to the three unbreakable rules. If your count breaks any of these, your count is wrong.
- Rule 1: Wave 2 cannot retrace more than 100% of Wave 1. If the price drops below the starting point of Wave 1 in a bullish trend, the pattern is invalid.
- Rule 2: Wave 3 can never be the shortest impulse wave. While it doesn’t always have to be the longest, Wave 3 is typically the most extended and powerful. If your Wave 3 is shorter than both Wave 1 and Wave 5, redraw your charts.
- Rule 3: Wave 4 cannot overlap the price territory of Wave 1. The low of Wave 4 must remain above the high of Wave 1. If they overlap, you are likely looking at a complex correction, not an impulsive five-wave sequence.
Why Most Traders Fail With Elliott Wave

The failure rate among aspiring Elliott Wave practitioners is exceptionally high. This usually stems from a fundamental misunderstanding of the tool’s purpose.
First, traders become obsessed with finding the “perfect” count. Market structure is messy. Forgetting that waves are fractal—meaning smaller waves exist inside larger waves—traders constantly shift their counts on the 15-minute timeframe while ignoring the clear daily trend. This leads to analysis paralysis.
Second, traders use Elliott Wave in isolation. Elliott Wave tells you the context of the market, but it is a poor timing tool. Knowing the market is likely in Wave 3 does not tell you exactly where to place your buy limit order or your stop loss. It must be paired with execution strategies to be effective in live trading.
How to Actually Trade the Waves

To use this theory profitably, you must stop treating it as an exact science and start using it as a contextual overlay. A more testable approach is to consider only completed structures with a clear trigger and invalidation rather than trying to trade every labeled wave.
For example, a proposed wave 3 can offer a clear continuation scenario only after a valid wave 1 and wave 2 are established. To capture it, you wait for a completed Wave 1 and a deep pullback in Wave 2 (often settling around the 61.8% Fibonacci retracement level). You can then look for a shift in market structure (like a Change of Character or Break of Structure) on a lower timeframe to confirm the start of Wave 3.
Similarly, the end of a valid wave 4 can create a continuation scenario to trade the final Wave 5 push. Because Wave 4 cannot overlap Wave 1, you have a hard invalidation level for your stop loss, making risk management highly objective.
Ultimately, Elliott Wave Theory is a scenario map. It can highlight late-stage structures, but it cannot prevent a loss or confirm a top or bottom in advance. By mapping the psychology of the market, you can align your execution tools with the broader cyclical flow.
Disclaimer: The information provided in this article is for educational purposes only and should not be construed as personalized financial advice. Always practice proper risk management when trading live markets.
For a complete decision process, use Trading Theories: Dow, Elliott, Wyckoff and Gann and Wyckoff Method: Phases, Events and Market Context to connect the signal with structure, context and invalidation rather than reading the indicator or pattern alone.
A falsifiable wave-count workflow
- Select one timeframe and label the degree being analyzed.
- Identify completed five- and three-wave structures before forecasting the next leg.
- Check the impulse rules against the impulse-wave reference.
- Write a preferred count and one plausible alternate count.
- Mark the exact price that invalidates each count before considering an entry.
- Use multi-timeframe analysis without mixing small swings from different degrees.
- Record the original chart so hindsight does not turn an invalid count into a successful one.
Corrective structures are less uniform than a simple A–B–C diagram. Keep the broader market structure visible before assuming that every overlapping move is complete after three swings.
Use the price-action workflow to separate a wave hypothesis from the price trigger used for execution.
Primary source and risk context
- Elliott Wave International — Waveopedia
- Elliott Wave International — Motive Waves
- CFTC — Foreign Currency Trading Advisory
Practise the rules before using real capital
If you decide to practise these chart rules, start in a demo environment and record each setup before considering a live account. Open the Exness account information page. Products, availability and trading conditions vary by jurisdiction; review the applicable terms and regulatory information yourself.
Affiliate disclosure: Học Làm Trader may receive a commission if you open an account through this link, at no additional cost to you. The relationship does not change the educational analysis or remove trading risk.
Risk warning: This article is for education and general information only. It is not investment advice, a trade signal, or an invitation to trade. Technical-analysis tools are based on historical market data and can fail. Trading can result in loss of capital; test rules, define invalidation, and size risk before using real money.
Related guides in this topic
- Elliott Wave Impulse Waves Explained
Two corrective structures deserve separate study. Use the Zigzag, Flat and Triangle guide to classify three- and five-leg corrections, then compare Leading and Ending Diagonals when five overlapping waves form a wedge.
Related reading: Leading vs Ending Diagonal: How to Read Elliott Wave Diagonals
Related reading: Elliott Corrective Waves: Zigzag, Flat and Triangle Explained
Selected supporting guide: After the overview, use How to Count Elliott Waves Correctly to make the count explicit before comparing impulse, corrective and diagonal structures.