


how to draw MSNR levels Drawing MSNR levels means applying one zone-construction convention to selected price reactions before price returns to them. This page focuses on the drawing task and does not replace the broader strategy or support-versus-resistance guides. The method should be treated as a testable chart-reading framework rather than a forecast. Before using it, define the market condition, confirmation event, invalidation price, transaction costs and maximum risk. This guide explains the rules, a repeatable workflow, common failure modes and the most relevant supporting concepts.
What How to Draw MSNR Levels Means in MSNR
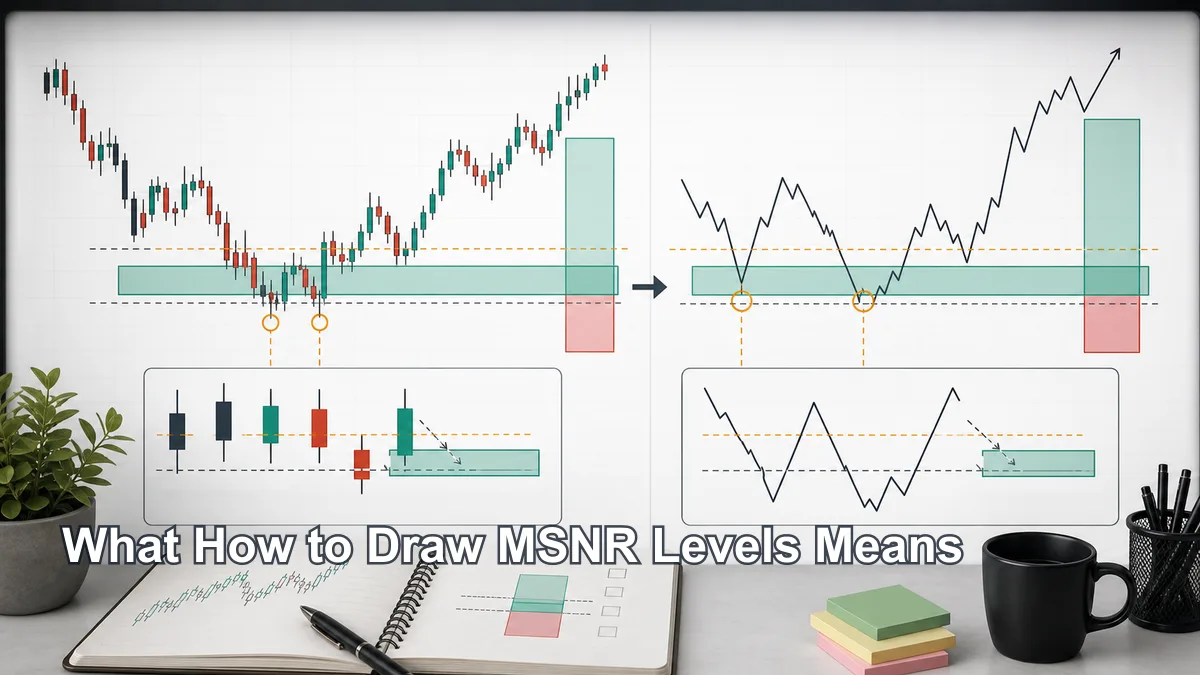
In MSNR, drawing a level means identifying a support or resistance area that has practical trading meaning. It is not the same as placing a horizontal line on every visible high and low. A useful MSNR level usually comes from a place where price reacted clearly, where candle bodies created a meaningful close-open area, or where a swing point became obvious on both candlestick and line-chart views.
The body logic matters because candle bodies show where price opened and closed during the selected period. Wicks can show rejection, but a single wick can also be noise, liquidity sweep, news volatility, or a temporary overshoot. MSNR traders often use candle bodies to build a more stable working zone, then use wicks as context rather than the only drawing anchor.
The line-chart view can also help. A line chart usually connects closing prices, which makes swing structure easier to see. If a beginner is confused by wick noise, switching briefly to a line chart can reveal the clean support or resistance backbone. The trader can then return to the candlestick chart and refine the zone using candle bodies and reaction areas.
That is why MSNR levels are better thought of as zones, not exact lines. Price may react slightly above or below the level. It may sweep through the zone and close back inside. It may retest the zone before continuing. If the trader expects a perfect one-pixel reaction, they may enter too early or place stops too tightly.
A simple MSNR drawing rule is this: draw fewer levels, but make each level earn its place on the chart. The level should answer three questions:
- Where did price make a meaningful decision?
- Which part of the candle structure defines the working zone?
- Where would the idea be wrong if price does not respect the zone?
If a level cannot answer those questions, it may not be useful enough for a trade plan. It can still be a visual reference, but it should not be treated as an entry signal.
Why It Matters Before Taking a Trade
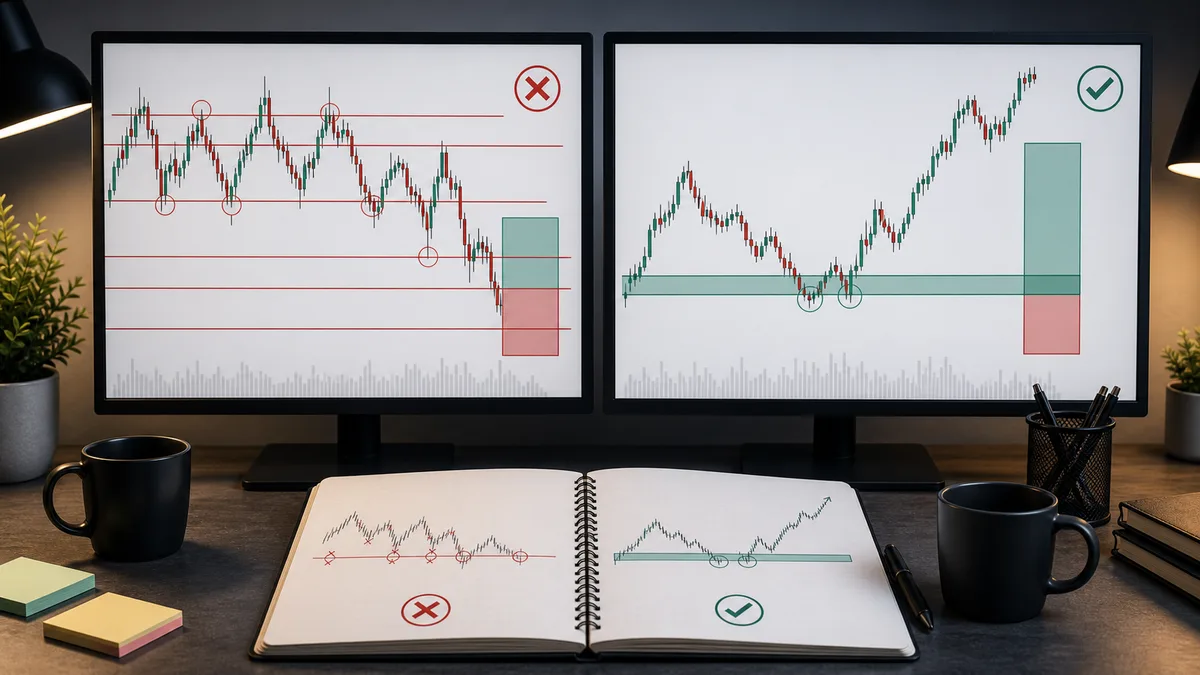
Drawing the level correctly matters because the level becomes the foundation for the entire trade idea. If the level is random, the entry becomes random. If the entry is random, the stop loss often becomes emotional. A trader may then move the stop, add to a losing position, or blame the market when the real problem started with a weak drawing process.
A well-drawn MSNR level does three things before a trade. First, it filters the chart. Instead of reacting to every small swing, the trader focuses on the zones that have the clearest structure. Second, it improves trade location. A cleaner zone can help the trader avoid chasing price in the middle of a move. Third, it creates a logical invalidation point. If the trade idea depends on the level holding, then a clean break beyond that zone may show that the idea is wrong.
This is important for beginner and intermediate traders because support resistance line chart analysis can look simple after the fact. Historical charts make every reaction look obvious. In real time, the trader has to decide which level matters before the reaction happens. A structured MSNR drawing process helps reduce hindsight bias.
The drawing process also affects review quality. If you save a chart and write, “I bought at support,” that is not enough data. If you write, “I marked a fresh MSNR support zone from the candle body close-open area, confirmed the line-chart swing, waited for a rejection trigger, and placed invalidation below the zone,” you can review whether the rule actually helped.
MSNR is not a guarantee. A clean level can fail. A poorly drawn level can occasionally work. The point is not to predict every reaction. The point is to build a repeatable process that can be tested. Without repeatability, the trader is only collecting chart opinions.
Step-by-Step Chart-Reading Workflow
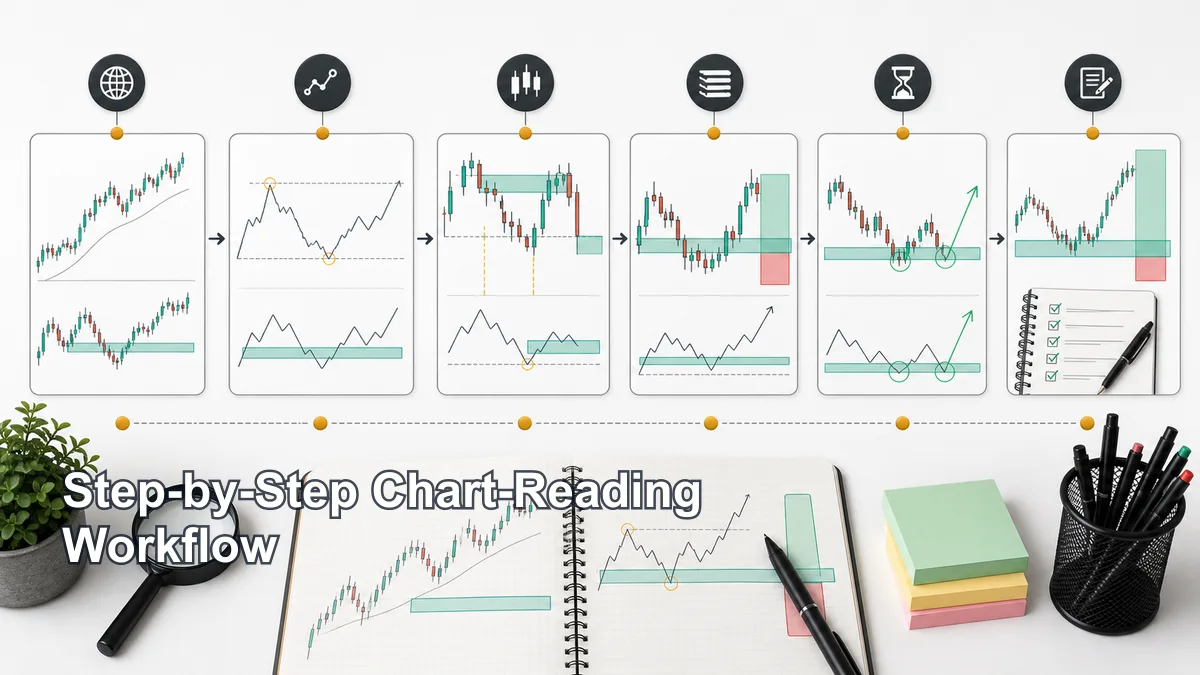
Use this workflow as a starting point for practice. Adjust it only after testing, not because one chart feels uncomfortable.
Step 1: Choose the timeframe. Decide where the level is being drawn. A daily level, 4-hour level and 15-minute level do not carry the same meaning. Start with the timeframe that matches your trading plan, then check one higher timeframe for context.
Step 2: Identify the market condition. Ask whether price is trending, ranging, compressing or transitioning. Support and resistance levels behave differently in different environments. In a strong uptrend, support may matter more than nearby resistance. In a range, both edges may matter until one side fails.
Step 3: Switch briefly to a line chart. This step is optional but useful for beginners. The line chart removes some wick noise and helps you see where price actually closed around swing points. If the swing is not visible on the line chart, be careful about treating it as a major level.
Step 4: Return to candles and find the body zone. Look for the open and close structure around the reaction. The body zone may sit near the start of an impulse, the edge of a range, or a place where price rejected strongly. Mark a zone, not a thin line.
Step 5: Use wicks as context. Wicks can show rejection, liquidity grabs or volatility. They are useful, but they should not automatically define the whole level. If a wick is far away from the body zone, ask whether it represents true structure or a temporary overshoot.
Step 6: Check whether the level is fresh. A level that has been touched many times may still be visible, but its quality may be different from a fresh zone. Marking freshness helps you decide whether the level is worth trading, worth watching, or better used only as context.
Step 7: Wait for price behavior. The drawn level is only an area of interest. Before entry, watch how price approaches it. Is the approach fast or slow? Is there rejection, acceptance, a sweep, a breakout or a retest? The reaction matters more than the drawing itself.
Step 8: Record the level in your journal. Save the chart before and after the trade. Note why the level was drawn, whether the trigger appeared, where invalidation sat, and what happened. This turns MSNR level drawing into a testable skill.
Entry, Invalidation and Stop-Loss Logic
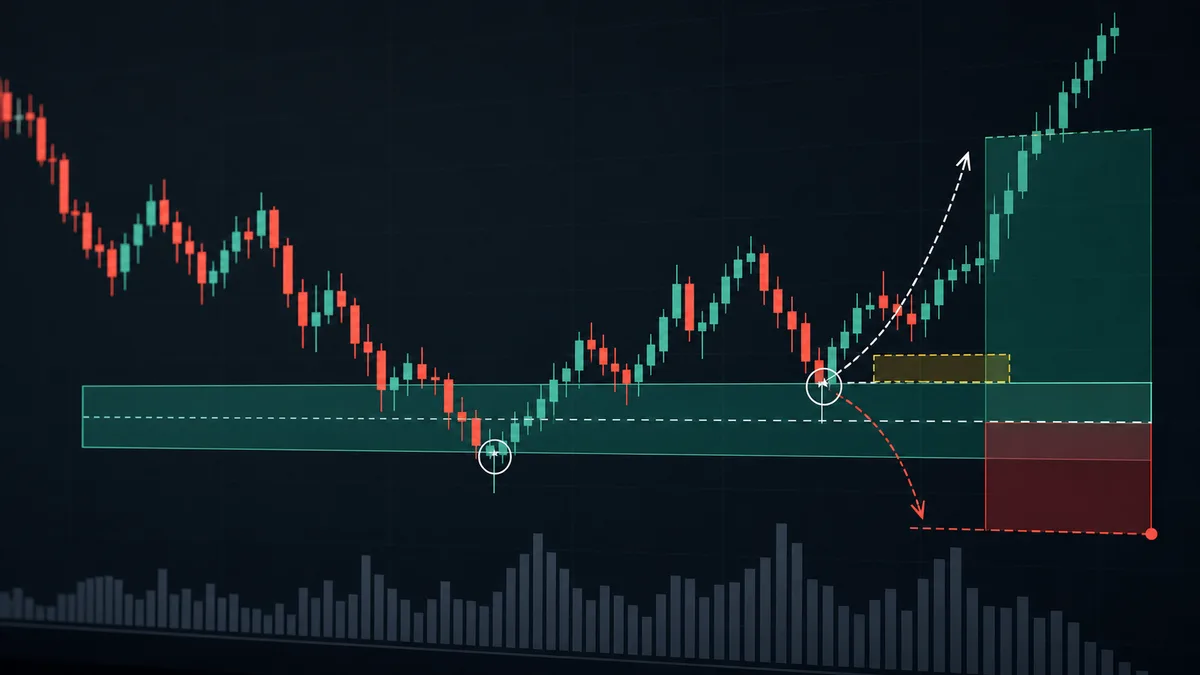
A drawn MSNR level is not an entry signal by itself. It is a location where the trader may become interested. The entry still needs a trigger. The invalidation still needs to be defined. The stop loss still needs to match the trade idea and position size.
For a support setup, the trader may draw a body-based MSNR zone and wait for price to return. A possible trigger could be a rejection candle, a failed breakdown, a lower-timeframe structure shift, or a retest after reclaiming the zone. The trigger should be chosen before the trade, not invented after price starts moving.
For a resistance setup, the same logic applies in reverse. The trader may draw a clean resistance zone, wait for price to approach it, and then look for rejection or acceptance. If price accepts above the zone and closes strongly through it, the short idea may be invalid. If price rejects and confirms a trigger, the trader can then evaluate risk.
Invalidation is the point where the reason for the trade no longer makes sense. If a long idea depends on an MSNR support zone holding, then a decisive break below that zone may invalidate the setup. If a short idea depends on resistance holding, then acceptance above the zone may invalidate the setup. This does not mean every stop should sit exactly at the zone edge. Volatility, spread, timeframe and candle structure all matter.
The stop loss should be planned after invalidation is clear. If the stop is too tight, normal market noise may hit it before the idea is truly wrong. If the stop is too wide, the reward-to-risk may become unattractive. Good risk management trading connects the chart idea to position size, not emotion.
Before entering, ask whether the drawn level gives enough room to the next opposing zone. A long entry directly below resistance may not offer enough room. A short entry directly above support may have the same problem. MSNR drawing helps with both entry location and target awareness.
Common Mistakes and Checklist
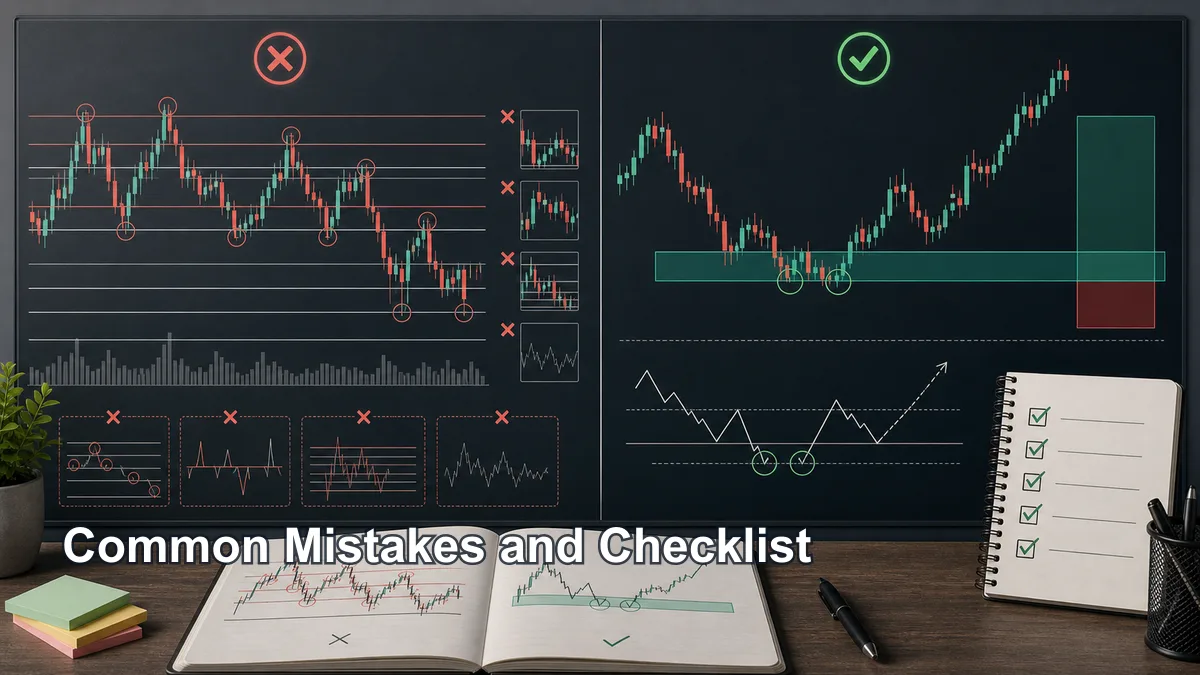
The first mistake is drawing too many levels. A crowded chart makes every price move look important. If every line matters, no line matters. Start with the cleanest zones and ignore weak internal noise.
The second mistake is drawing only from wicks. Wicks can be useful, but they can also exaggerate the level. Combine wick information with candle body and close-open logic.
The third mistake is ignoring the line-chart view. The line chart is not magic, but it can help beginners see the core swing structure. If the line chart shows a cleaner level than the candle chart, use it as a guide and refine with candles.
The fourth mistake is treating the level as the trade. The level is only the location. You still need context, trigger, invalidation, stop-loss planning and position sizing.
The fifth mistake is adjusting levels after the outcome. If price barely missed your level and then moved, do not redraw the level to make the trade look perfect. Save before-and-after screenshots so your review stays honest.
Use this checklist when practicing how to draw MSNR levels:
- The timeframe and higher-timeframe context are clear.
- The level comes from a meaningful reaction, not a random candle.
- The line-chart swing supports the area.
- The candle body close-open zone is visible.
- Wicks are used as context, not blindly copied.
- The zone is fresh enough for your tested model.
- The trigger is defined before entry.
- Invalidation and stop-loss logic are planned before risk is taken.
- The chart will be saved and reviewed whether the trade wins or loses.
CTA: To connect level drawing with the full method, read the Full MSNR Guide.
FAQs About Drawing MSNR Levels
Should MSNR levels be drawn from wicks or candle bodies?
MSNR often gives more weight to candle body and close-open logic, while still using wicks as context. The goal is to create a practical zone, not a fragile one-pixel line.
Why use a line chart when drawing Malaysian SNR levels?
A line chart can reduce wick noise and make swing structure easier to see. It is a guide, not a replacement for candlestick analysis.
How many MSNR levels should I draw?
Draw as few as possible while still capturing the major decision zones. Too many levels usually create confusion and weak review data.
Can a clean MSNR level still fail?
Yes. Any support or resistance level can fail. That is why every setup needs invalidation, stop-loss planning and position sizing.
Is this a trading signal?
No. This article explains an educational drawing process. A level is not a signal by itself, and no profit is guaranteed.
Author note: Prepared by the Hoc Lam Trader editorial team for educational use. This guide was updated on May 11, 2026. Use screenshots, backtesting and demo practice before live use, and treat every chart example as a hypothesis rather than a promise.
Key takeaways
- Drawing MSNR levels means applying one zone-construction convention to selected price reactions before price returns to them.
- This page focuses on the drawing task and does not replace the broader strategy or support-versus-resistance guides.
- Select the timeframe and origin, mark boundaries once and save a before-chart screenshot for review.
- A valid plan separates location, trigger, invalidation, position size and exit logic.
A validation workflow you can reproduce
- Define the sample: choose the market, timeframe, session and date range before reviewing outcomes.
- Write the rule: Select the timeframe and origin, mark boundaries once and save a before-chart screenshot for review.
- Record invalidation: identify the observable price event that disproves the setup.
- Include execution costs: account for spread, commission and slippage where relevant.
- Validate separately: test the finished rule on data that was not used to create it.
When this concept is unreliable
Level drawing is unreliable when zones are widened after a miss or every nearby candle is used to create overlapping areas. Keep failed and skipped examples in the journal so the review is not limited to attractive winners.
Use this concept within a complete analysis
This method should remain connected to its parent framework and adjacent decision steps. Use Malaysian Support and Resistance: The Core MSNR Zone Framework, Fresh vs Unfresh SNR Levels: How to Judge Zone Quality, What Is MSNR Trading? Meaning, Logic and Beginner Rules, How MSNR Uses Close and Open Prices Instead of Random Wick Lines, MSNR Terminology: SNR, Fresh Level, Storyline, Rejection and Confluence and MSNR Chart Setup: What Tools, Timeframes and Templates You Need to compare definitions, establish context and avoid treating one signal as a complete trading system.
References and methodology
Terminology note: SMC, ICT and MSNR terms are practitioner conventions, not standardized exchange or regulatory definitions. This article defines the convention it uses and avoids inferring participant identity from candles alone.
- CME Group — Technical Analysis
- CFTC — Eight Things to Know Before Trading Forex
- CME Group — Chart Types: Candlestick, Line and Bar
Practise before considering real capital
Use historical charts or a demo account to test the written rules before considering live execution. Review the Exness account and demo information. Availability, protections and trading conditions depend on jurisdiction, so review the applicable legal documents yourself.
Affiliate disclosure: Học Làm Trader may receive a commission if you open an account through this link, at no additional cost to you. This relationship does not determine the educational conclusions.
Risk warning: This article is for education and general information only. It is not investment advice, a trade signal or an invitation to trade. Trading can result in loss of capital, and past examples do not guarantee future results. Assess your own circumstances and risk tolerance.