


Market cycle analysis describes the market state — often accumulation, markup, distribution or markdown — so a trader can build conditional scenarios. It does not identify an exact turning point, and it does not replace risk management.
It is easy to call any sideways section “accumulation” or “distribution.” That shortcut removes the information that matters: what preceded the range, how price behaves inside it, and what would prove the label wrong. This guide treats the market cycle as a context layer before using Price Action, Wyckoff terminology or an indicator.
The four phases in market cycle analysis
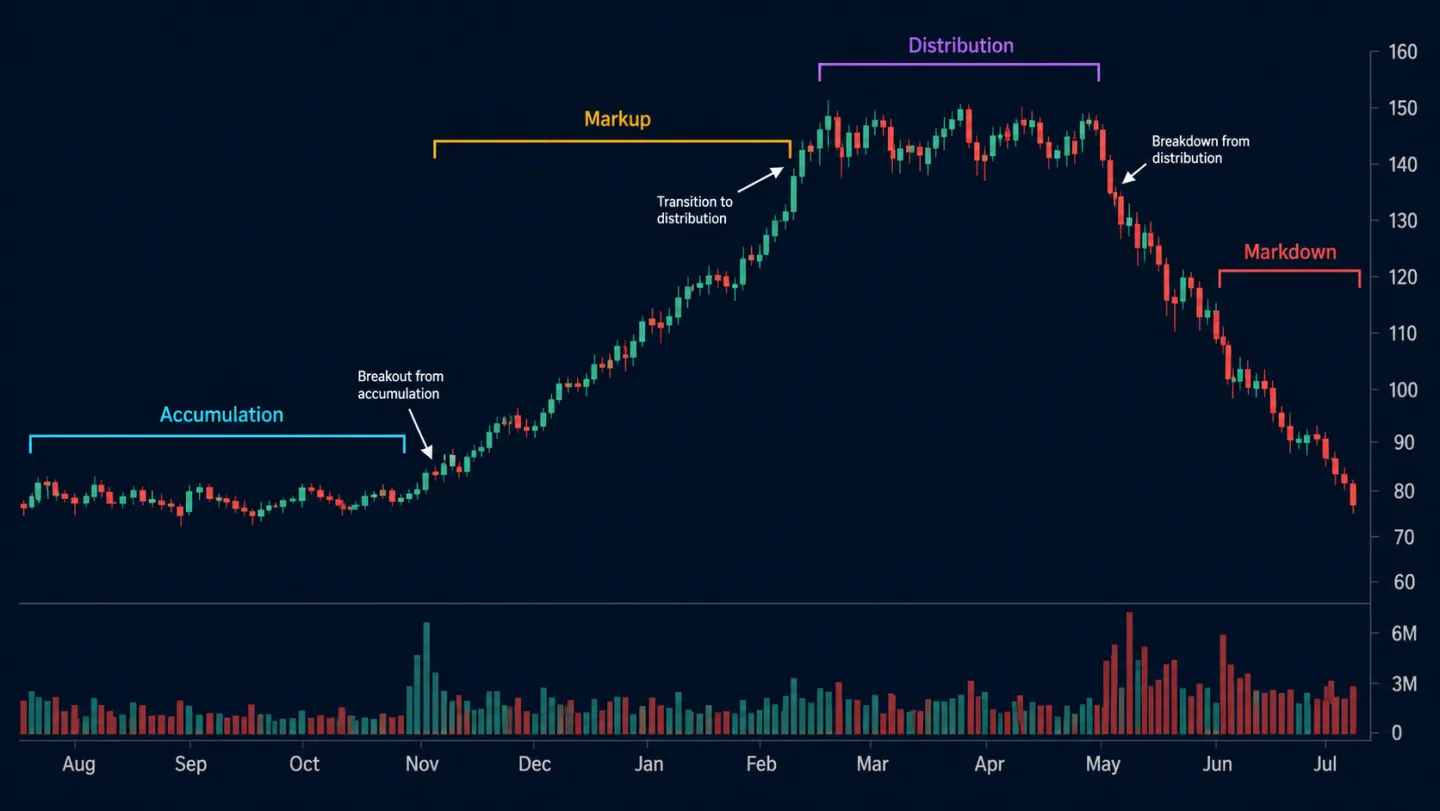
Accumulation is commonly used for a balance area after a decline or after the old trend has clearly weakened. Overlapping candles, repeated tests of both edges and a contained range can be useful observations. A range alone is not proof of accumulation, however; it may simply pause before another decline. Start with the neutral label “range” until new evidence arrives.
Markup is a sequence of higher highs and higher lows with visible displacement and pullbacks that do not destroy the structure. One strong green candle is weaker evidence than price closing and holding outside the former balance area, ideally with a clearly defined retest rule.
Distribution is a label sometimes applied to a volatile range after an advance when follow-through weakens. Not every range near a high is distribution. Treat it as a higher-volatility balance area until price accepts below the range or resumes the advance.
Markdown is the inverse structural description: lower highs, lower lows, failed recoveries of lost levels and continued closes below former balance. It describes price behaviour; it is not a command to short.
Use structure, range width and follow-through as evidence
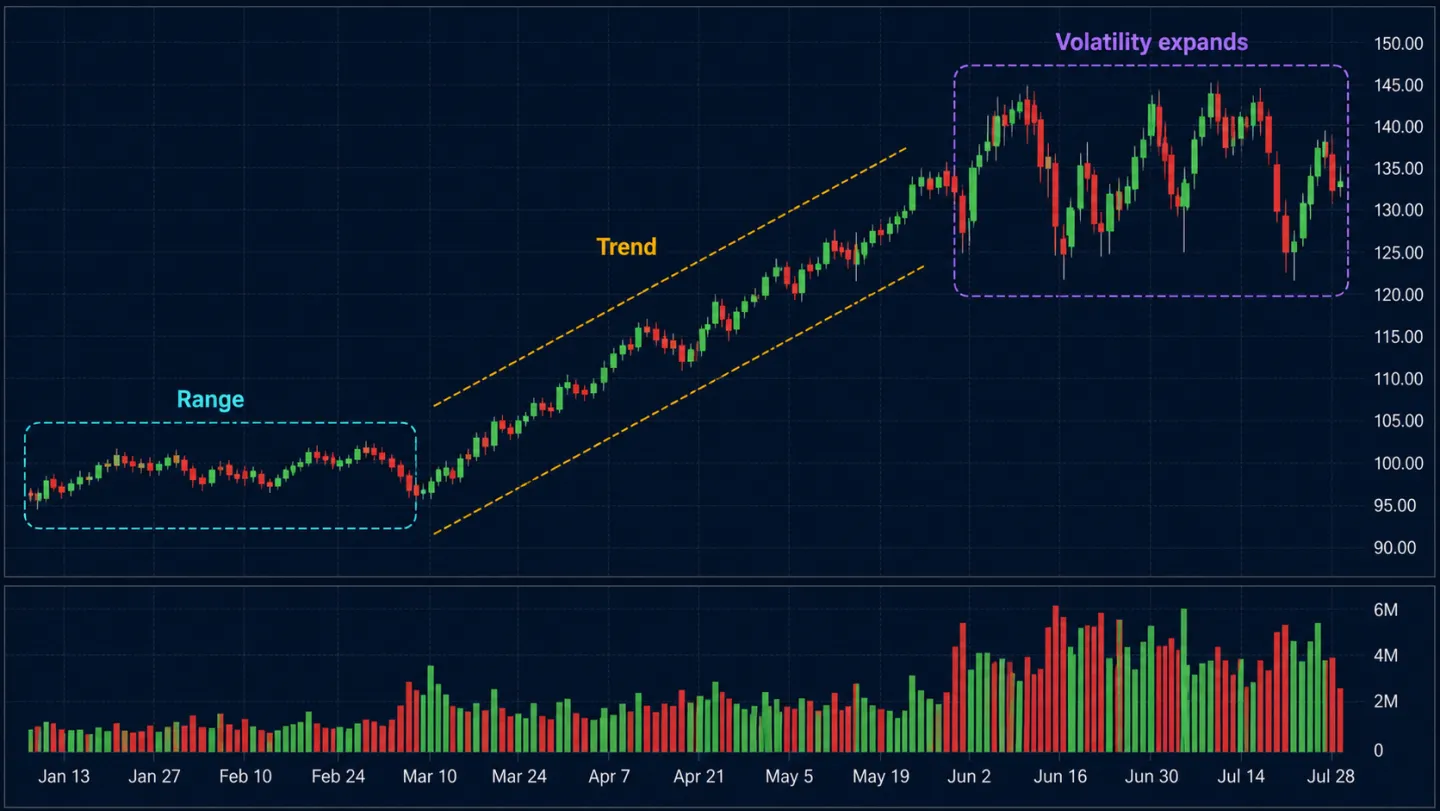
Three observations make a cycle framework more useful than a visual label. First, assess structure: is price respecting a two-sided range or producing directional swings? Second, assess range width: are candles, ATR or the overall range contracting or expanding? Third, assess follow-through: does a break produce multiple closes outside the range, or is price immediately pulled back inside?
Volume can add context for centralized futures or equities. In spot Forex, tick volume comes from one feed rather than the whole market, so a single volume spike cannot prove a phase. Record the timeframe, volume source, location in the range and the behaviour after the break instead.
For an illustrative D1 range between 1.0900 and 1.1100, one close at 1.1120 is not enough to declare markup. A transparent rule might require two D1 closes above the edge, or one close plus a retest that holds under a pre-written rule. If price closes back inside, the breakout scenario weakens; it should not be explained away with a new label.
Use this framework alongside market structure, multi-timeframe analysis and the Wyckoff method. Each page has a different job: the cycle supplies broad context, while the supporting framework supplies a testable rule.
Turn a market cycle into scenarios, not predictions
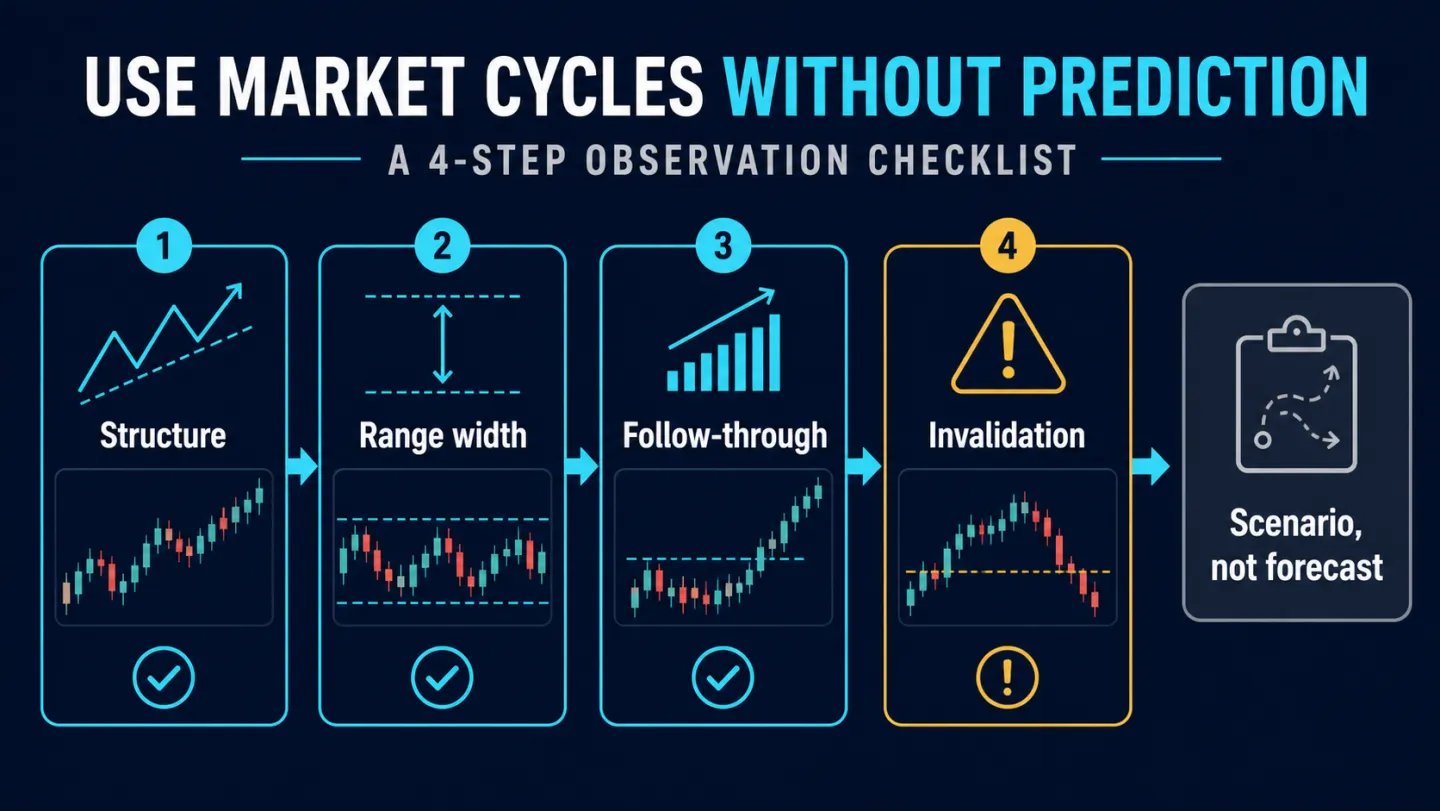
- Choose one context timeframe, such as D1 or H4, and a lower execution timeframe. Do not change timeframes only to find a preferred label.
- Mark the relevant range or swing first. Record range boundaries, closes beyond them, swing sequence and volatility.
- Write at least two scenarios: continuation and failure. Each needs a trigger and an invalidation condition.
- If a trade is considered, size it from the stop distance and chosen risk limit. A market-cycle label does not determine trade size.
- Save the chart, timeframe, observation date and outcome. Review a meaningful sample before claiming that a rule is reliable.
When to reduce the weight of the label
Reduce the weight of a cycle label when the range is too small relative to spread or volatility, when an event may change liquidity conditions, when volume data are weak, or when timeframes materially conflict. In these cases, plainly defined levels, structure and invalidation are generally more useful than forcing a phase name.
Risk disclosure: This educational content is not investment advice or a trade signal. Charts are illustrative; markets involve a risk of loss.
Sources and limits
- CMT Association — general technical-analysis education.
- Investor.gov — public financial-literacy and investment-risk education.
- The charts in this article are educational illustrations, not backtest data or evidence that a setup will work.