


Compression before an MSNR zone describes a narrowing trading range as price approaches support or resistance. It can precede a breakout, a sweep-and-reclaim or a fakeout; compression alone does not predict direction. This guide uses a hypothetical price, time and volume example and adds explicit fakeout filters.
What is compression before MSNR?
Compression is a sequence with a falling high-to-low range or a tighter distribution. Near an MSNR boundary it may resolve as a breakout, a sweep followed by a reclaim or a fakeout. The MSNR zone remains the anchor; compression only describes volatility around it.
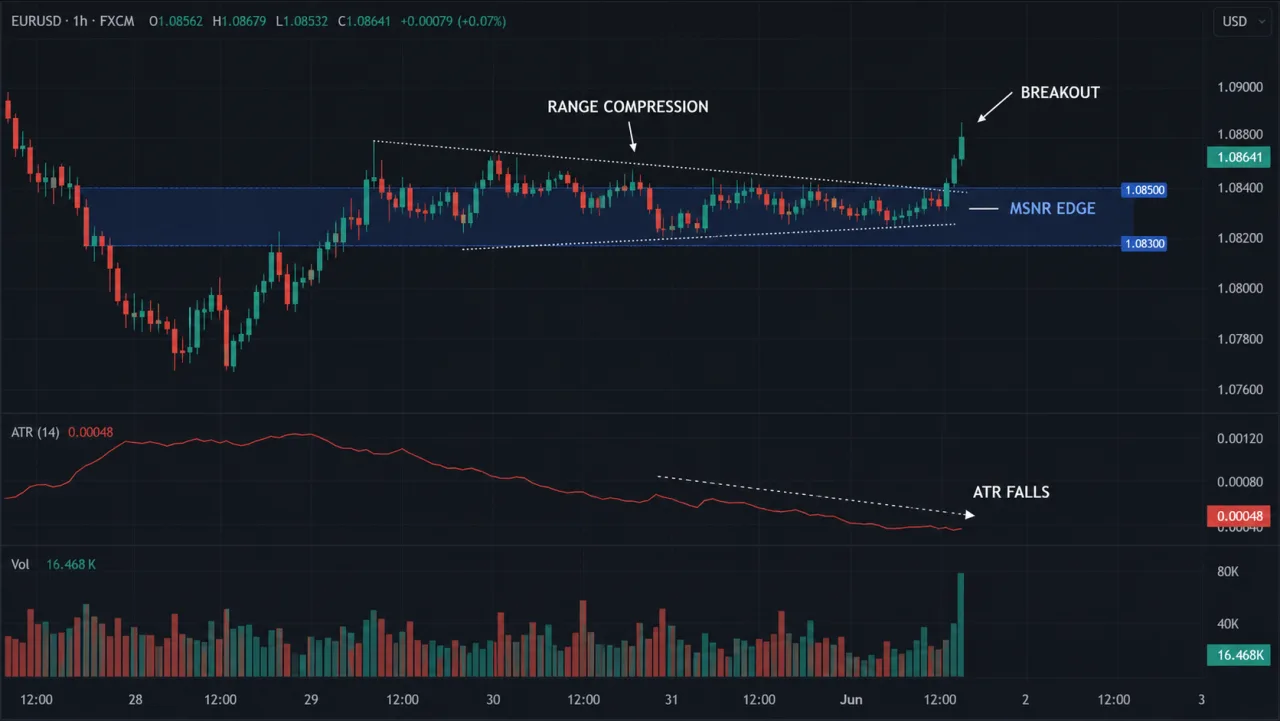
Map the zone first with the MSNR strategy framework and the anti-overfitting zone rules.
Measure range contraction and context
Do not rely on the visual impression of “small candles.” Record the 20-bar median range, ATR(14), boundary touches and session. In a hypothetical EURUSD H1 sample, the median range falls from 9 pips to 4 pips over eight bars and ATR(14) drops from 10.5 to 6.2 pips. Compression is more relevant at the zone edge than in the middle of an already expanded trend.
- Location: compression sits at an MSNR boundary.
- Time: log session and scheduled events that can release volatility.
- Space: leave room to the next liquidity pool.
Fakeout filters
A breakout is more reliable when the close, range and retest agree; volume is feed-dependent context. Use this checklist:
- The candle closes outside MSNR rather than only wicking through it.
- Breakout range expands beyond the compression median without being a lone spike.
- The next candle does not immediately close back inside the zone.
- A retest holds the boundary or creates clear acceptance outside.
- No unusual news/session condition makes the volume comparison misleading.
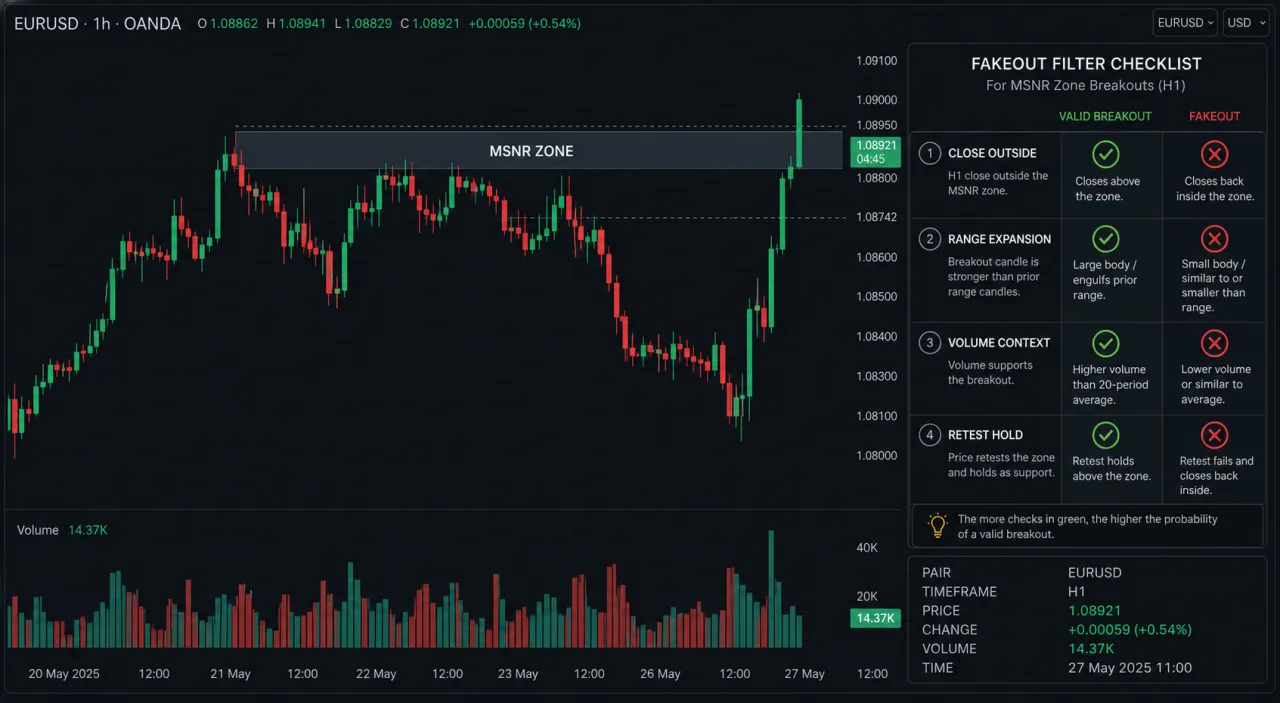
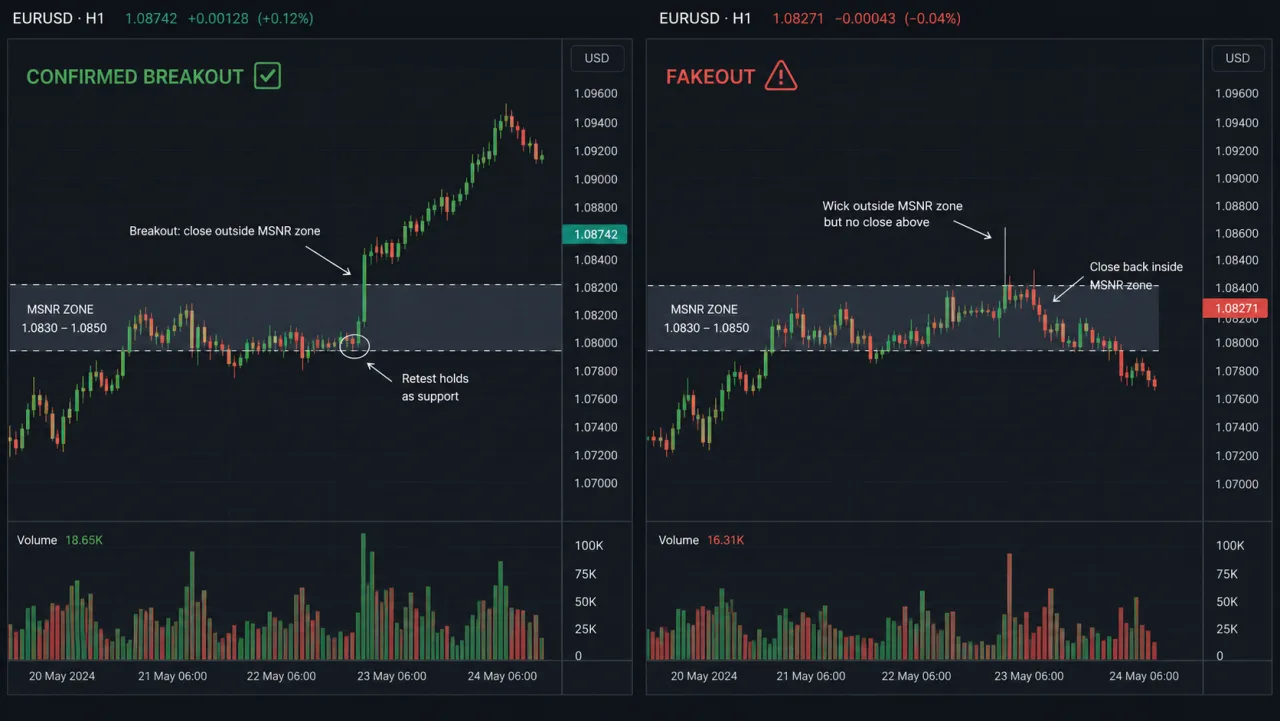
This avoids predicting direction from contraction alone. If price takes liquidity and reclaims, use the MSNR liquidity-sweep process.
EURUSD example with price, time and volume
Assume EURUSD H1 has an MSNR zone at 1.0830–1.0850. From 11:00 to 18:00 UTC, eight hourly bars contract; the 20-bar median range is 8 pips while compression bars are 3–4 pips. At 19:00, a candle closes at 1.0858 above 1.0850 with an 11-pip range. Tick volume is 13.2K versus a 7.1K 20-bar median. At 20:00, price retests 1.0851 and closes 1.0856; that is stronger acceptance than a 1.0846 close back inside.
Forex tick volume is broker-dependent and not centralized. Compare the same feed and session over a meaningful sample; Fidelity’s OHLC guide is a useful reference for candle reading.
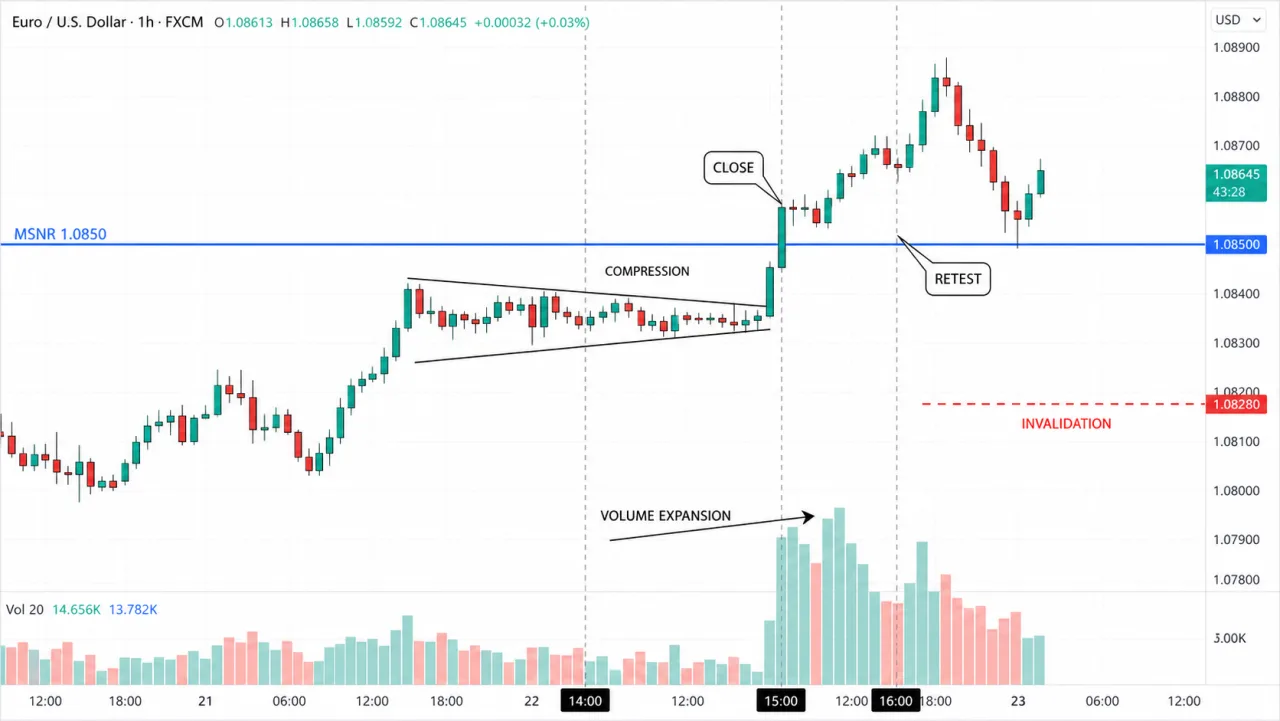
Breakout plan and invalidation
Build a plan only after defining invalidation. For the long example, invalidation can be an H1 close back below 1.0830 or below the retest low according to your tested rules. An entry after close/retest is different from entering the instant range breaks. Stops should not move because of a new wick, and targets should use R and the next liquidity area rather than assume a long trend.
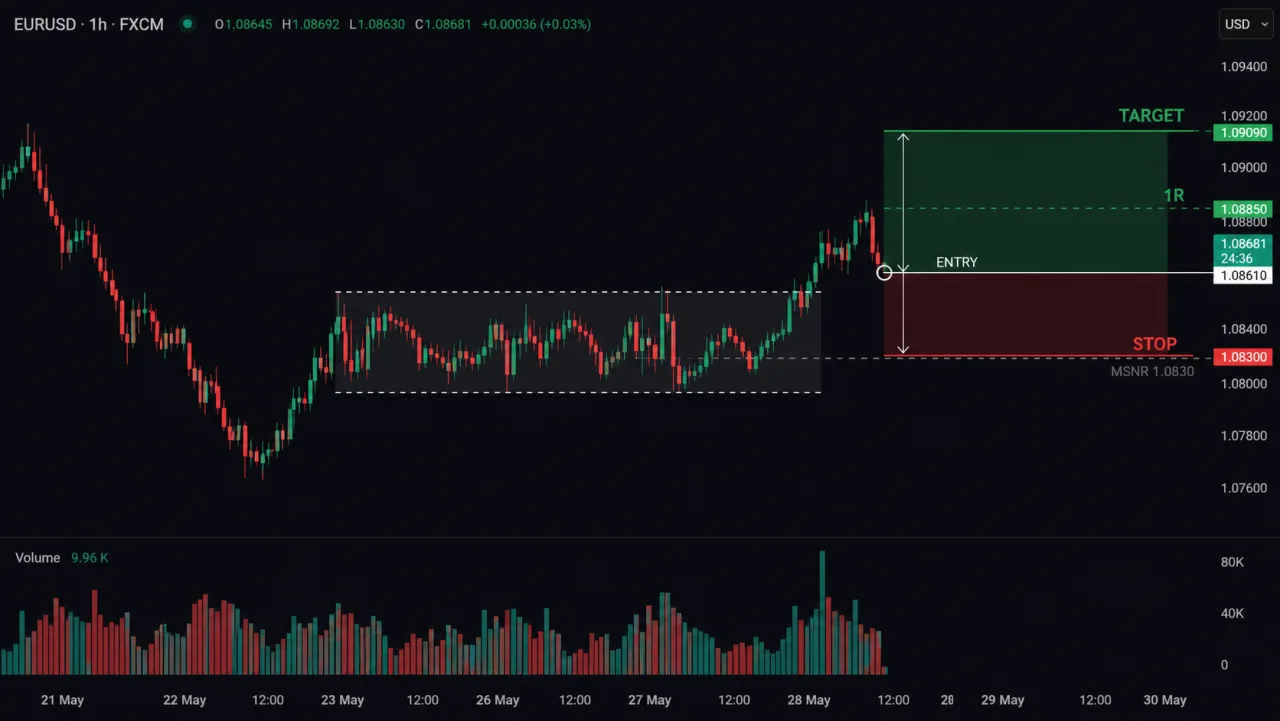
Use the multi-timeframe analysis guide to avoid trading an H1 breakout against higher-timeframe bias.
FAQ
Must compression lead to a breakout?
No. It can resolve as a sweep, breakout or continued range.
Does higher volume confirm it?
No. Volume is supporting context; close, retest and acceptance carry more weight.
How many bars define compression?
There is no universal number. Choose a 6–10 bar window, measure median/ATR and test it by market.
Editorial: Học Làm Trader Editorial Team · Professional review: examples are explicitly hypothetical and require independent testing. Risk note: educational content only, not investment advice.